Sample Category Title
Gold: Technical Vs Fundamental Analysis
- Fed's rate decision due this week
- Technicals shows more weakness for gold
We have a number of central bankers making a decision about their monetary policy but the one which matters the most is the Fed rate decision on Thursday. Although, no new action is expected from the Fed when it comes to the interest rate. But traders would like to gauge the Fed’s stance about the future rate hikes for this year.
If the Fed shows their confidence in their previous view (under which they still see two more rate hikes for this year), despite the fact that Donald Trump has raised his concerns about the interest rate, we would expect the dollar price to move higher and that would have the potential to push the price lower.
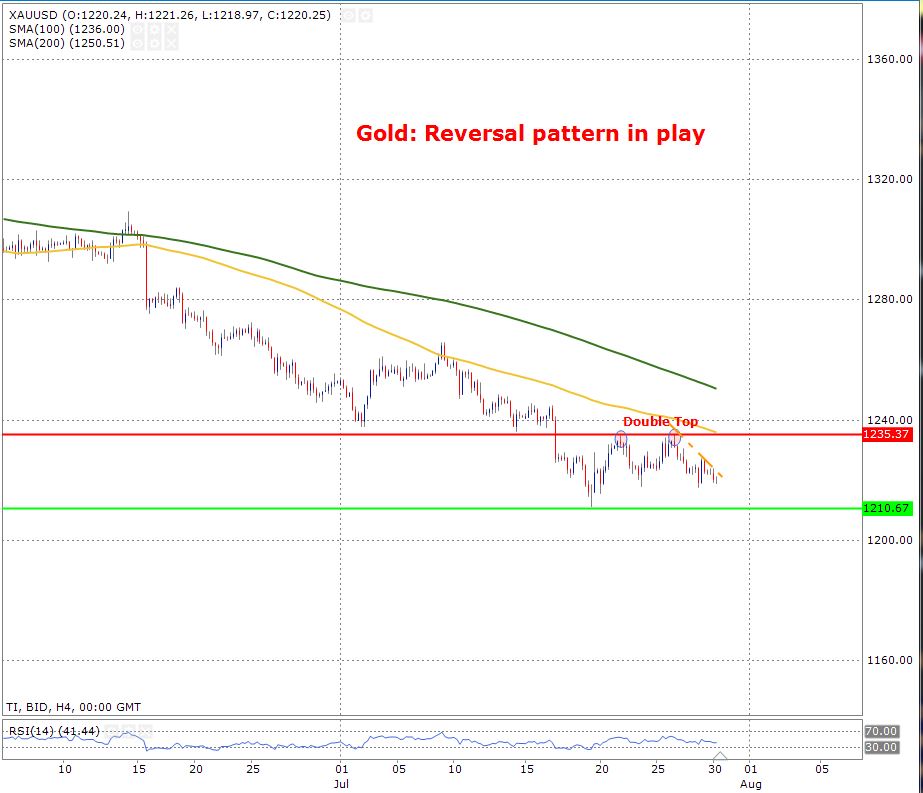
In terms of technical analysis, we have formed the double top which is a reversal pattern. The price would have to face the challenges of 100 and 200-day moving average. It is trading below these averages which gives us a clear sign of a downward trend on a four-time frame.
The first bullish sign would emerge if the price breaks the downward trend line. The support is at 1210 and break of this would open the door towards the next resistance level of $1200
AUDUSD Outlook: Directionless Mode Ahead Of Key Events This Week
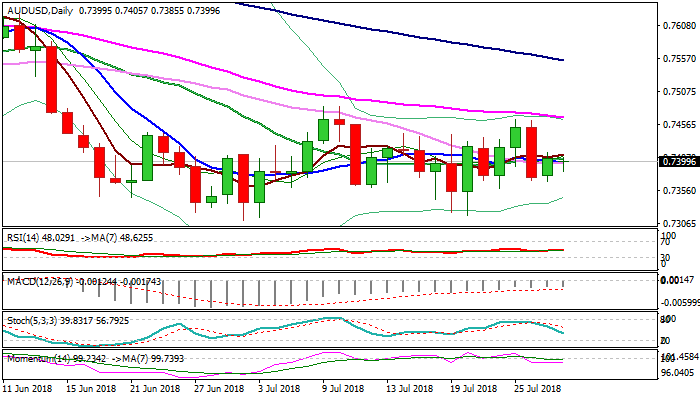
The Australian dollar holds in directionless mode on Monday, unable to extend Friday’s strong recovery rally, as daily techs remain negative and maintain bearish tone.
Overnight’s dip of equities dragged Aussie lower, but the downside looks for now protected.
Plenty of events this week are expected to generate fresh signals, with action starting on Tuesday with Australian housing data, followed by BoJ rate decision and FOMC, which ends its two-day meeting on Wednesday.
Initial pivotal supports lay at 0.7370 (last Thu/Fri lows), loss of which would open way towards key supports at 0.7317/10 (20/02 July lows).
Bullish scenario requires close above cracked cluster of daily MA’s (between 0.7396 and 0.7411) which would expose key barriers at 0.7465 (25/26 July highs, reinforced by falling 55SMA) and 0.7483/94 (09/10 July highs/daily cloud base).
Res: 0.7411, 0.7440, 0.7464, 0.7483
Sup: 0.7385, 0.7370, 0.7359, 0.7317
Markets Summer Lull Can Be Broken By Major Central Banks
The currencies of developed countries are moving within a narrow range at the beginning of the eventful week. The dollar index is around the mark of 94.50 and has been trading for two months in a range of slightly over 1% around this level. This quiet trading environment can be broken this week after the announcement of the decisions took by the Bank of Japan, the Fed, and the Bank of England, as well as the publication of the U.S. employment data.
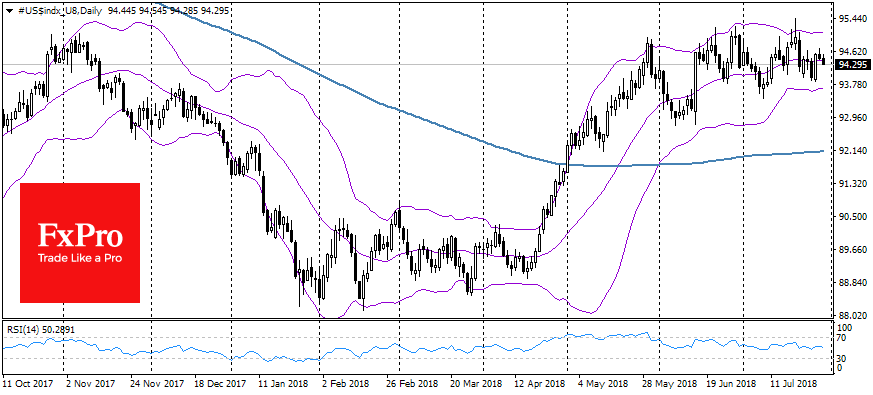
Developed markets currencies are experiencing a period of low volatility after the dollar growth period from the end of April to the end of May. The closest market focus is how the Bank of Japan adjusts its policy. More hawkish tone can push down the Asian markets at a time when they are vulnerable amid the fears of trade wars.
With the meetings of the largest central banks and important statistics, the week is able to open a period of increased volatility after a long period of summer lull. Earlier, the Fed’s head made it clear that the U.S. central bank is set to tighten its policy. Market participants will closely monitor if the Fed is set to raise its rates in September, while remaining committed to the 4th increase in 2018.
The Fed’s hawkish rhetoric can increase the difference in the dynamics of developing countries’ currencies. Unlike the major world currencies, in the EM there has been a noticeable differentiation in recent weeks.
The Russian rubble enjoys the continuation of the high oil prices period. The
Mexican peso adds after the elections last month and on the expectations of the profitable negotiations on NAFTA.
At the same time, the Chinese yuan has been falling for the recent two months at its highest rate in many years on easing the PBC policy and on fears about the consequences of trade wars with the United States. The Turkish lira declined to all-time lows due to the threat of the U.S. sanctions and after the Turkish CB had kept the rates against a widely expected increase last week, which was perceived as a loss of independence of the local regulator. The Argentine peso is also under attack, despite the assistance from the IMF to the country. The Indian rupee is close to the historical minimum to the dollar, in spite of the strong growth of the economy.
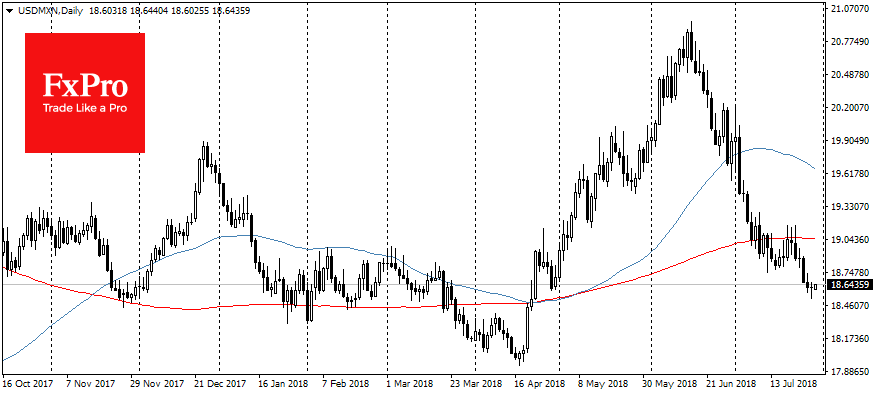
The dividing line for the currencies of developing countries became the balance-of-payments factor. Turkey, India, and Argentina have a significant deficit and are dependent on the inflows of capital from outside. China formally has surplus, however, the economy of the country’s regions depends on outward investment, requiring favourable investor relations. 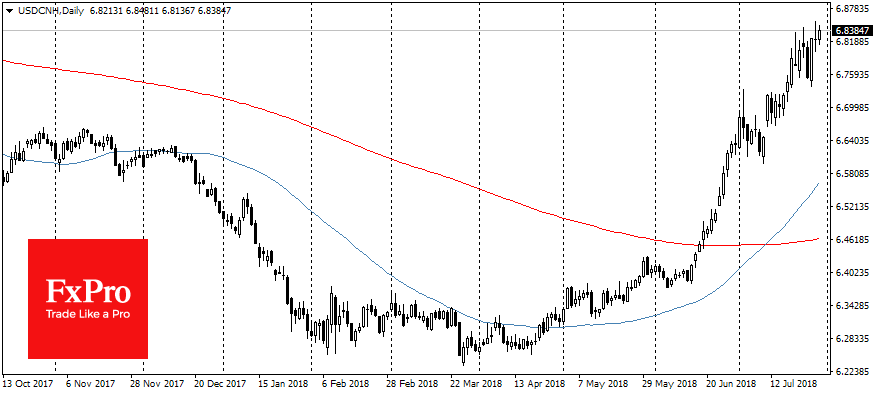
The Analytical Overview Of The Main Currency Pairs
The EUR/USD currency pair
Technical indicators of the currency pair:
Prev Open: 1.16417
Open: 1.16570
% chg. over the last day: +0.13
Day's range: 1.16444 – 1.16727
52 wk range: 1.0571 – 1.2557
On Friday, there was a variety of trends on the EUR/USD currency pair. A report on the US GDP was published, according to which the indicator grew to 4.1% in the second quarter, as experts expected. At the moment, the technical pattern is ambiguous: quotes are in a sideways trend. The key support and resistance levels are 1.16450 and 1.16750, respectively. We recommend opening positions from these marks.
The news feed on 2018.07.30:
German consumer price index at 15:00 (GMT+3:00);
Pending home sales index in the US at 17:00 (GMT+3:00).
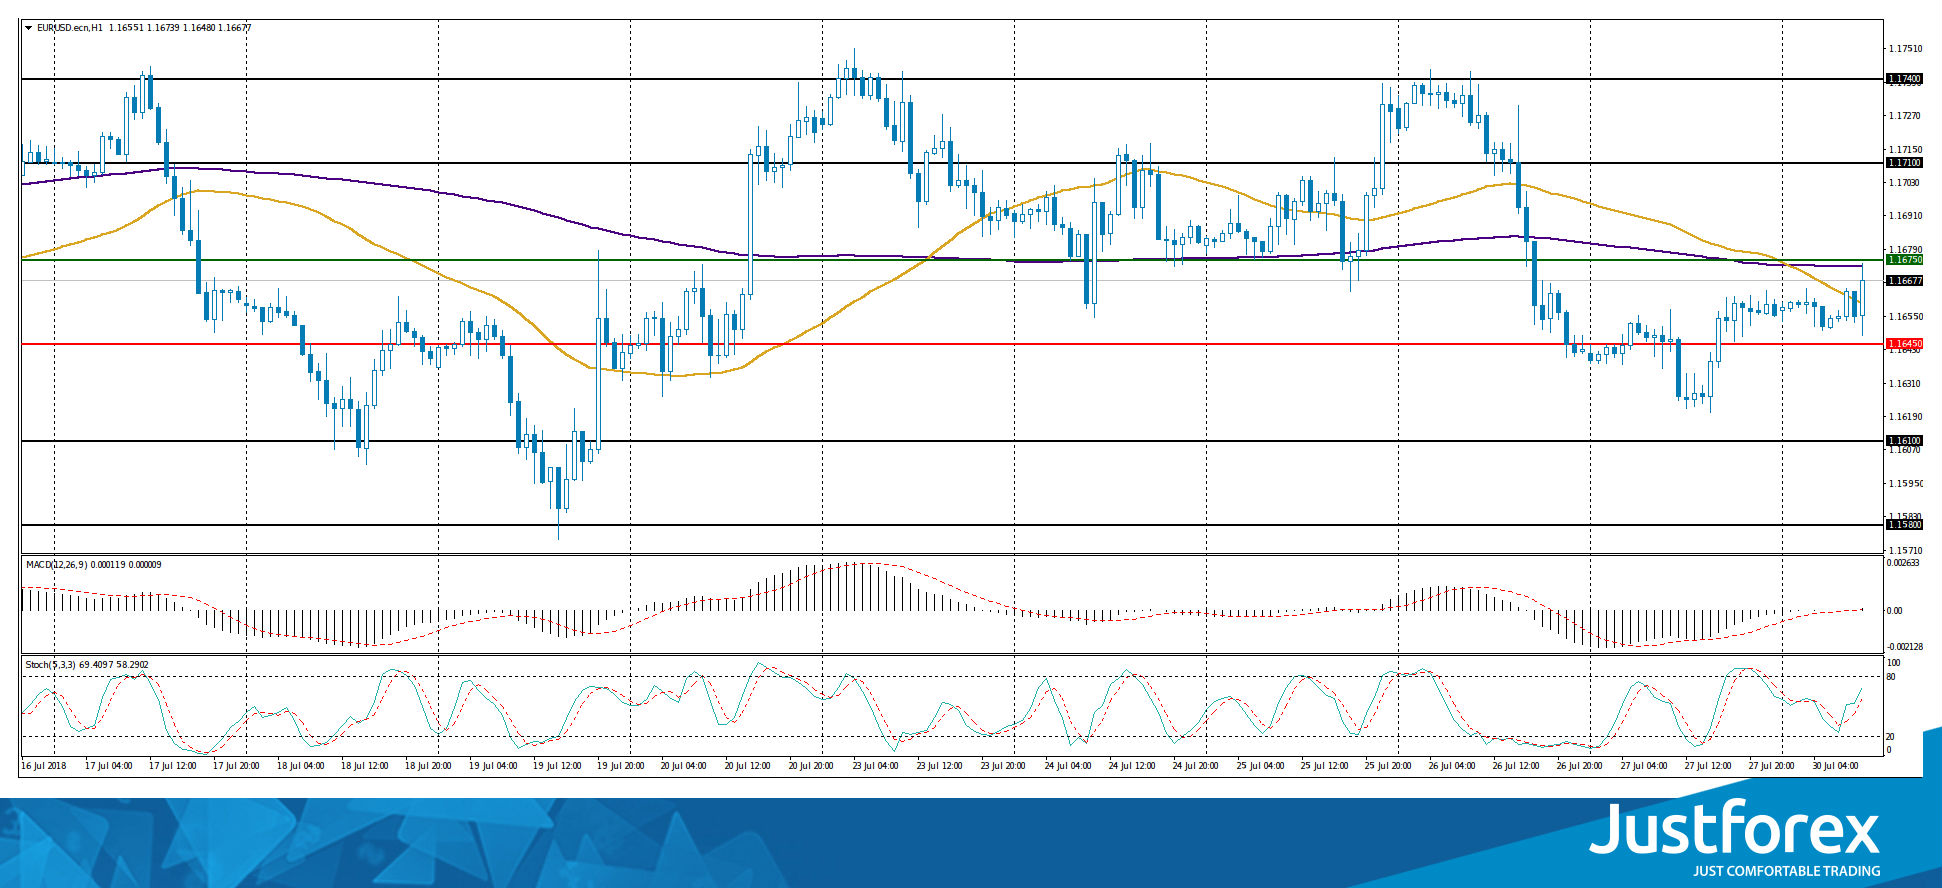
Indicators do not send accurate signals: 50 MA crossed 200 MA.
The MACD histogram is near the 0 mark. There are no accurate signals.
Stochastic Oscillator is in the neutral zone, the %K line is above the %D line, which signals to buy EUR/USD.
Trading recommendations
Support levels: 1.16450, 1.16100, 1.15800
Resistance levels: 1.16750, 1.17100, 1.17400
If the price fixes below 1.16450, we recommend considering sales of EUR/USD. The movement is tending to 1.16100-1.15800.
Alternative option. If the price fixes above the resistance level of 1.16750, the EUR/USD quotes are expected to rise. The movement is tending to 1.17100-1.17400.
The GBP/USD currency pair
Technical indicators of the currency pair:
Prev Open: 1.31075
Open: 1.31090
% chg. over the last day: +0.05
Day's range: 1.30927 – 1.31196
52 wk range: 1.2361 – 1.4345
The technical pattern on the GBP/USD currency pair is ambiguous. Quotes are moving in flat. Investors expect additional drivers. At the moment, the local support and resistance levels are still 1.31000 and 1.31400, respectively. The positions should be opened from these marks.
Today, the publication of important news from the UK is not expected.
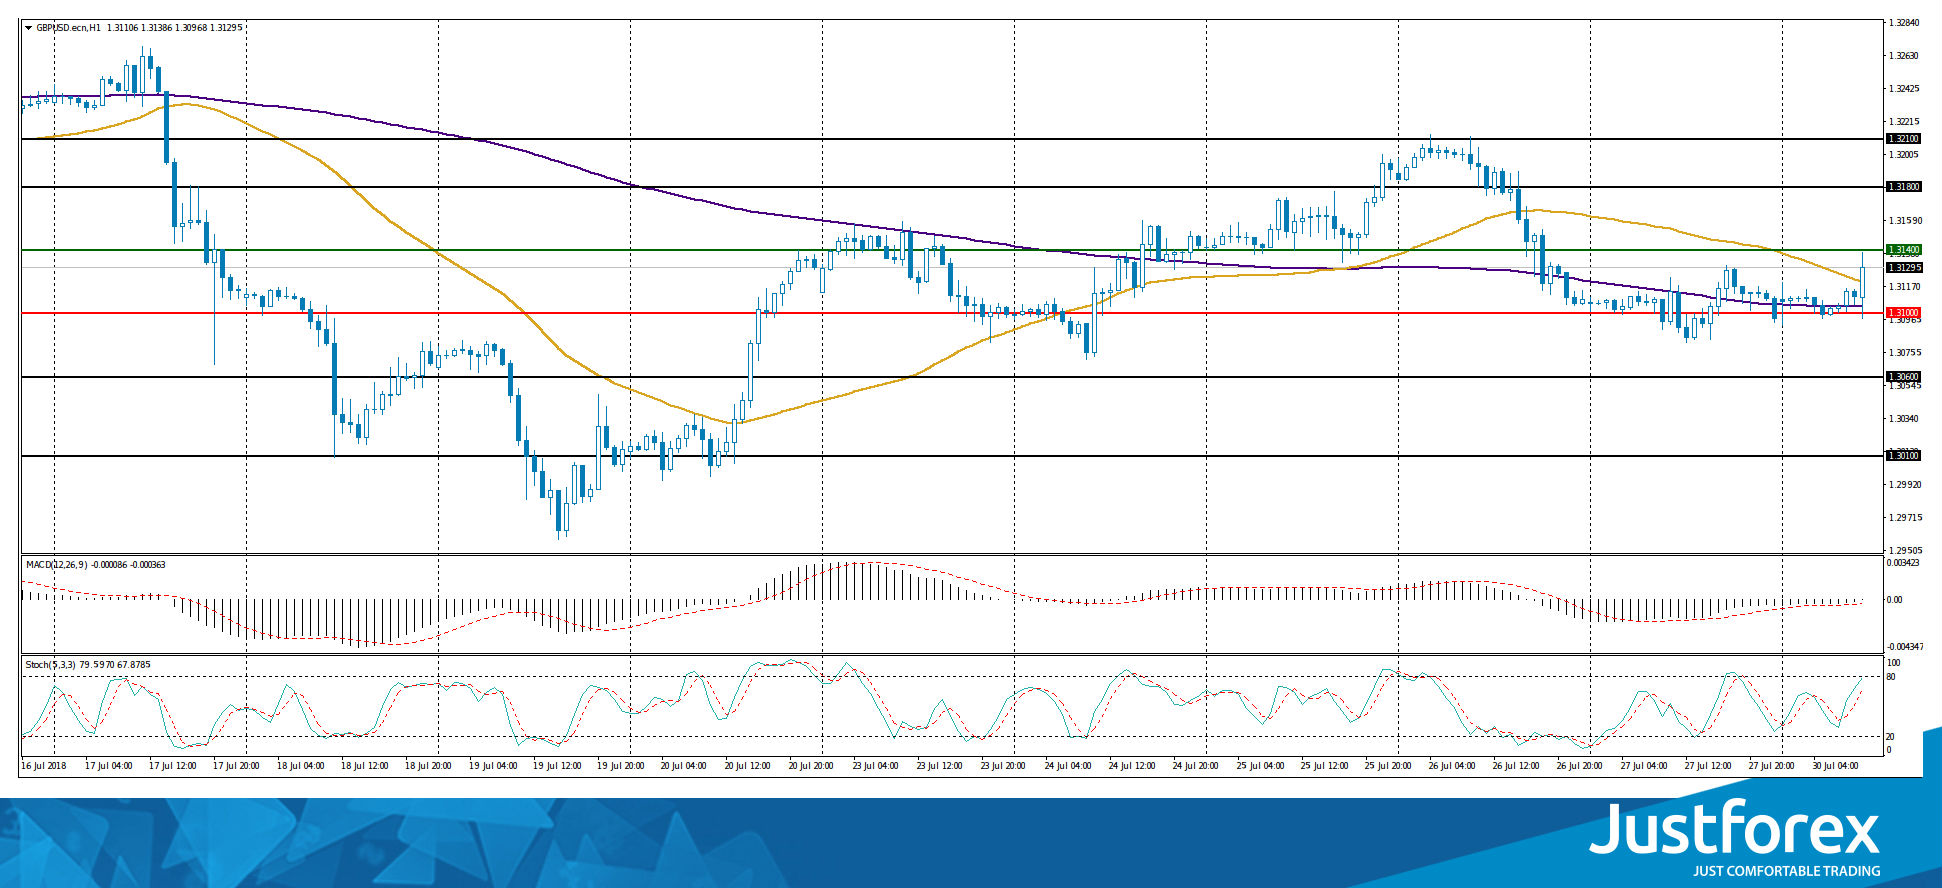
The price has fixed above 50 MA and 200 MA, which indicates the power of buyers.
The MACD histogram is near the 0 mark.
Stochastic Oscillator is located near the overbought zone, the %K line is above the %D line, which gives a signal to buy GBP/USD.
Trading recommendations
Support levels: 1.31000, 1.30600, 1.30100
Resistance levels: 1.31400, 1.31800, 1.32100
If the price fixes above 1.31400, we recommend considering purchases of GBP/USD. The movement is tending to 1.31800-1.32100.
Alternative option. If the price fixes below the round level of 1.31000, the GBP/USD currency pair is expected to decline. The movement is tending to 1.30600-1.30300.
The USD/CAD currency pair
Technical indicators of the currency pair:
Prev Open: 1.30708
Open: 1.30515
% chg. over the last day: -0.16
Day's range: 1.30505 – 1.30601
52 wk range: 1.2059 – 1.3795
The USD/CAD currency pair is in a sideways trend. Investors expect additional drivers. The key support and resistance levels are 1.30500 and 1.30800, respectively. The positions should be opened from these marks. We recommend paying attention to the dynamics of oil quotes.
The news feed on the economy of Canada is calm.
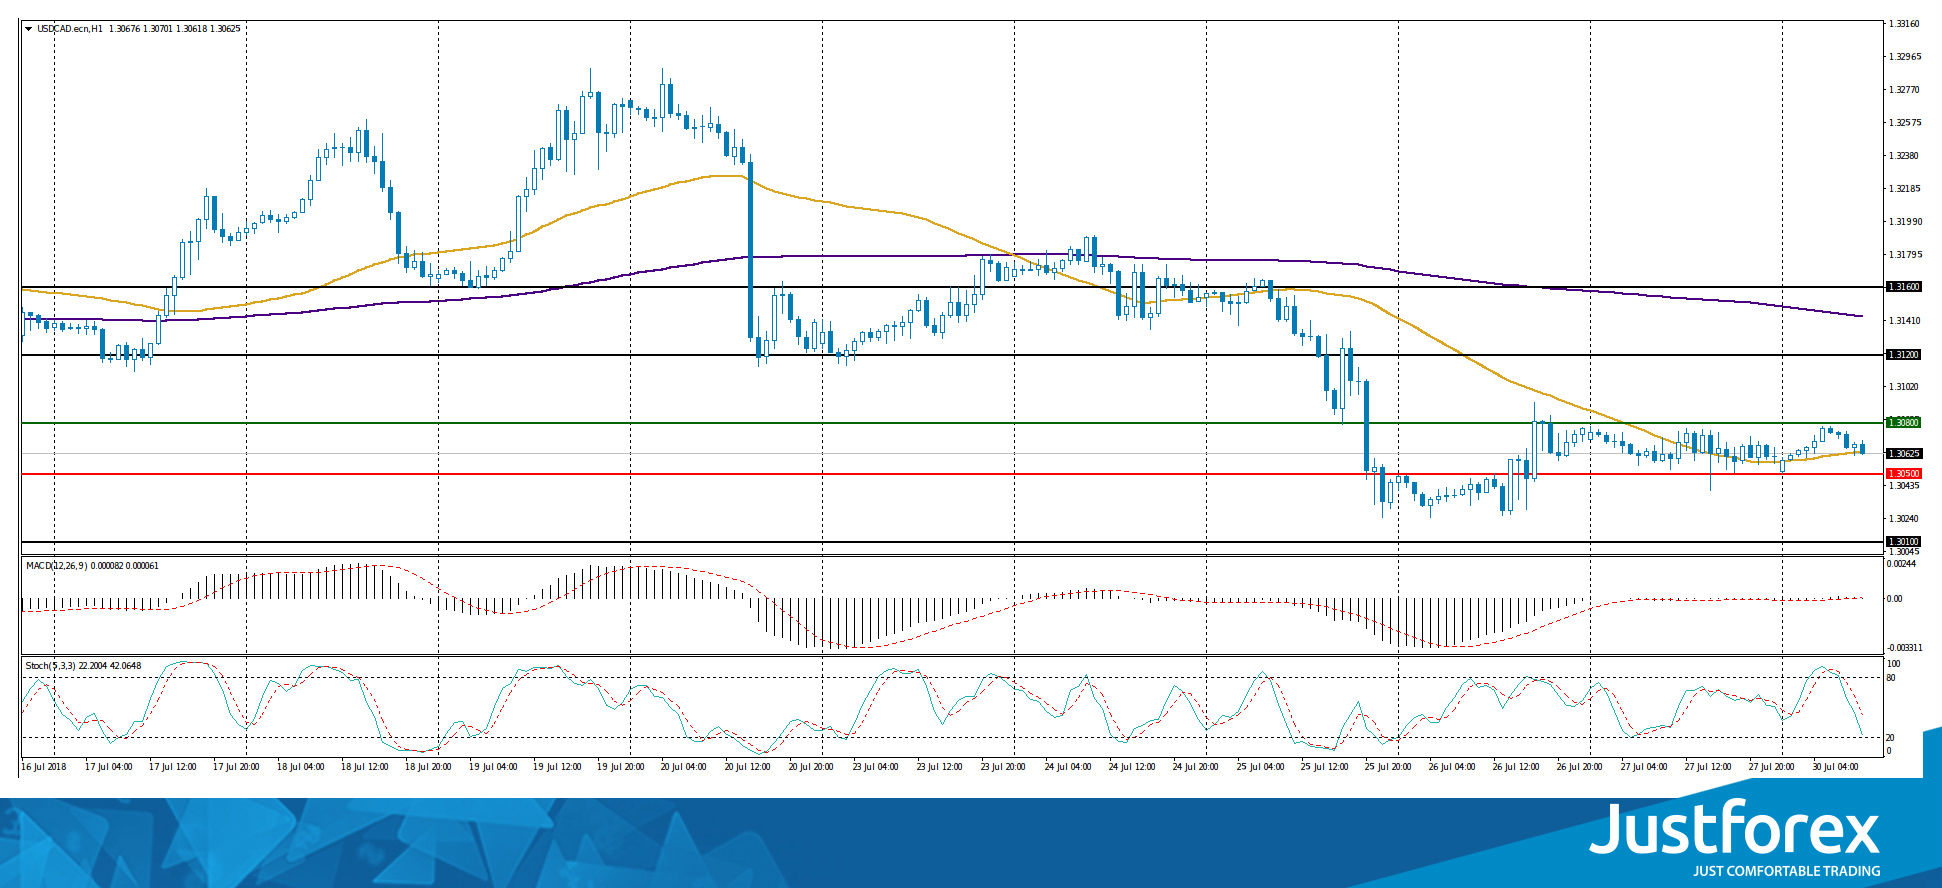
Indicators do not send accurate signals: the price is testing 50 MA.
The MACD histogram is near the 0 mark. There are no signals.
Stochastic Oscillator is in the neutral zone, the %K line is below the %D line, which gives a signal to sell USD/CAD.
Trading recommendations
Support levels: 1.30500, 1.30100
Resistance levels: 1.30800, 1.31200, 1.31600
If the price fixes below the support level of 1.30500, we recommend considering sales of USD/CAD. The movement is tending to 1.30100-1.29800.
If the price fixes above 1.30800, it is necessary to look for entry points to the market to open long positions. The target movement level is 1.31200-1.31400.
The USD/JPY currency pair
Technical indicators of the currency pair:
Prev Open: 111.219
Open: 110.936
% chg. over the last day: -0.15
Day`s range: 110.919 – 110.994
52 wk range: 104.56 – 114.74
The technical pattern on the USD/JPY currency pair is ambiguous. Quotes are in a sideways trend. Investors expect additional drivers. The key support and resistance levels are 110.900 and 111.200, respectively. The positions should be opened from these marks. We recommend paying attention to the 10-year US government bonds yield.
The news feed on the economy of Japan is calm.
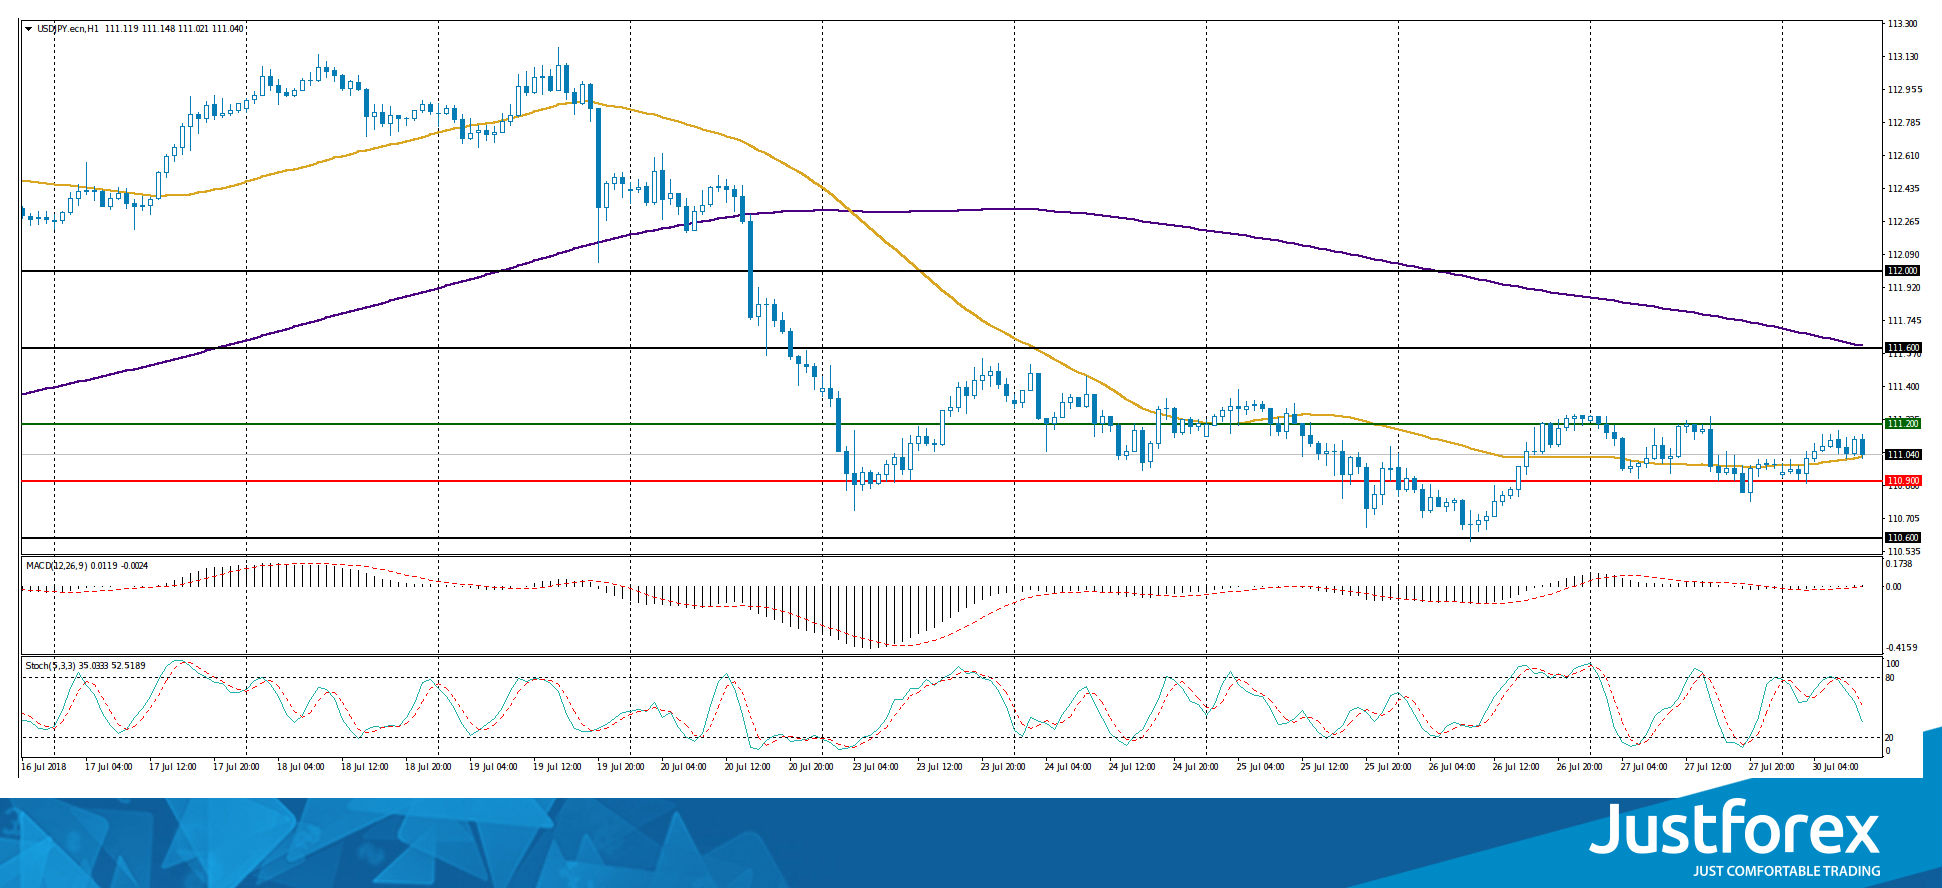
Indicators do not send accurate signals: the price is testing 50 MA.
The MACD histogram is near the 0 mark.
Stochastic Oscillator is located in the neutral zone, the %K line is below the %D line, which indicates a decrease in quotes.
Trading recommendations
Support levels: 110.900, 110.600
Resistance levels: 111.200, 111.600, 112.000
If the price fixes below the support of 110.900, the USD/JPY currency pair is expected to decline. The movement is tending to 110.600-110.300.
Alternative option. If the price fixes above the level of 111.200, it is necessary to consider purchases of USD/JPY. The movement is tending to 111.600-111.800.
Forex Technical Analysis: EUR/USD, USD/JPY, GBP/USD
EUR/USD
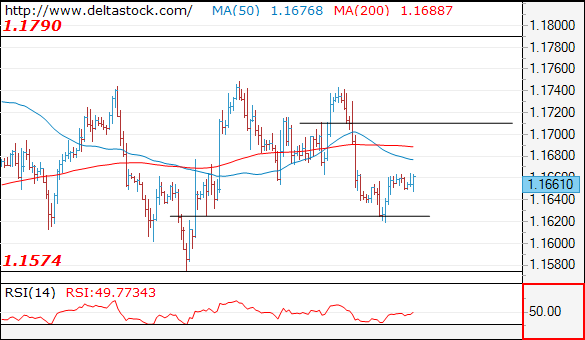
Current level - 1.1661
The recent dip to 1.1620 met a reliable support and my outlook is positive, for a rise towards 1.1710, en route to 1.1790.
| Resistance | Support | ||
| intraday | intraweek | intraday | intraweek |
| 1.1660 | 1.1750 | 1.1620 | 1.1510 |
| 1.1710 | 1.1830 | 1.1570 | 1.1300 |
USD/JPY
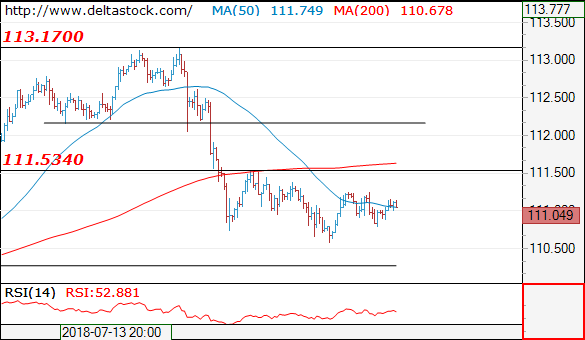
Current level - 111.04
There is still no trend dynamics here and the overall outlook is neutral.
| Resistance | Support | ||
| intraday | intraweek | intraday | intraweek |
| 111.50 | 114.50 | 110.25 | 110.25 |
| 112.10 | 114.50 | 109.30 | 109.30 |
GBP/USD
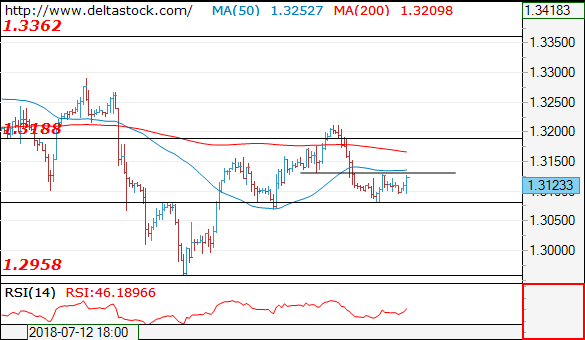
Current level - 1.3123
The bias is positive, for a break through 1.3130 hurdle, towards 1.3200, en route to 1.3300 zone. Initial support lies at 1.3080.
| Resistance | Support | ||
| intraday | intraweek | intraday | intraweek |
| 1.3130 | 1.3460 | 1.3080 | 1.2960 |
| 1.3300 | 1.3620 | 1.2960 | 1.2770 |
US And Asian Stocks Lower – EU To Follow
US and Asian stocks lower – EU to follow
US and Asian stocks market were in risk-off mode recently as central bank decisions are approaching and despite impressive growth numbers from the US economy. The dollar index is falling while US treasuries are declining following recent rise on Friday.
The US stock market closed lower on Friday due to a global sell-off in technology shares. The NASDAQ fell by -1.46%, S&P 500 closed at -0.66% while the Dow declined by -0.30%. The same is true for Asian stocks, as the Bank of Japan is holding its meeting tomorrow. The Nikkei 225 closed on Monday at -0.74% and the Hong Kong Hang Seng closed slightly lower at -0.25% whereas Korean Kospi closed flat (-0.06%).
European stocks are expected to trade along the same range, with confidence indicators expected to print downward while German July CPI figures to remain flat y/y and higher m/m (expected: 0.40% vs prior: 0.10%).
The EUR/USD is currently bouncing off from 1.1643 low (26/07/2018 low), trading above 16.70 and heading along 1.1680. The pair could be turning down at 1.1650 in late afternoon.
Colossal US Q2 GDP growth – is it sustainable ?
US second quarter GDP growth estimates at 4.10% (expected: 4.20%) annualized q/q from 2% previously, its fastest pace in four years. The strong US growth numbers in Q2 are mainly explained by Trump’s USD 1.5 trillion tax cut, including lower tax rates for corporations of 21% (down from 35%) and for American households (along with tax benefits). The legislation is expected to expire by the end of 2025. Accordingly, the measure strongly boosted private consumption and investment across the country due to higher spending. Another significant factor is the impact of Chinese imports from the US in agricultural and meet products.
However, contrarily to Trump’s view, a sustained GDP growth of 4% by the end of the year appears improbable. Production capacity is above long-term average, labor market is tight and interest rate hikes are approaching, without talking about dragging uncertainties around trade war. We would rather support Fed’s expectations of Q4 GDP y/y growth at 2.80 and inflation (ex. Energy and Food) along 2%.
In addition to less than a year old fiscal stimulus policy, the Trump administration is already discussing a new tax plan for October 2018, which would reduce corporate tax by 20% while the rest of the policy would focus on the middle class.
Today we have June Home Sales and July Dallas Fed Manufacturing Business Activity Index.
EUR/USD Calm Near Strong Resistance
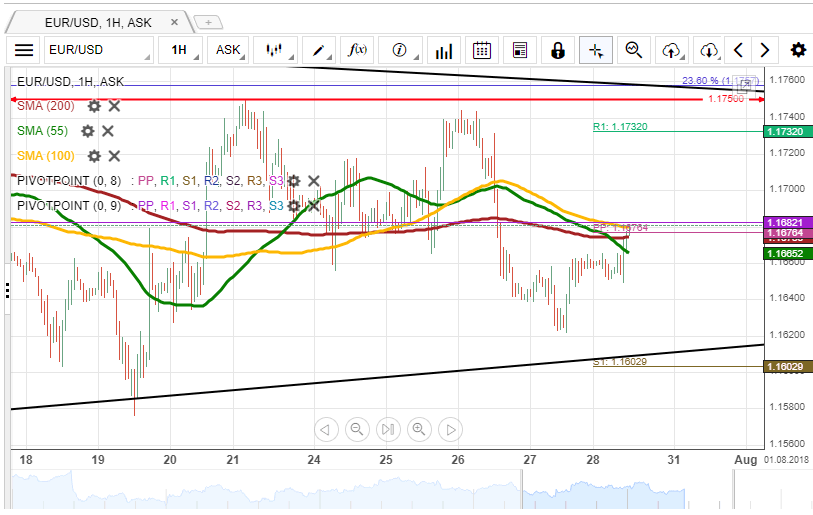
The common European currency remained stable against the Greenback on Friday. Even though technical indicators showed signs of recovery and were actually edging higher during the day, the pair failed to gather the necessary bullish momentum to dash through 1.1680. This significant resistance cluster is formed by the 55-, 100– and 200-period SMAs both on the 1H and 4H time-frames.
This session lacks important fundamental releases, so it is likely that the given level remains intact today, as well. Given all this into account, it is expected that the Euro weakens and tries to approach the bottom boundary of a two-month symmetrical triangle and the weekly S1 at 1.16.
By and large, the Euro should hinder near the 1.1680 for a few sessions prior to breaching this mark and surging towards 1.1750.
GBP/USD Breaches Resistance
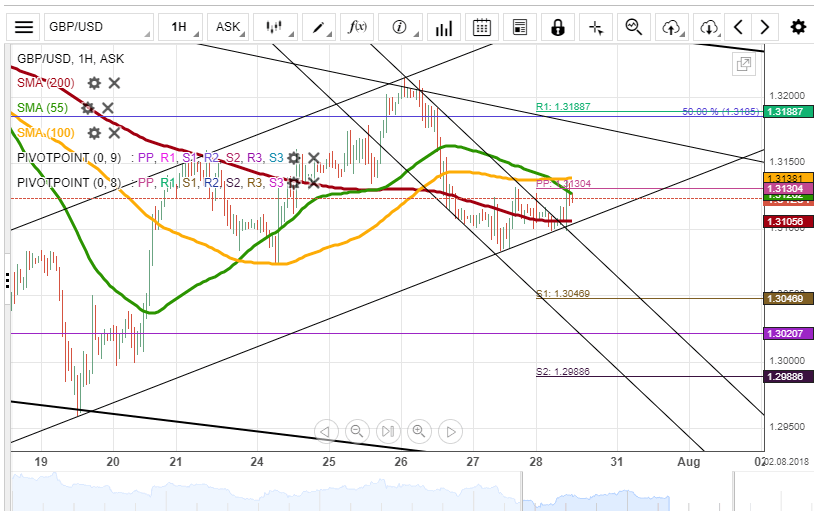
GBP/USD was trading sideways on Friday, as any fall or advance was restricted by several support/resistance levels. As a result, the Pound remained fluctuating around the 200-hour SMA for the second consecutive session.
Even though technical indicators flash mixed signals, it seems that the Pound is ready to leave this ranging motion and appreciate in this session, especially after surpassing the 200-hour and 55-period (4H) SMAs early today.
This is likely to add some bullish pressure and allow the pair to edge towards the 100– and 200-period ones, the 50.00% Fibo retracement and the weekly R1 at 1.3190. However, it still has to breach the weekly PP and the 55– and 100-hour SMAs near 1.3130 to fulfil this scenario.
In case bears take over, the nearest support is the weekly S1 at 1.3040.
USD/JPY: Recovery Expected
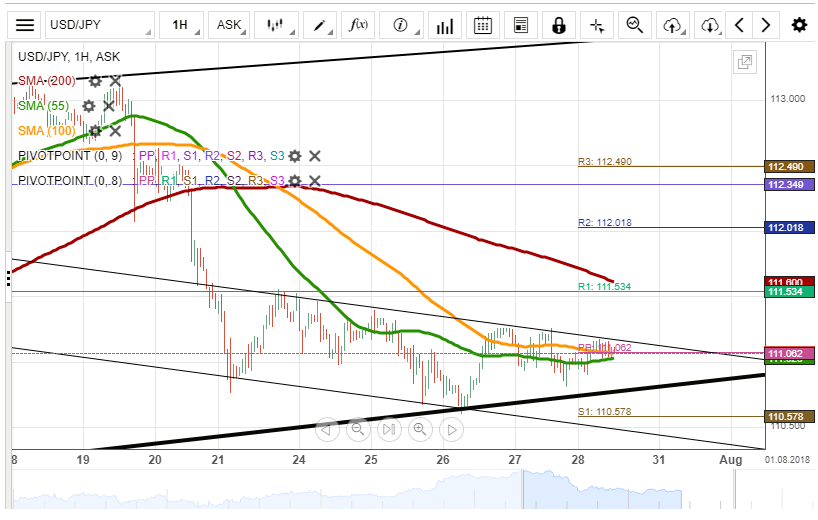
The USD/JPY currency pair is fluctuating in between the 55– and 100-hour SMAs for the third consecutive session. These moving averages pushed the rate slightly lower, but the pair has nevertheless remained in the 110.80/111.20 range.
It is apparent on the chart that the US Dollar is approaching the senior channel near 110.70. This support should not be breached in this session, thus giving more weight to the bullish scenario. The Greenback could be guided by the 200-period (4H) and 100-hour SMAs located at 111.00 on Monday. Upside target today is the weekly R1, the 200-hour SMA and the monthly R1 at 111.50.
In case this acceleration does not occur, traders should wait for a soon breakout from the senior channel and the 55-day SMA and a subsequent fall down to 110.00.
XAU/USD Breaches Short-Term Pattern
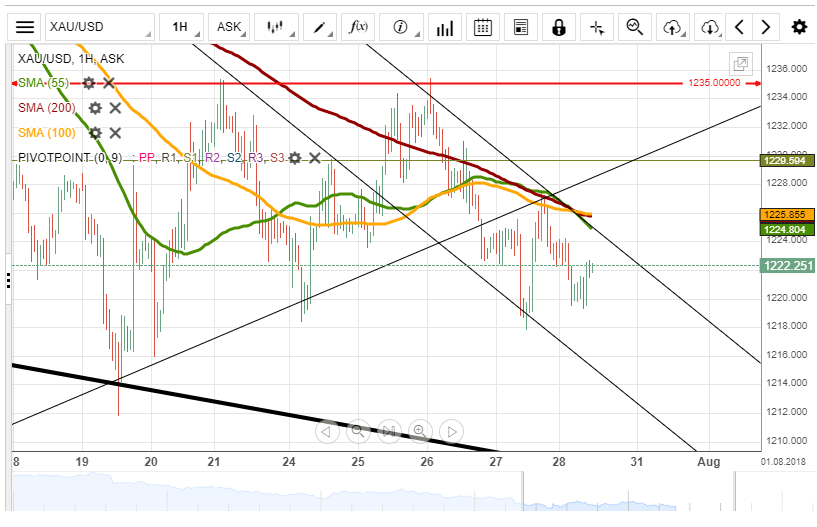
Bears continue to dominate XAU/USD in the short term. It fell below the 55-, 100– and 200-hour SMAs on Thursday and has since been trading below this cluster. The yellow metal tested this now-resistance at 1,228.00 mid-Friday, but failed to gather the necessary bullish momentum to actually break through.
Meanwhile, the rate breached the prevailing short-term ascending triangle two sessions ago and already managed to retrace from its bottom boundary. From theoretical point of view, this should be followed by further decline, setting the senior channel at 1.210.00—a one-year low—as a possible downside target.
This fall, however, should be limited today, as Gold is likely to re-test the 1,228.00 level once more. Another resistance is a two-week high at 1,235.00.