Sample Category Title
Japanese Yen Recovers Some Losses as Investors Seek Safe-Haven Assets
The USD/JPY pair has stabilised around 147.60 following two consecutive days of gains, with the yen now attempting to recoup some of its recent losses.
Key factors influencing USD/JPY movements
Uncertainty in global trade relations remains a key focus for currency markets, heightening demand for safe-haven assets. Recent reports indicate that US President Donald Trump has agreed to meet Japanese officials to initiate trade discussions following a phone call with Prime Minister Shigeru Ishiba.
US Treasury Secretary Scott Bessent will lead the negotiations, underscoring the strength of the US-Japan alliance. Key topics will include tariffs, non-tariff barriers, foreign exchange policies, and government subsidies.
Despite Trump’s openness to dialogue, he has dismissed the possibility of delaying new reciprocal tariffs and warned that these measures could remain in place indefinitely. Domestically, Japan’s current account surplus for February reached a record high, buoyed by rising exports and declining imports, which has provided firm support for the yen.
Technical outlook: USD/JPY
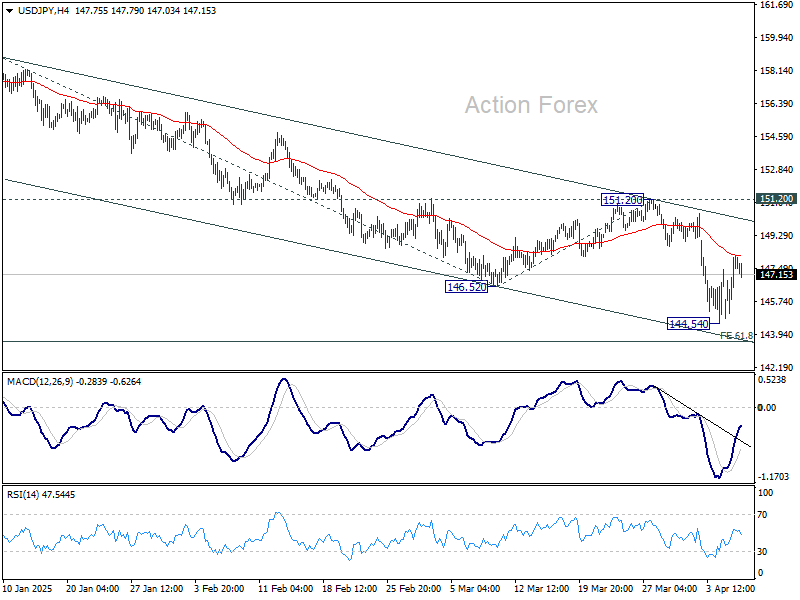
H4 Chart: The pair achieved its local downside target at 144.50 before correcting to 148.12. Following this correction, we anticipate another potential decline towards 143.83. This scenario is supported by the MACD indicator, where the signal line remains below zero and points sharply downward.

H1 Chart: The pair completed an upward structure, reaching 148.12, and is now consolidating below this level. We expect a new downward wave towards 146.27, with further downside potential to 143.83. The Stochastic oscillator confirms this outlook, with its signal line below 50 and trending firmly downward towards 20.

Conclusion
The yen’s recovery reflects ongoing market caution, with technical indicators suggesting further downside for USD/JPY. Investors will closely monitor trade developments and macroeconomic data for directional cues.
RBNZ set to cut again, bearish momentum resumes in NZD/JPY
RBNZ is widely expected to deliver another 25bps cut tomorrow, bringing the Official Cash Rate down to 3.50%. With the move largely priced in, traders will be focused on how the central bank interprets the rapidly evolving global environment.
As the first major central bank to meet since the US launched the sweeping reciprocal tariffs, RBNZ’s tone and guidance will not only be key for New Zealand, but will also offer insights for the broader Asia-Pacific region.
While there are speculative whispers about the possibility of a larger-than-expected rate cut to cushion the economy against the external shock, RBNZ will likely refrain from doing so just yet. The current level of uncertainty, both in terms of policy responses and economic impact, should see the central bank remain cautious, maintaining its easing bias without overcommitting.
With another cut already projected in May, RBNZ is expected to stay on its path of gradual policy accommodation while waiting for more concrete data on trade disruption effects. The question of whether the RBNZ will eventually push OCR below 3.00% remains open. Much will depend on how the trade war unfolds, how consumer and business sentiment hold up, and the extent of the ripple effects across Asia’s open economies.
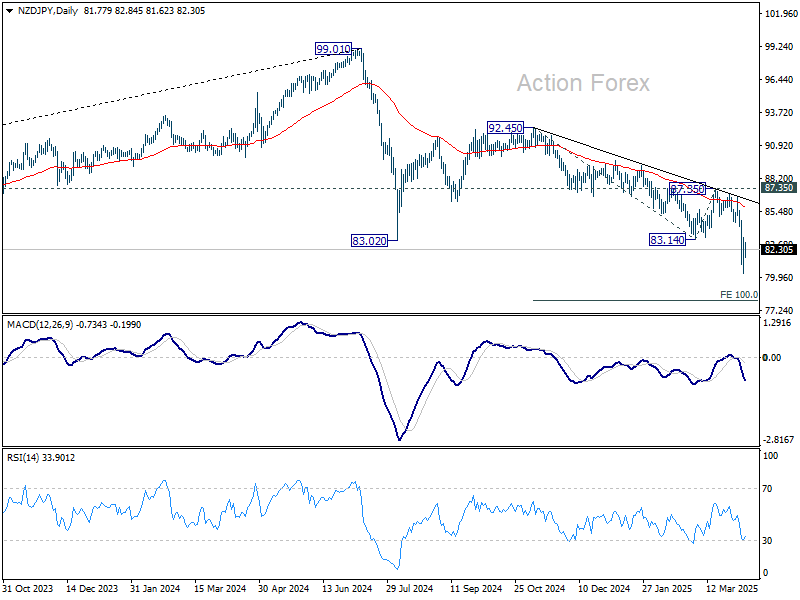
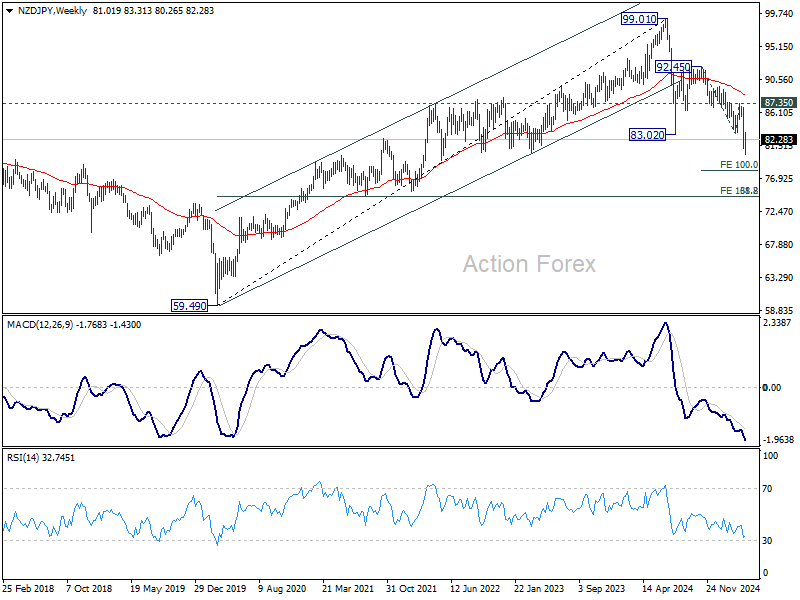
Technically, NZD/JPY's down trend from 99.01 (2024 high) resumed by breaking through 83.02 low last week. Whether this is a correction of the multi-year uptrend from the 2020 low of 59.49, or a full reversal, is yet to be determined.
In either case, near term outlook will remain bearish as long as 87.35 resistance holds, in case of recovery. Next target is 100% projection of 92.45 to 83.14 from 87.35 at 78.04. Firm break there will target 138.2% projection at 74.48. This coincides with 61.8% retracement of 59.49 to 99.01 at 74.58.
NZD/USD Rebounds: A Dead Cat Bounce?
- NZD/USD rebounds near 2022 and pandemic lows.
- Short-term trend remains bearish; bulls need a break above 0.5870.
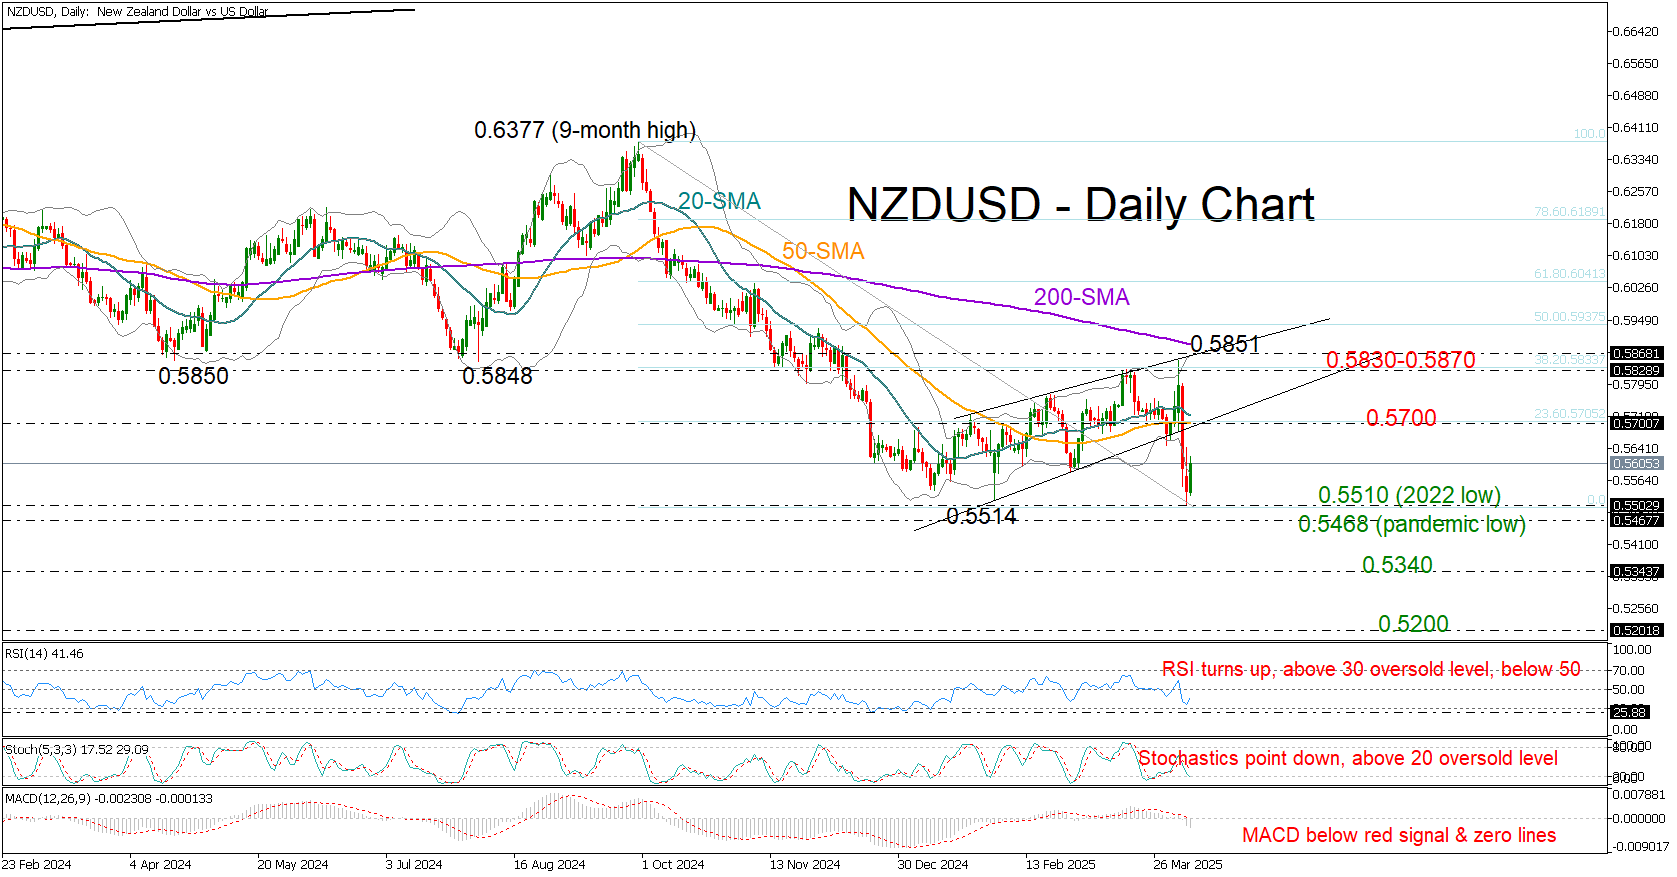
NZDUSD switched to recovery mode on Tuesday after a bleak start to the week, which pushed the price slightly below the 2022 low of 0.5510 and closer to its pandemic trough of 0.5468, as investors continued to digest tariff-led growth risks.
The RBNZ’s policy decision on Wednesday (03:00 GMT) is the next highlight on the calendar. While a 25bps rate cut to 3.5% is expected, a larger 50bps move might be on the cards as well. However, with the global trade war having just escalated between the US and China, and other economies preparing their countermeasures against the White House, policymakers may hold off on aggressive actions.
Technically, the short-term outlook remains bearish. Momentum indicators like RSI and MACD suggest limited upside, with no clear signs of oversold conditions or reversal.
Still, with the price hovering near a long-term pivot area, some stability could emerge. The main target could be the 0.5700 round figure, where the 50-day simple moving average (SMA) intersects with the short-term support trendline from February. A decisive break above this level could lead to a retest of the key 0.5830–0.5870 zone and the 200-day SMA. A move above that range would upgrade the short-term outlook.
In the bearish scenario, if the downtrend extends below the pandemic low of 0.5468, support may emerge near the 0.5345 level and then around 0.5200. Then, the 2009 bottom at 0.4890 might come into play.
All in all, NZDUSD continues to exhibit weakness despite today’s bounce. For the risk bias to turn positive, the bulls must stage a sustainable rally above the 200-day SMA and the 0.5870 region.
NASDAQ ( NQ_F) Elliott Wave: Incomplete Sequences Calling the Decline
Hello fellow traders. In this technical article we’re going to look at the Elliott Wave charts of NASDAQ ( NQ_F ) published in members area of the website. As our members know, NQ_F has shown incomplete bearish sequences in the cycle from the 22410.9 peak (December 2024 ). The price structure indicated further weakness. In the following text, we will provide a more detailed explanation of the Elliott Wave forecast.
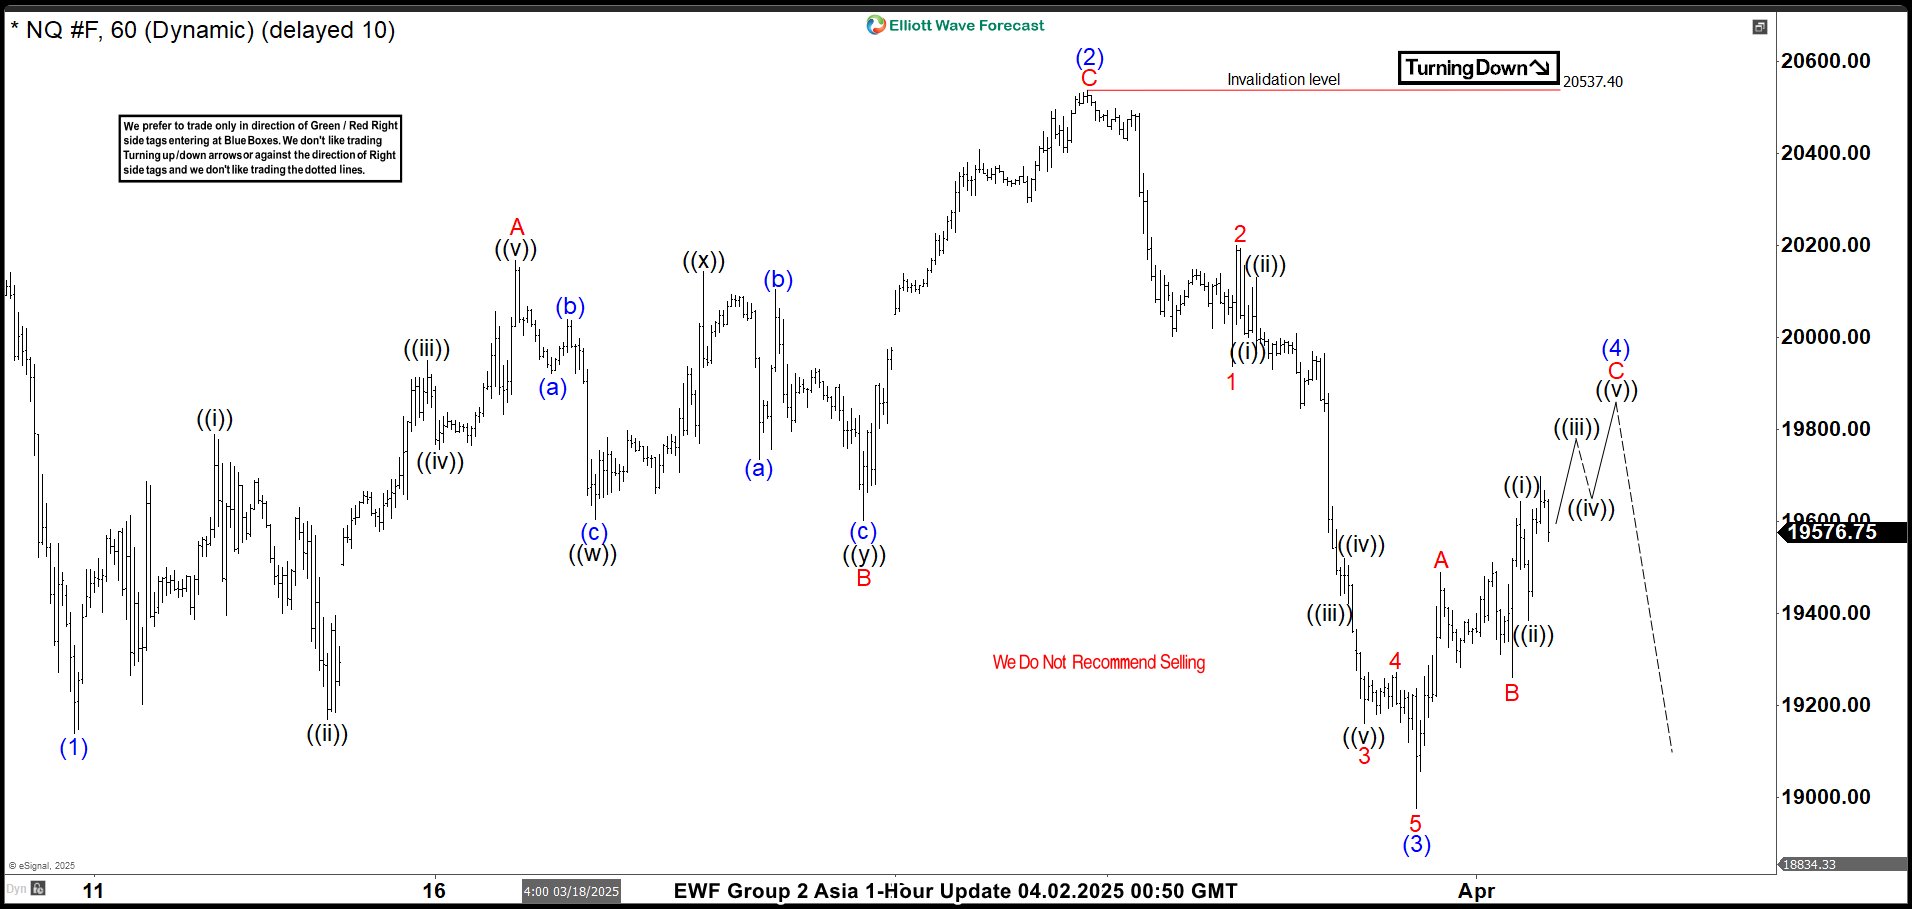
NQ_F Elliott Wave 1 Hour Asia Chart 04.02.2025
The break of the March 10th low, marked on the chart as (1) in blue, created incomplete bearish sequences in NQ_F. We anticipated a further drop as long as the pivot at the 20,537.4 peak holds. Currently, NASDAQ is undergoing a 3-wave recovery in (4) blue, which is expected to complete around the 19,761–20,215 area. We do not recommend forcing trades at this stage and expect NQ_F to continue dropping towards new lows.
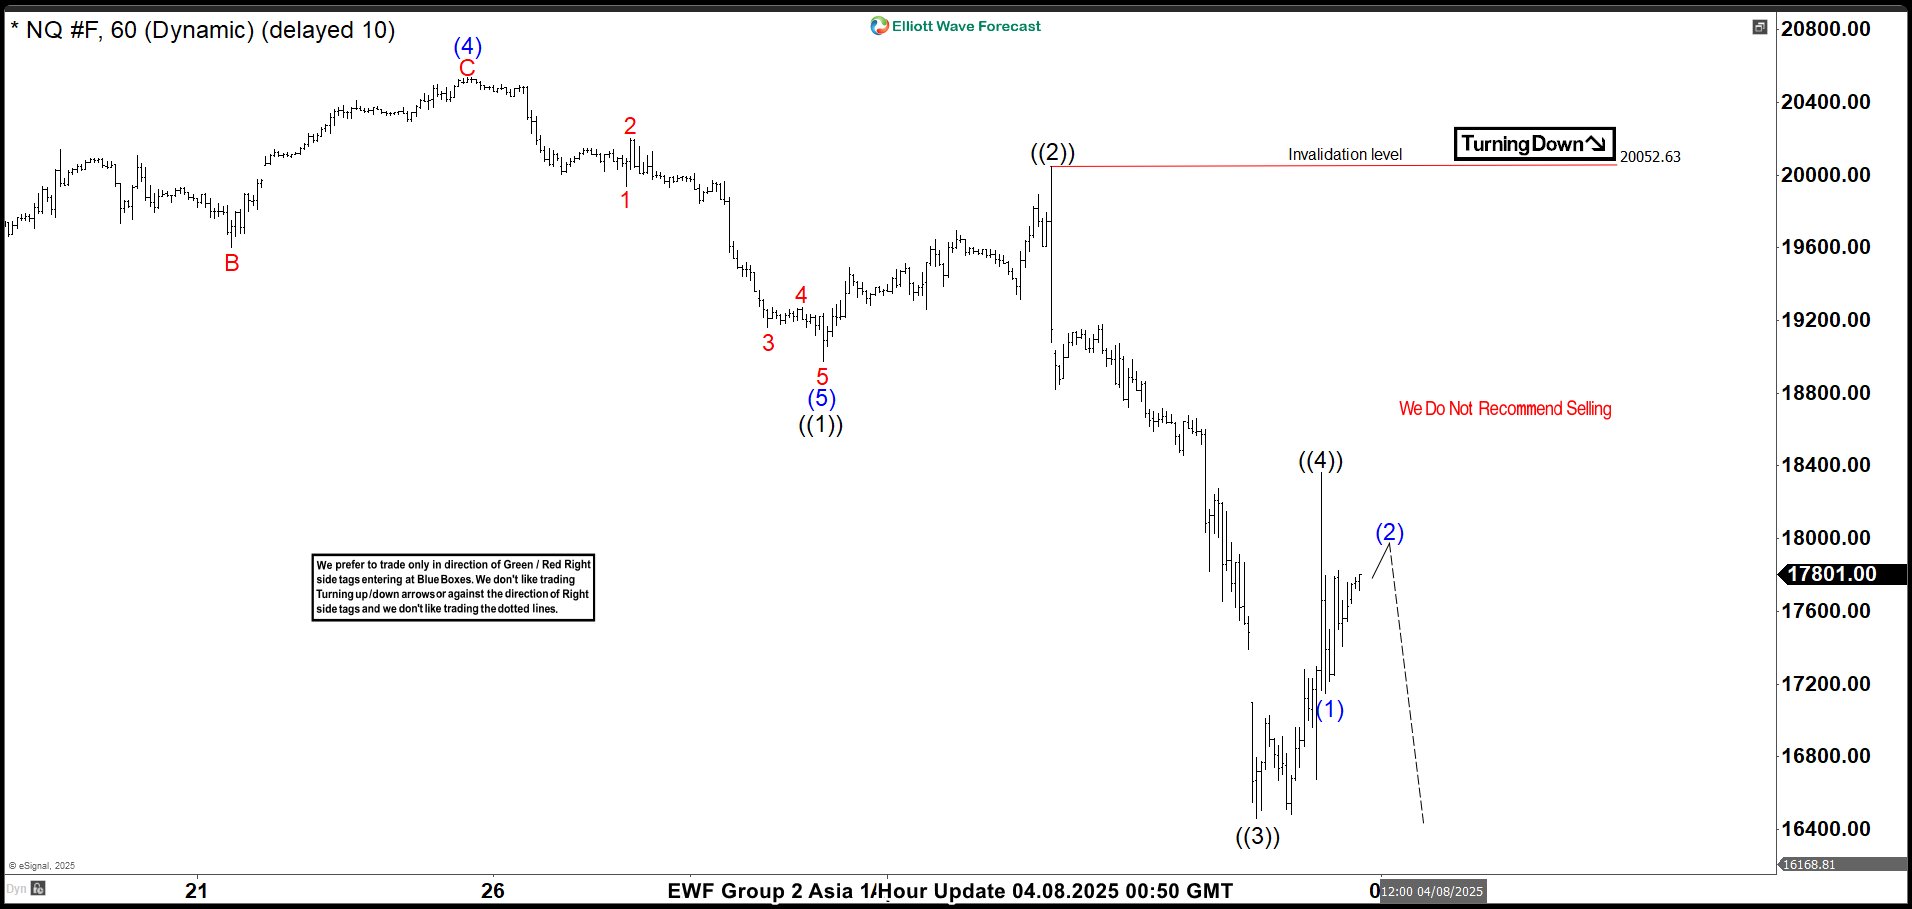
NQ_F Elliott Wave 1 Hour Asia Chart 04.08.2025
NASDAQ completed its recovery at the 20,052.63 peak and then declined further toward new lows, as expected. The current view suggests that as long as the price stays below 18,358, another low could be seen. NQ_F may drop toward the 17,202–16,417 range to complete the proposed cycle from the December 2024 peak.
EUR/USD Daily Outlook
Daily Pivots: (S1) 1.0841; (P) 1.0945; (R1) 1.1011; More...
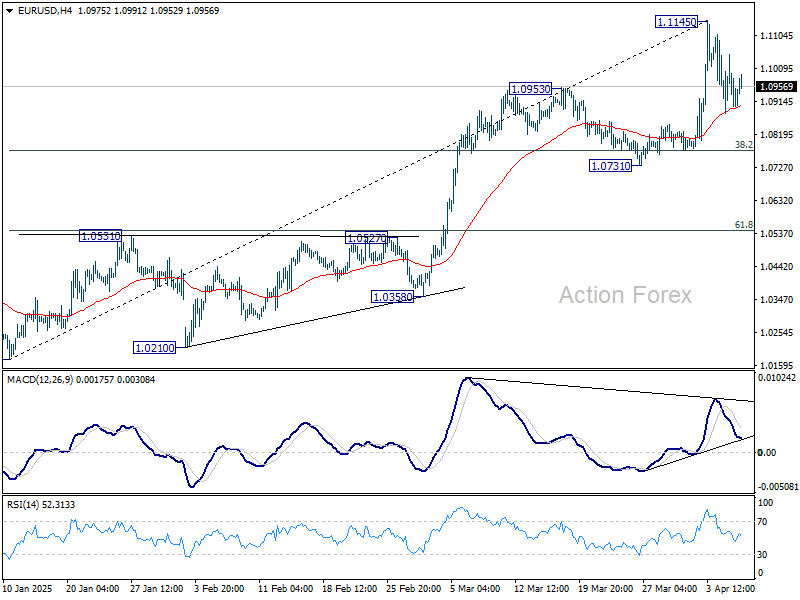
EUR/USD is still bounded in consolidations below 1.1145 and intraday bias remains neutral at this point. Downside of retreat should be contained by 38.2% retracement of 1.0176 to 1.1145 at 1.0775 to bring rebound. On the upside, above 1.1145 will resume the rally from 1.0176 to 1.1213/74 key resistance zone next.
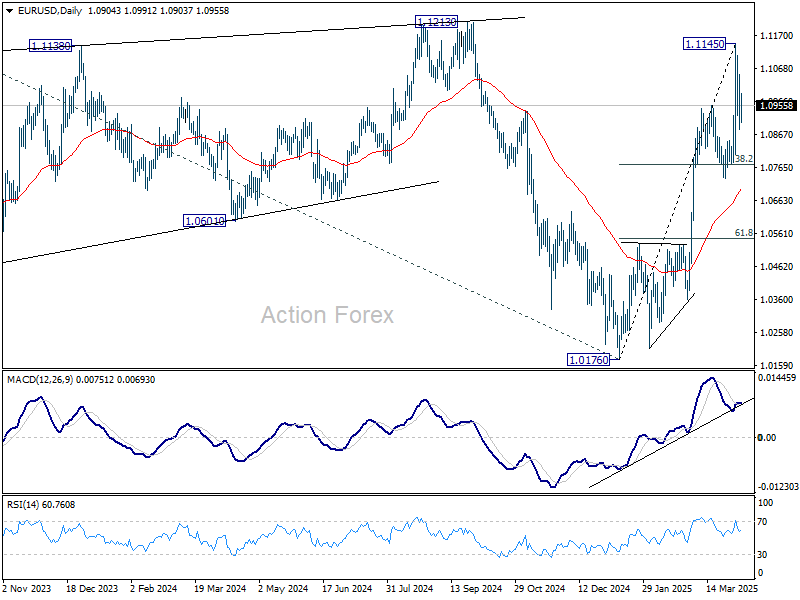
In the bigger picture, fall from 1.1274 (2024 high) has completed as a three wave correction to 1.0176. Rise from 0.9534 ready to resume. Decisive break of 1.1274 will target 100% projection of 0.9534 to 1.1274 from 1.0176 at 1.1916. Also, that will send EUR/USD through the multi-decade channel resistance will carries larger bullish implication. This will now be the favored case as long as 1.0731 support holds.
USD/JPY Daily Outlook
Daily Pivots: (S1) 145.78; (P) 146.96; (R1) 149.11; More...
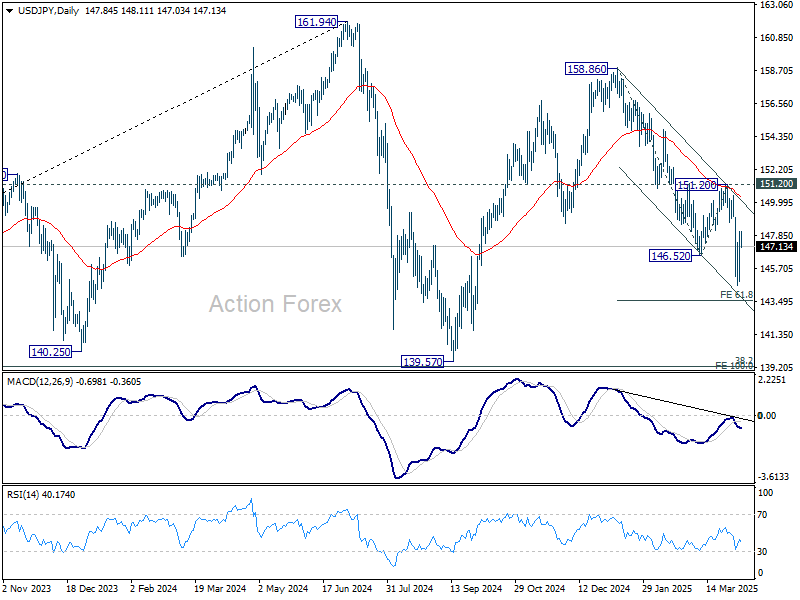
Intraday bias in USD/JPY remains neutral and more consolidations would be seen above 144.54. Upside of recovery should be limited below 151.28 resistance. On the downside, below 144.54 will resume the fall from 158.86 and target 61.8% projection of 158.86 to 146.52 from 151.20 at 143.57. Break there will target 139.57 low.
In the bigger picture, price actions from 161.94 are seen as a corrective pattern to rise from 102.58 (2021 low), with fall from 158.86 as the third leg. Strong support should be seen from 38.2% retracement of 102.58 to 161.94 at 139.26 to bring rebound. However, sustained break of 139.26 would open up deeper medium term decline to 61.8% retracement at 125.25.
GBP/USD Daily Outlook
Daily Pivots: (S1) 1.2645; (P) 1.2790; (R1) 1.2871; More...
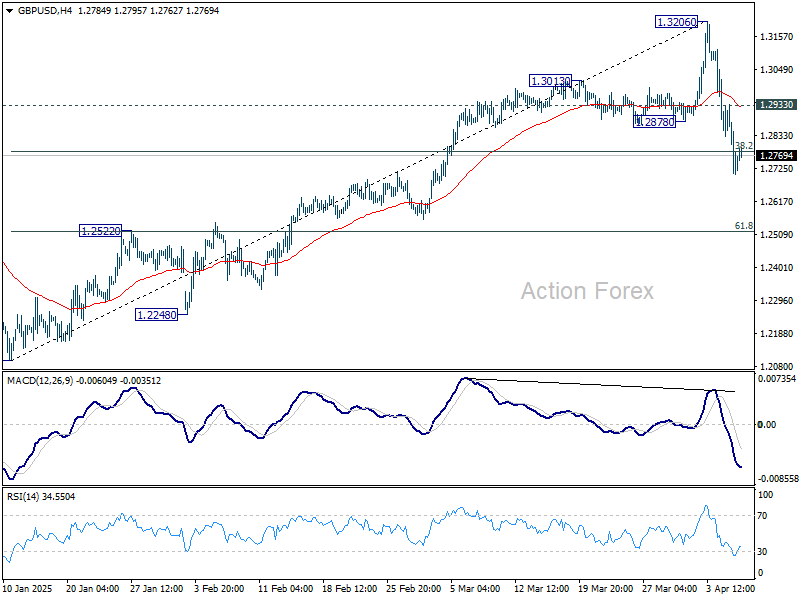
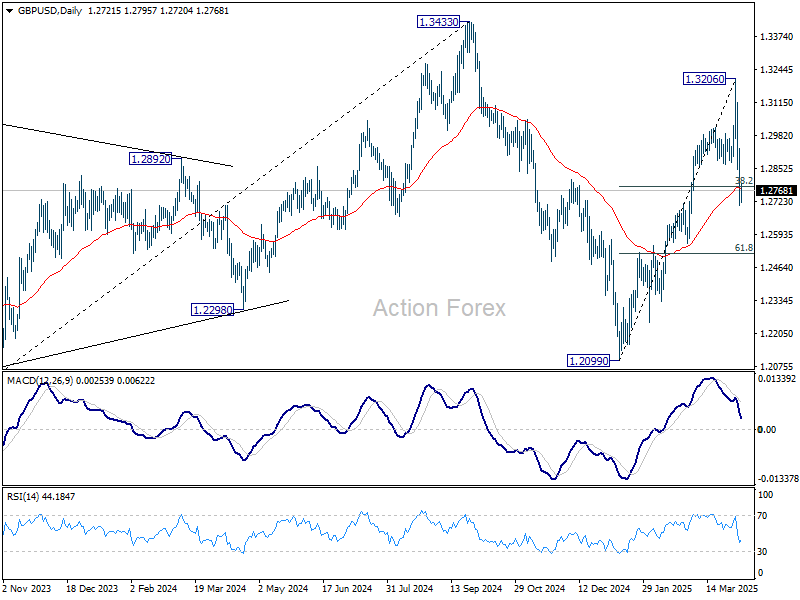
Intraday bias in GBP/USD remains on the downside as fall from 1.3206 short term top continues. Sustained trading below 38.2% retracement of 1.2099 to 1.3206 at 1.2783 will target 61.8% retracement at 1.2522. On the upside, above 1.2933 minor resistance will turn intraday bias neutral first.
In the bigger picture, price actions from 1.3433 are seen as a corrective pattern to the up trend from 1.3051 (2022 low). Rise from 1.2099 could be the second leg. Overall, GBP/USD should target 1.4248 key resistance (2021 high) on break of 1.3433 at a later stage.
USD/CHF Daily Outlook
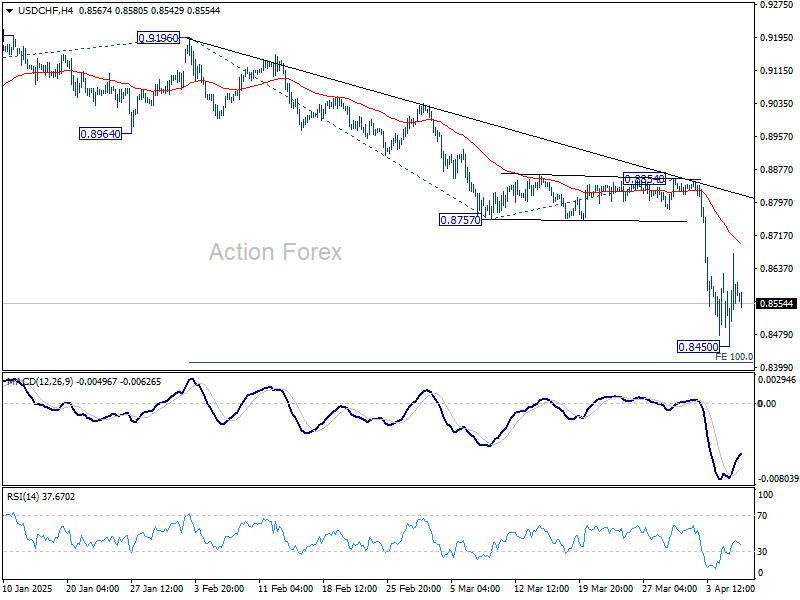
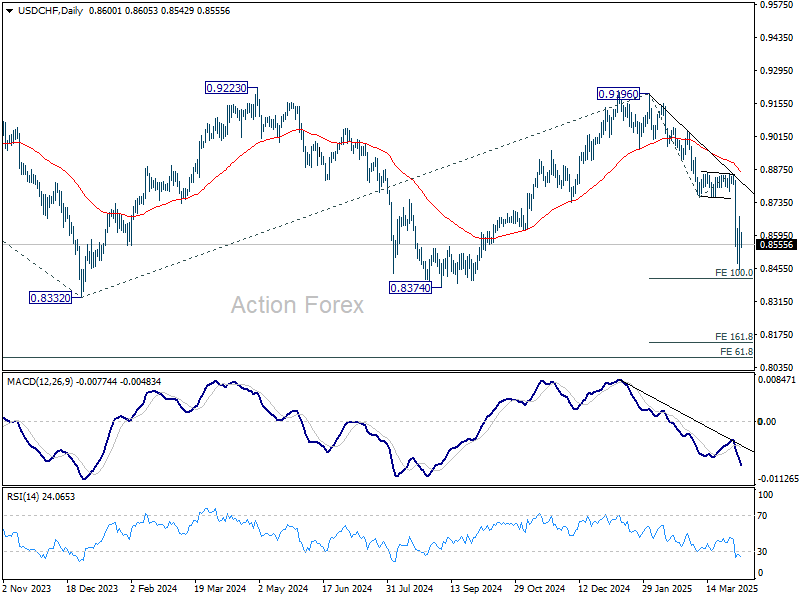
Daily Pivots: (S1) 0.8480; (P) 0.8577; (R1) 0.8704; More…
USD/CHF Is staying in consolidation above 0.8450 and intraday bias remains neutral. Upside of recovery should be limited below 0.8757 support turned resistance. On the downside, below 0.8450 will resume the fall from 0.9196 and target 100% projection of 0.9196 to 0.8757 from 0.8854 at 0.8415.
In the bigger picture, rejection by 0.9223 key resistance keep medium term outlook bearish. That is, larger fall from 1.0342 (2017 high) is not completed yet. Firm break of 0.8332 (2023 low) will confirm down trend resumption. Next target is 61.8% projection of 1.0146 (2022 high) to 0.8332 from 0.9196 at 0.8075.
AUD/USD Daily Report
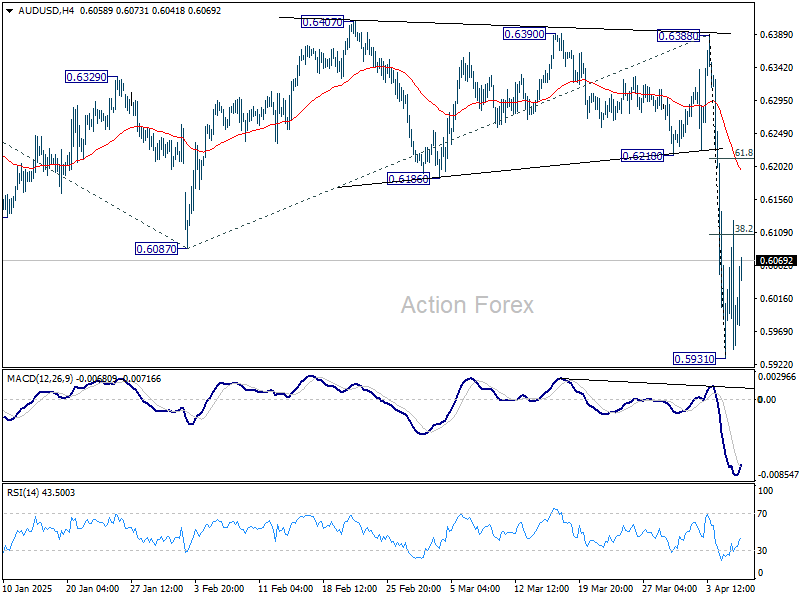
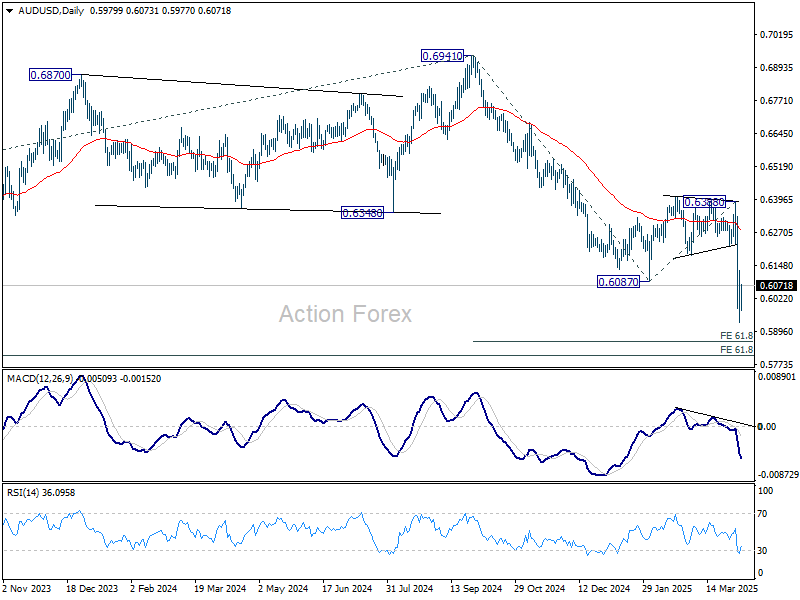
Daily Pivots: (S1) 0.5903; (P) 0.6016; (R1) 0.6098; More...
Intraday bias in AUD/USD remains neutral for consolidations above 0.5931 temporary low. Stronger rebound cannot be ruled out. But upside should be limited below 0.6218 support turned resistance to bring another fall. On the downside, break of 0.5931 will resume larger decline to 61.8% projection of 0.6941 to 0.6087 from 0.6388 at 0.5860.
In the bigger picture, fall from 0.6941 (2024 high) is seen as part of the down trend from 0.8006 (2021 high). Next medium term target is 61.8% projection of 0.8006 to 0.6169 from 0.6941 at 0.5806. In any case, outlook will stay bearish as long as 0.6388 resistance holds.
USD/CAD Daily Outlook
Daily Pivots: (S1) 1.4187; (P) 1.4242; (R1) 1.4303; More...
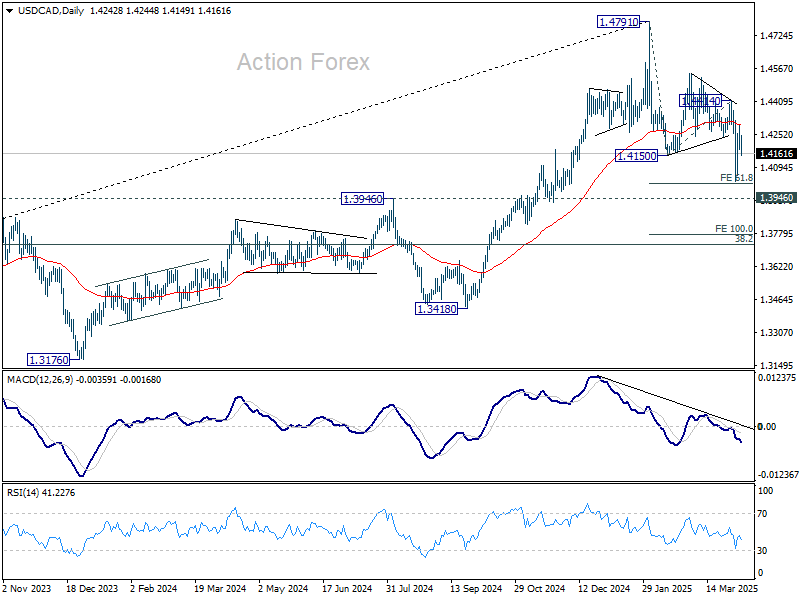
Intraday bias in USD/CAD stays neutral at this point. On the upside, firm break of 1.4414 resistance will suggest that the decline from 1.4791 has completed as a three wave correction, and turn bias back to the upside for retesting 1.4791 high. However, firm break of 61.8% projection of 1.4791 to 1.4150 from 1.4414 at 1.4018, could prompt downside acceleration to 100% projection at 1.3773 next.
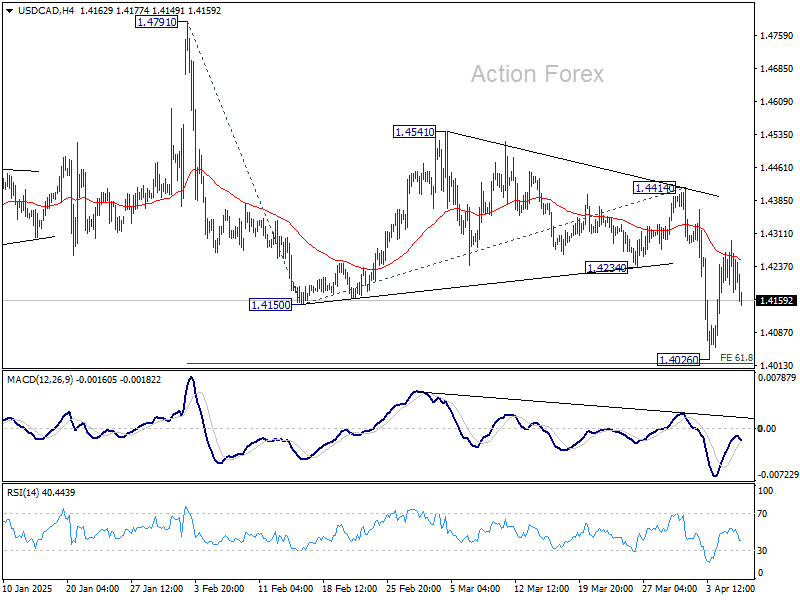
In the bigger picture, focus is now on 1.3976 resistance turned support (2022 high), which is close to 55 W EMA (now at 1.4001). Strong rebound from there will retain medium term bullishness. That is, up trend from 1.2005 is still in progress for breaking through 1.4791 at a later stage. However, sustained break there should confirm medium term topping at 1.4791. Deeper correction would be seen to 38.2% retracement of 1.2005 (2021 low) to 1.4791 at 1.3727.