Sample Category Title
Brent Crude Price Continues to Fall
Today, the price of Brent crude has dropped below $60 per barrel, marking its lowest level since March 2021. As shown on the XBR/USD chart, from the start of 2025, the price saw a rise of around 2.6% at the end of March 2025.
Why is oil falling?
The key driver is the escalation of the trade war. Yesterday, the US President announced the imposition of additional tariffs on trade with China, bringing the total to 104%.
The decline in Brent prices seems to reflect traders' concerns about the risks of a global recession.
Oil price forecasts for 2025 and 2026
Yesterday, analysts at Goldman Sachs released their oil price forecasts for Brent and WTI crude. They expect prices to reach $62 per barrel for Brent and $58 for WTI by December 2025. By December 2026, they anticipate a further decline to $55 and $51, respectively. However, analysts caveat that these forecasts are based on the assumption that the US will avoid a recession and that OPEC+ countries will increase their supplies.
In the event of a global economic slowdown, Brent prices could drop to $40 by the end of 2026.
Technical analysis of the XBR/USD chart today
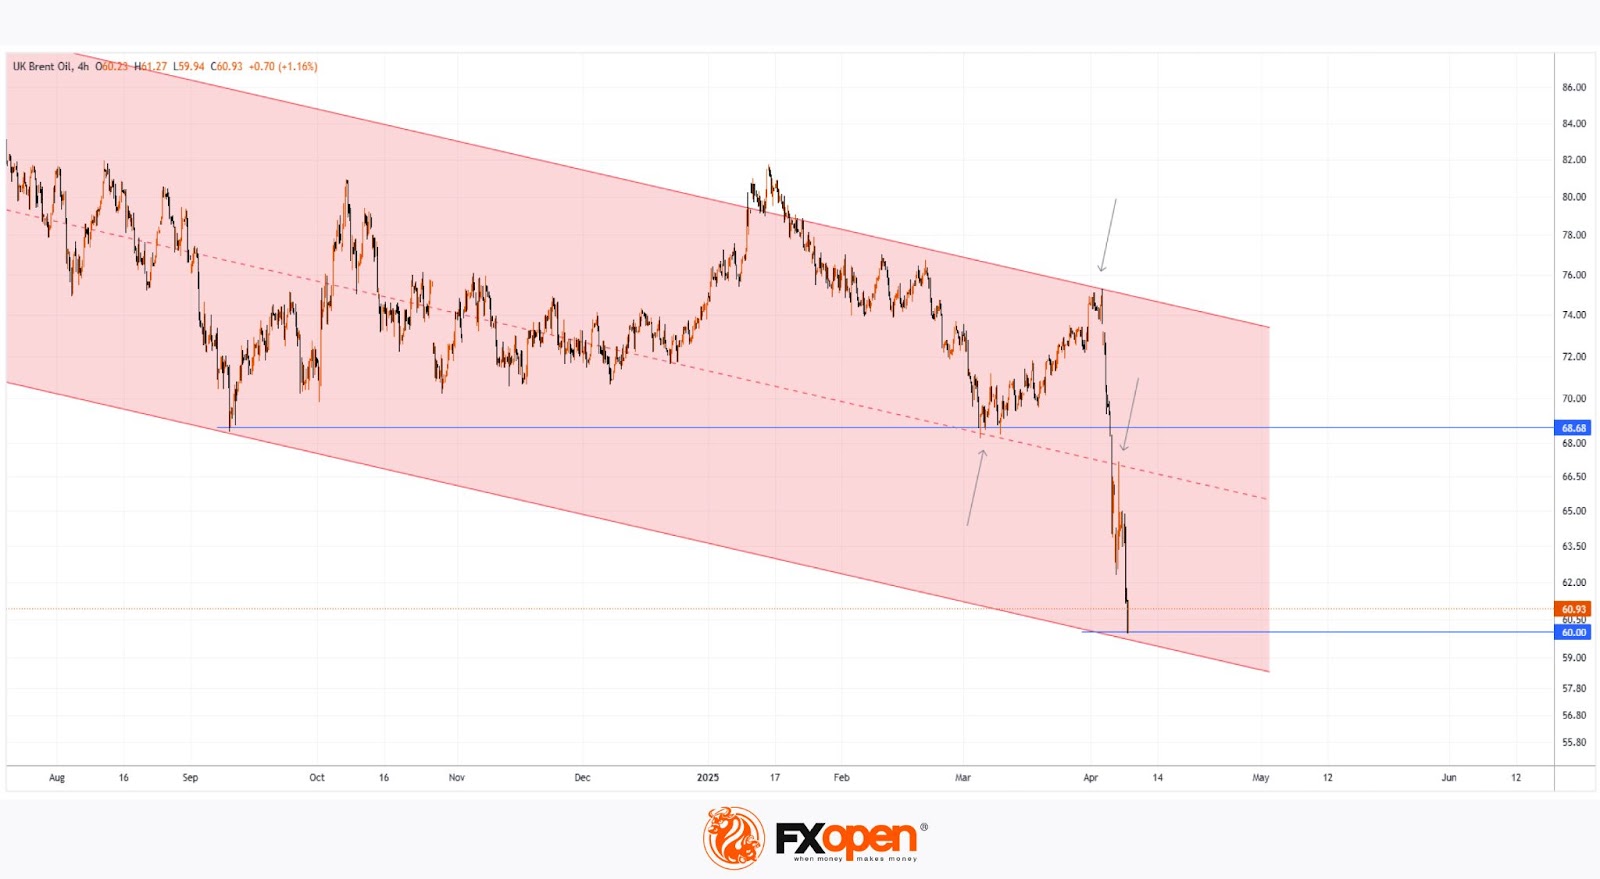
The sharp decline in Brent prices has resulted in a forceful breach of key lows from 2024 and 2025 around the $68.68 level.
Additionally, the XBR/USD chart shows that the price continues to follow a downward channel (indicated in red), with the following levels acting as resistance (marked by arrows):
→ The upper boundary of the channel;
→ Its median (previously acting as support) – indicating the dominance of supply forces.
It is possible that the lower boundary of the channel, strengthened by the psychological level of $60.00, will provide support, slowing the bearish progress of Brent prices. However, the key factor will undoubtedly be the news flow, with sharp statements from the White House.
Traders are focusing on how China will react to the 104% tariffs announced by Donald Trump. As Reuters reports, the President stated yesterday, "We have many countries coming to us wanting to make deals," adding that he expects China to also seek an agreement.
Start trading commodity CFDs with tight spreads. Open your trading account now or learn more about trading commodity CFDs with FXOpen.
This article represents the opinion of the Companies operating under the FXOpen brand only. It is not to be construed as an offer, solicitation, or recommendation with respect to products and services provided by the Companies operating under the FXOpen brand, nor is it to be considered financial advice.
BoJ’s Ueda: Rate hikes still on table, but trade uncertainty clouds outlook
BoJ Governor Kazuo Ueda reaffirmed today that the central bank remains open to further rate hikes if Japan’s economic recovery continues as projected. He added that current trends in both the economy and inflation are "roughly in line" with BoJ’s forecasts.
He added that the policy board will make decisions with a "without pre-conception" mindset, and assess whether the outlook materializes as expected.
However, Ueda flagged growing concerns over trade developments globally, warning of "heightening uncertainty over developments in each country's trade policy".
"We need to pay due attention to risks," he warned.
EUR/USD Resumes Increase While USD/CHF Dives
EUR/USD started a fresh increase above the 1.0950 resistance. USD/CHF declined and is now struggling below the 0.8615 resistance.
Important Takeaways for EUR/USD and USD/CHF Analysis Today
- The Euro started a decent upward move from the 1.0880 zone against the US Dollar.
- There was a break above a key bearish trend line with resistance at 1.0955 on the hourly chart of EUR/USD at FXOpen.
- USD/CHF declined below the 0.8675 and 0.8615 support levels.
- There is a short-term bearish trend line forming with resistance near 0.8550 on the hourly chart at FXOpen.
EUR/USD Technical Analysis
On the hourly chart of EUR/USD at FXOpen, the pair started a fresh increase from the 1.0775 zone. The Euro cleared the 1.0950 resistance to move into a bullish zone against the US Dollar, as mentioned in the last analysis.
The bulls pushed the pair above the 50-hour simple moving average and 1.1000. Finally, the pair tested the 1.1150 resistance. A high was formed near 1.1146 before the pair corrected gains. It dipped below 1.1000 and tested 1.0880.
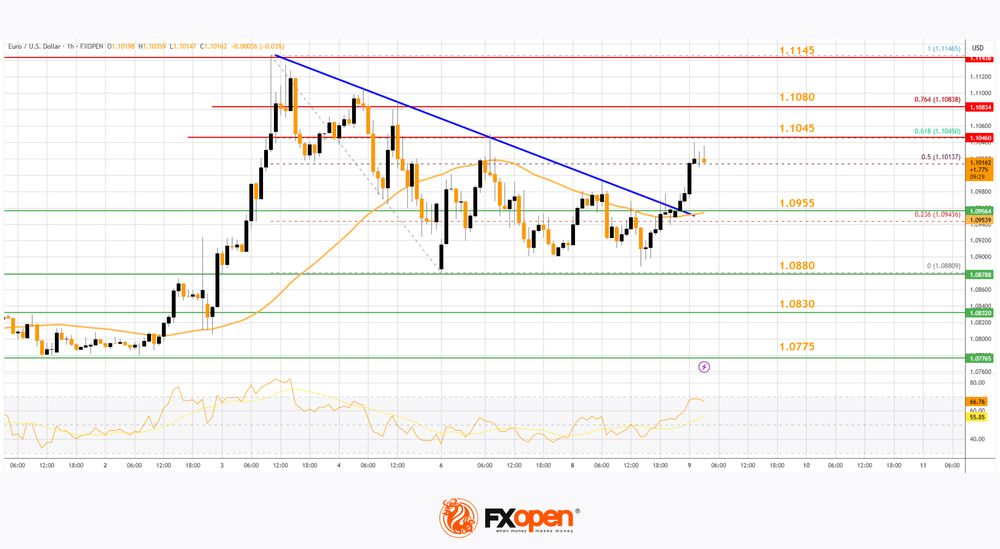
The pair is again rising from the 1.0880 zone. There was a break above a key bearish trend line with resistance at 1.0955. The pair climbed above the 50% Fib retracement level of the downward move from the 1.1146 swing high to the 1.0880 low.
Immediate resistance on the EUR/USD chart is near the 1.1045 zone and the 61.8% Fib retracement level of the downward move from the 1.1146 swing high to the 1.0880 low.
The first major resistance is near the 1.1080 level. An upside break above the 1.1080 level might send the pair toward the 1.1145 resistance. The next major resistance is near the 1.1165 level. Any more gains might open the doors for a move toward the 1.1200 level.
Immediate support on the downside is near the 1.0955 level. The next major support is the 1.0880 level. A downside break below the 1.0880 support could send the pair toward the 1.0830 level. Any more losses might send the pair into a bearish zone toward 1.0775.
USD/CHF Technical Analysis
On the hourly chart of USD/CHF at FXOpen, the pair started a fresh decline from well above the 0.8800 zone. The US Dollar dropped below the 0.8675 support to move into a negative zone against the Swiss Franc.
The bears pushed the pair below the 50-hour simple moving average and 0.8615. Finally, the bulls appeared near the 0.8420 level. A low was formed near 0.8421 and the pair is now consolidating losses.
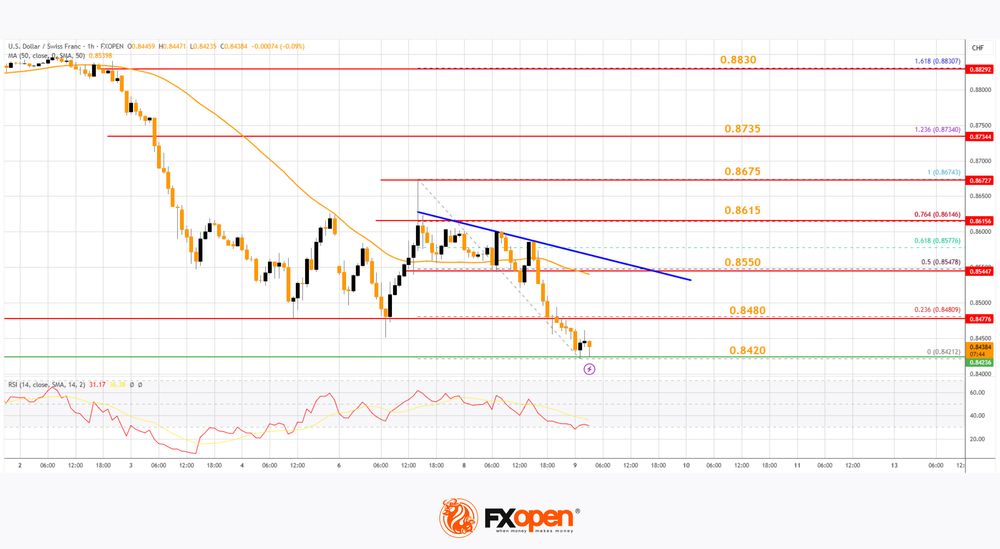
On the upside, the pair could face resistance near the 0.8480 level. It is near the 23.6% Fib retracement level of the downward move from the 0.8674 swing high to the 0.8421 low. The next major resistance is near the 0.8550 level.
There is also a short-term bearish trend line forming with resistance near 0.8550. It coincides with the 50% Fib retracement level of the downward move from the 0.8674 swing high to the 0.8421 low, above which the pair could test the 0.8615 level.
If there is a clear break above the 0.8615 resistance zone, the pair could start another increase. In the stated case, it could even surpass 0.8675.
On the downside, immediate support on the USD/CHF chart is 0.8420. The first major support is near the 0.8400 level. The next major support is near 0.8350. Any more losses may possibly open the doors for a move toward the 0.8220 level in the coming days.
Trade over 50 forex markets 24 hours a day with FXOpen. Take advantage of low commissions, deep liquidity, and spreads from 0.0 pips. Open your FXOpen account now or learn more about trading forex with FXOpen.
This article represents the opinion of the Companies operating under the FXOpen brand only. It is not to be construed as an offer, solicitation, or recommendation with respect to products and services provided by the Companies operating under the FXOpen brand, nor is it to be considered financial advice.
Signs of Markets Stress Building Further, US Treasuries Hit Hard
Markets
Early in the session yesterday, parts of global markets showed some relative calm compared the extreme volatility on Monday. Some (desperate?) investors hoped that US negotiations with some countries like Japan could herald the start of a more modest approach? Or was it simply a pause after wild repositioning? Whatever the reason, the ‘calm’ didn’t last long. Despite the headlines on (potential) negotiations with trading partners, reciprocal tariffs kicked in fully. The mark-up for China tariffs to 104% also only illustrated that trade tensions intensified rather than eased. In the meantime, a $58bn US Treasury 3-y note action drew only mediocre investors interest (lower bid cover 2.47 vs 2.7 at previous auction and tailing at 3.784% vs WI bid at 3.76%) flagging more underlying market stress. The immediate impact at the short end of the US yield curve remained modest as ST yields are still in the first place driven by expectations on monetary policy. However, it clearly was a warning sign for 10-y and 30-y auctions scheduled for today and tomorrow. In a further sharp steepening move, the US 2-y yield still eased 3.7 bps, but the long end (30-y) jumped 14.5 bps. Ever growing trade tensions and rising bond market stress also caused US equites to give up opening gains (S&P 500 -1.57%, Nasdaq -2.15%). Earlier in the session, German yields in a rather orderly move added between 5.8 bps (2-y) and 0.6 bps (30-y). Moves in the major dollar cross rates also remained rather modest compared to the swings in bonds and equities. Even so, the dollar gave up most earlier gains. DXY again closed just below the 103 handle. EUR/USD finished the session at 1.0958 (from 1.091). The yen again outperformed to close at USD/JPY 146.25.
This morning, signs of markets stress are building further. US Treasuries are hit hard with the 30-y yield at some point jumping another 20 bps and hitting 5%. The US-Treasury sell-off also spilled over to Japanese bond markets. The 30-y JGB yield at some point jumped 25 bps to 2.8%, triggering a crisis meeting of the MOF, the BOJ and FSA. It helped ease the sell-off, at least temporary. The yuan (USD/CNY 7.35) extends its (engineered) decline against a broadly weaker dollar. EUR/USD firmly regained the 1.10 mark (1.105). USD/JPY is testing 145. Later today, a $39bn 10-yr Treasury action could intensify the ‘sell US trade’. It again looks that we are heading for a risk-off session, but with the dollar and US treasuries confronted the with loss of their safe haven virtues. Declining market liquidity and forced market repositioning annex other deleveraging (e.g. base trades trading the spread between futures and cash bonds) might intensify markets stress.
News & Views
The Reserve Bank of New Zealand reduced its policy rate by 25 bps this morning to 3.5%. Growth and inflation evolved broadly as expected since the February monetary policy report with inflation near the mid-point of the 1-3% target band. That puts the RBNZ in the perfect spot to respond to developments. The recently announced increases in global trade barriers weaken the outlook for global economic activity. On balance, these developments create downside risks to the outlook for economic activity and inflation in New Zealand. Regarding inflation, the RBNZ points to trade diversion effects (lower import prices as trade gets redirected), lower global oil prices and weaker NZ growth (exports, but also subdued investment & spending). As the extent and effect of tariff policies become clearer, the MPC has scope to lower the policy rate further as appropriate. The kiwi dollar this morning tested support at NZD/USD 0.5470/0.5512 (2020 bottom & 2022 bottom). Losing this support would bring the kiwi dollar to its lowest level since early 2009.
The Reserve Bank of India cut its policy rate by 25 bps as well, from 6.25% to 6%, and switched its policy stance from neutral to accommodative, signaling more rate cuts ahead. Inflation is currently below the 4% target, supported by a sharp fall in food inflation, but new projections also show a decisive improvement in the inflation outlook. The benign outlook and moderate growth demand push the RBI into supporting growth going forward. Real GDP growth is now projected at 6.5% for FY 2025-2026 with inflation projected at 4%. During this week’s market turmoil, USD/INR reversed a large part of the March correction lower with the pair bouncing back from 85 to 86.5 (vs YTD/all-time high just below 88).
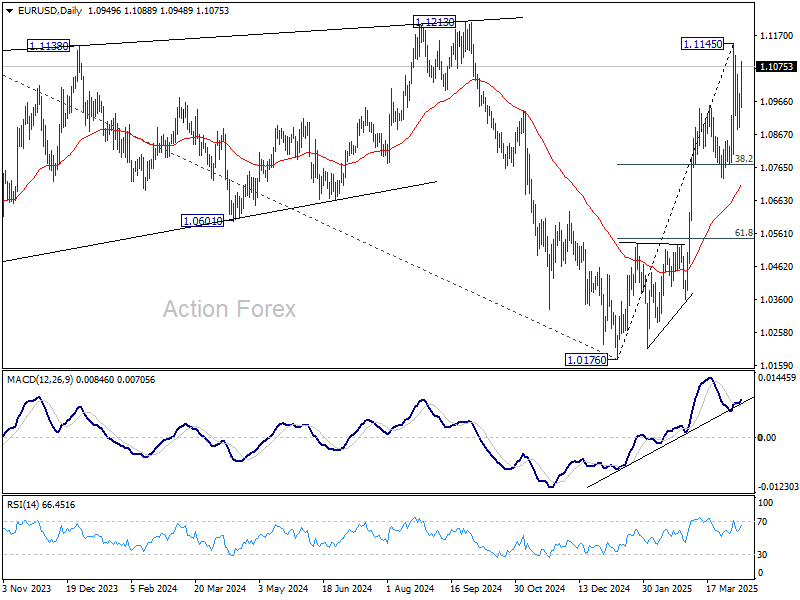
EUR/USD Daily Outlook
Daily Pivots: (S1) 1.0901; (P) 1.0946; (R1) 1.1004; More...
EUR/USD is staying below 1.1145 despite current rebound, and intraday bias remains neutral. More consolidations could be seen, but in case of another retreat, downside should be contained by 38.2% retracement of 1.0176 to 1.1145 at 1.0775. On the upside, above 1.1145 will resume the rally from 1.0176 to 1.1213/74 key resistance zone next.
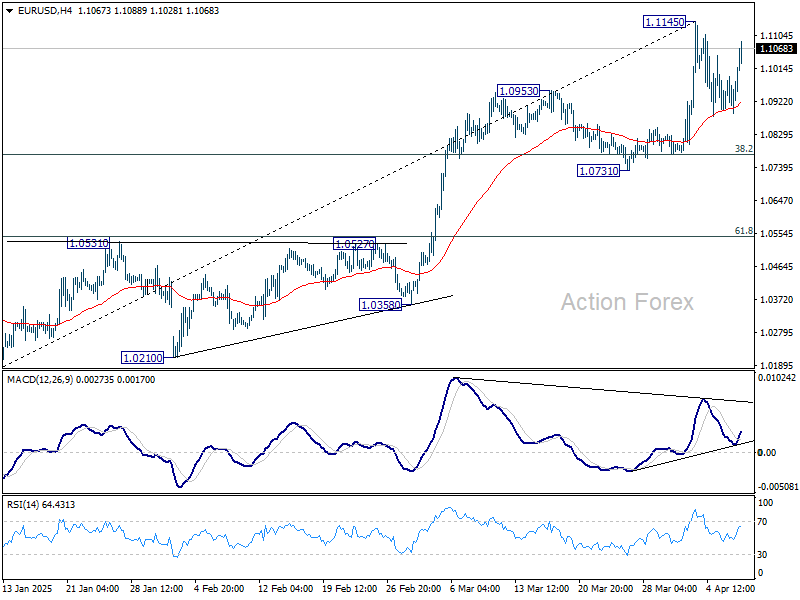
In the bigger picture, fall from 1.1274 (2024 high) has completed as a three wave correction to 1.0176. Rise from 0.9534 ready to resume. Decisive break of 1.1274 will target 100% projection of 0.9534 to 1.1274 from 1.0176 at 1.1916. Also, that will send EUR/USD through the multi-decade channel resistance will carries larger bullish implication. This will now be the favored case as long as 1.0731 support holds.
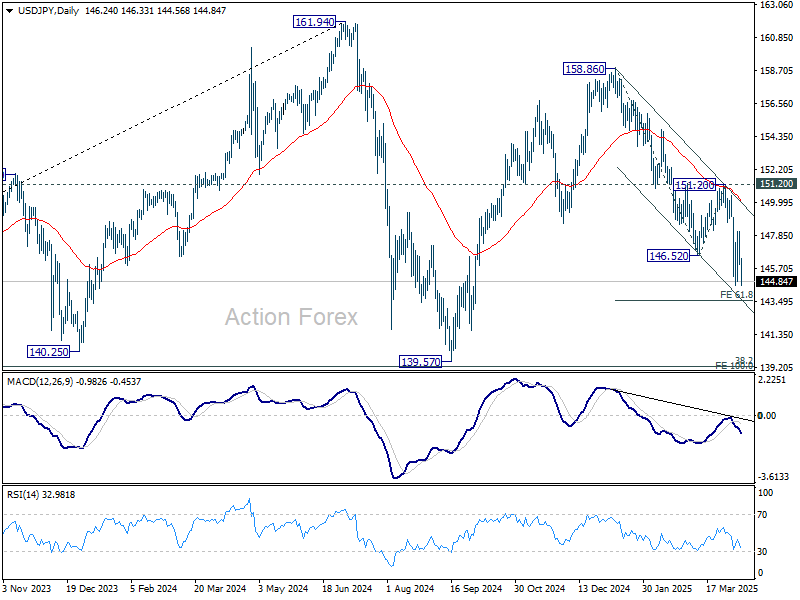
USD/JPY Daily Outlook
Daily Pivots: (S1) 145.46; (P) 146.79; (R1) 147.61; More...
Intraday bias in USD/JPY remains neutral and more consolidations could be seen above 144.54. IN case of another recovery, upside should be limited below 151.28 resistance. On the downside, below 144.54 will resume the fall from 158.86 and target 61.8% projection of 158.86 to 146.52 from 151.20 at 143.57. Break there will target 139.57 low.
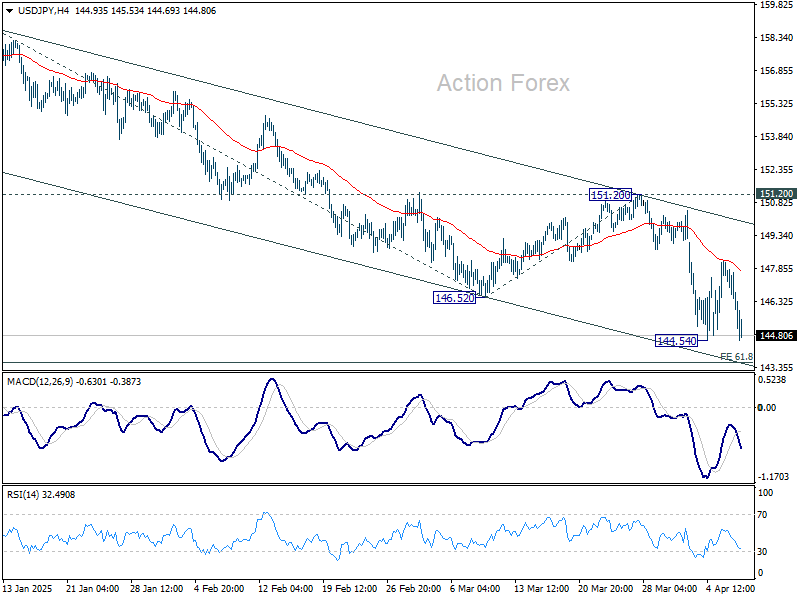
In the bigger picture, price actions from 161.94 are seen as a corrective pattern to rise from 102.58 (2021 low), with fall from 158.86 as the third leg. Strong support should be seen from 38.2% retracement of 102.58 to 161.94 at 139.26 to bring rebound. However, sustained break of 139.26 would open up deeper medium term decline to 61.8% retracement at 125.25.
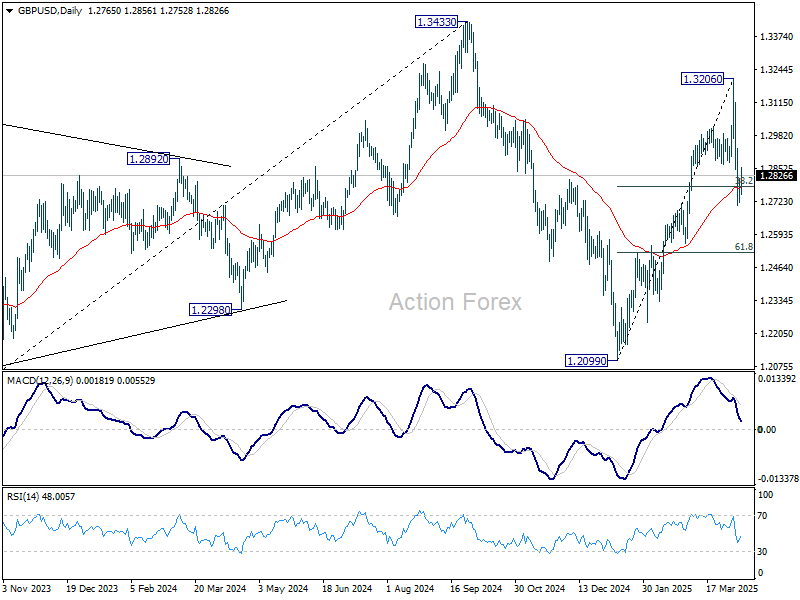
GBP/USD Daily Outlook
Daily Pivots: (S1) 1.2713; (P) 1.2764; (R1) 1.2815; More...
Intraday bias in GBP/JPY is turned neutral first with current recovery. Some consolidations would be seen but risk will stay on the downside with 1.2933 minor resistance intact. Break of 1.2706 will resume the decline from 1.3206 to 61.8% retracement of 1.2099 to 1.3206 at 1.2522. Nevertheless, firm break of 1.2933 will bring stronger rebound back to retest 1.3206 high.
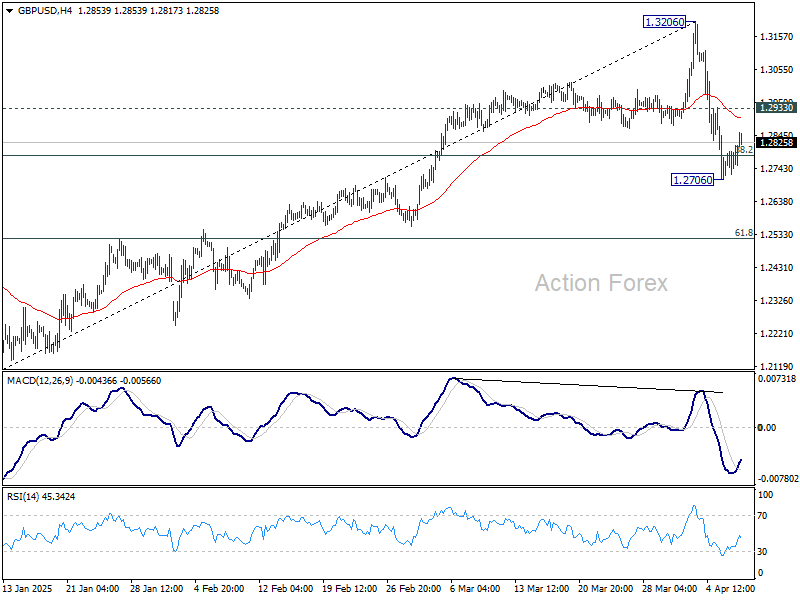
In the bigger picture, price actions from 1.3433 are seen as a corrective pattern to the up trend from 1.3051 (2022 low). Rise from 1.2099 could be the second leg. Overall, GBP/USD should target 1.4248 key resistance (2021 high) on break of 1.3433 at a later stage.
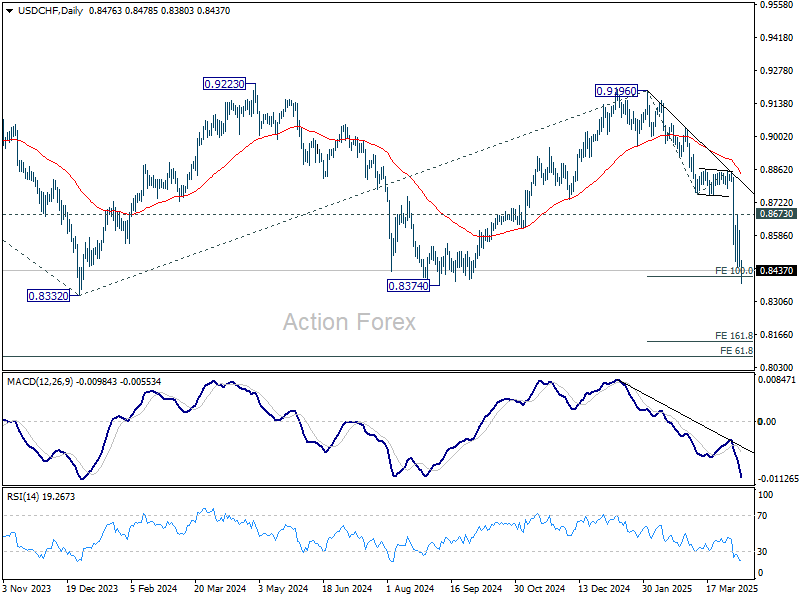
USD/CHF Daily Outlook
Daily Pivots: (S1) 0.8416; (P) 0.8518; (R1) 0.8581; More…
USD/CHF's decline from 0.9196 resumed after brief consolidations and intraday bias is back on the downside. Firm break of 0.8332/8374 key support zone will confirm larger down trend resumption. On the upside, break of 0.8673 resistance is needed to indicate short term bottoming. Otherwise, outlook will stay bearish in case of recovery.
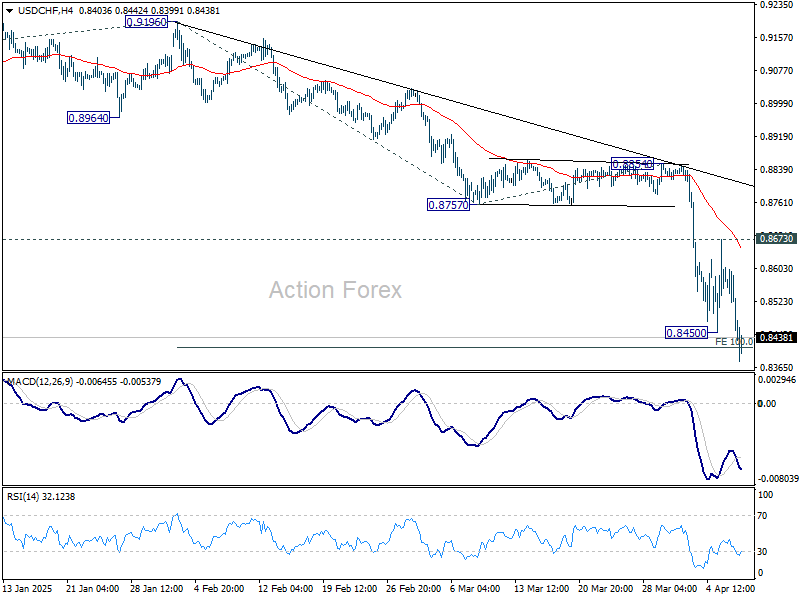
In the bigger picture, rejection by 0.9223 key resistance keep medium term outlook bearish. That is, larger fall from 1.0342 (2017 high) is not completed yet. Firm break of 0.8332 (2023 low) will confirm down trend resumption. Next target is 61.8% projection of 1.0146 (2022 high) to 0.8332 from 0.9196 at 0.8075.
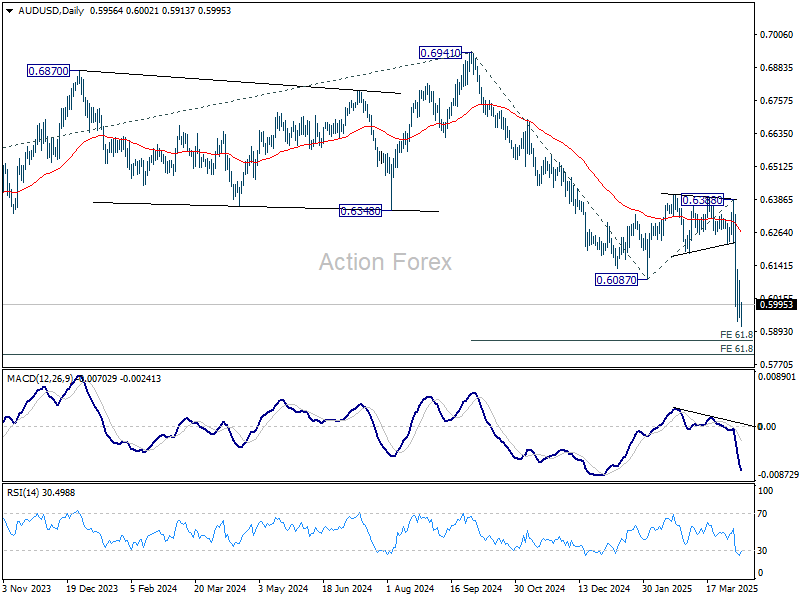
AUD/USD Daily Report
Daily Pivots: (S1) 0.5907; (P) 0.5997; (R1) 0.6046; More...
AUD/USD dips to 0.5913 but quickly recovered. Intraday bias stays neutral and more consolidations could be seen. Outlook will stay bearish as long as 55 4H EMA (now at 0.6155) holds. Break of 0.5915 will resume larger decline to 61.8% projection of 0.6941 to 0.6087 from 0.6388 at 0.5860.
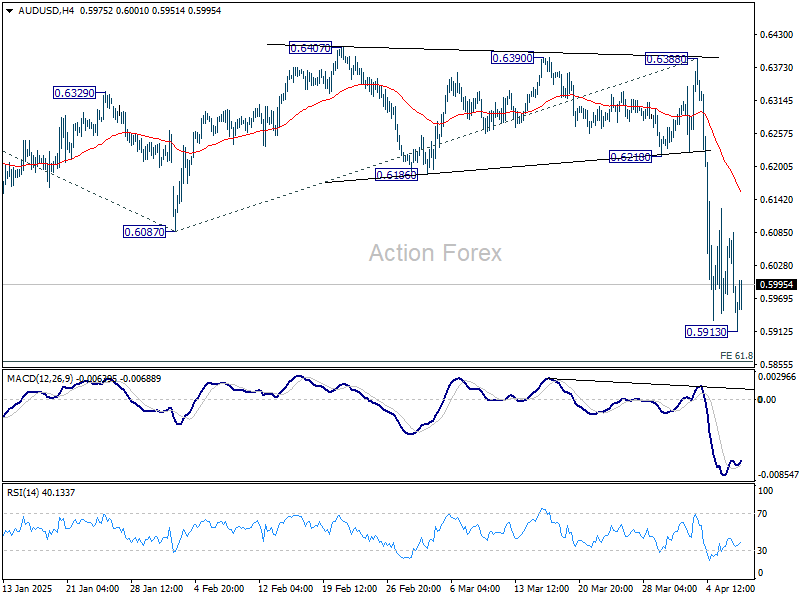
In the bigger picture, fall from 0.6941 (2024 high) is seen as part of the down trend from 0.8006 (2021 high). Next medium term target is 61.8% projection of 0.8006 to 0.6169 from 0.6941 at 0.5806. In any case, outlook will stay bearish as long as 0.6388 resistance holds.
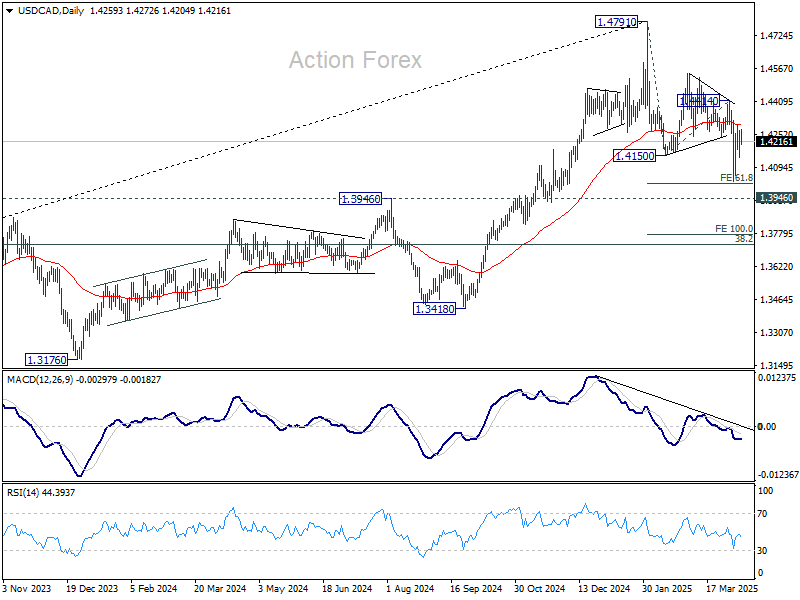
USD/CAD Daily Outlook
Daily Pivots: (S1) 1.4181; (P) 1.4226; (R1) 1.4309; More...
Range trading continues in USD/CAD and intraday bias stays neutral. On the upside, firm break of 1.4414 resistance will suggest that the decline from 1.4791 has completed as a three wave correction, and turn bias back to the upside for retesting 1.4791 high. However, firm break of 61.8% projection of 1.4791 to 1.4150 from 1.4414 at 1.4018, could prompt downside acceleration to 100% projection at 1.3773 next.
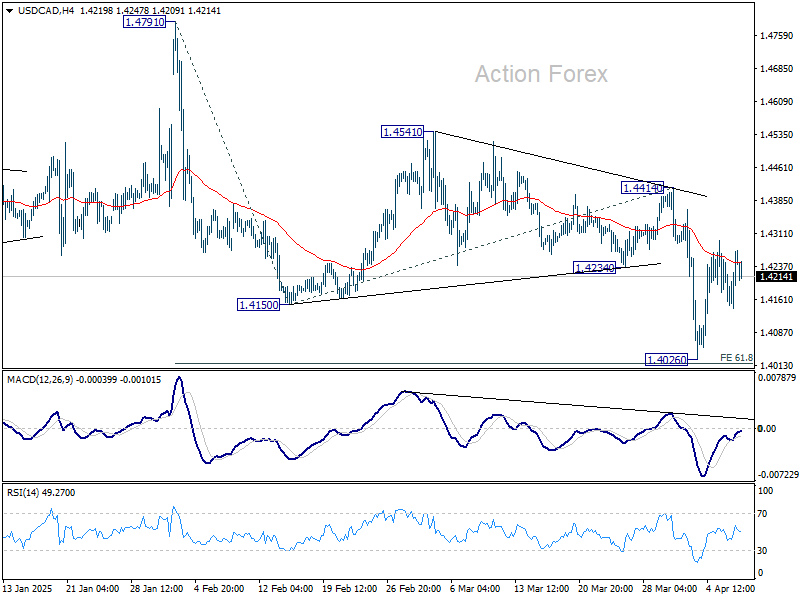
In the bigger picture, focus is now on 1.3976 resistance turned support (2022 high), which is close to 55 W EMA (now at 1.4001). Strong rebound from there will retain medium term bullishness. That is, up trend from 1.2005 is still in progress for breaking through 1.4791 at a later stage. However, sustained break there should confirm medium term topping at 1.4791. Deeper correction would be seen to 38.2% retracement of 1.2005 (2021 low) to 1.4791 at 1.3727.