Sample Category Title
Don’t Expect Any New BuzzWord From The ECB
This is going to be one of those boring meetings where nothing new is expected from the European Central Bank. The president of the European Central Bank, Mario Draghi, has already laid out the monetary policy plan for the region during his most recent meeting on June 14. The bank has already talked about ending the quantitative easing program.
Subject which matters the most for traders is; if the ECB is going to give away anything on the interest rate hike?
Nobody is expecting the ECB to move the needle on the interest rate hike. The market is expecting the interest rates to stay at their current level at least for some quarters. Market participants are aware of the fact that the ECB is keeping all the doors open to keep the flexibility element in its policy. Everything is dependent on the economic growth and inflation, if any of these two show weakness, the bank could change its sailing path with little notice.
Back in June, Draghi touched on the future reinvestments of maturing securities of its QE portfolio. Of course, on Thursday, we need more details on the possibility of new composition of the QE portfolio. Any surprise here would impact the bond yield of the respective country.
Therefore, the Q&A session would be interesting, Draghi would have a chance to talk about his assessment of the economic health of the region in a more informal manner.
The growth in the EU is strong and we do not deny that but one cannot refute that the growth muscles are little fatigue. So, investors would be looking to asses if the ECB is going to add anything new on this subject. If Draghi sends out the message that he is comfortable with the current growth rate, it would be deemed as a hawkish stance by the market participants. As a result of this, the Euro could get some tail wind.
The ECB is keeping a close watch on its inflation target of 2%. There has been significant improvement in inflation, thanks to higher fuel prices, improving labour wages and continues drop in the unemployment rate. We do not expect anything significant here, so the inflation may not have much of say despite its significant importance.
Also, one of the most dovish member of the ECB and close ally of Draghi, Peter Praet, also thinks that the current inflation state allows winding down the QE but not strong enough to start the discussion on interest rate hike.
Another important factor which is providing a lot of support to inflation is also the weakness in the euro against the dollar. Weaker currency makes the import cheaper and it is in the ECB's favour, to not let the currency gain strength.
The Analytical Overview Of The Main Currency Pairs
The EUR/USD currency pair
Technical indicators of the currency pair:
Prev Open: 1.16920
Open: 1.16805
% chg. over the last day: -0.06
Day's range: 1.16777 – 1.16836
52 wk range: 1.0571 – 1.2557
Yesterday a variety of trends was observed on the EUR/USD currency pair. The index of economic activity in the manufacturing sector of Germany was published, which counted to 57.3, while experts expected the value of 55.5. At the moment, the technical pattern is ambiguous. Investors expect additional drivers. The key support and resistance levels are 1.16750 and 1.17100, respectively. We recommend opening positions from these marks.
The news feed on 2018.07.25:
German IFO business climate index at 11:00 (GMT+3:00);
New home sales in the US at 17:00 (GMT+3:00).
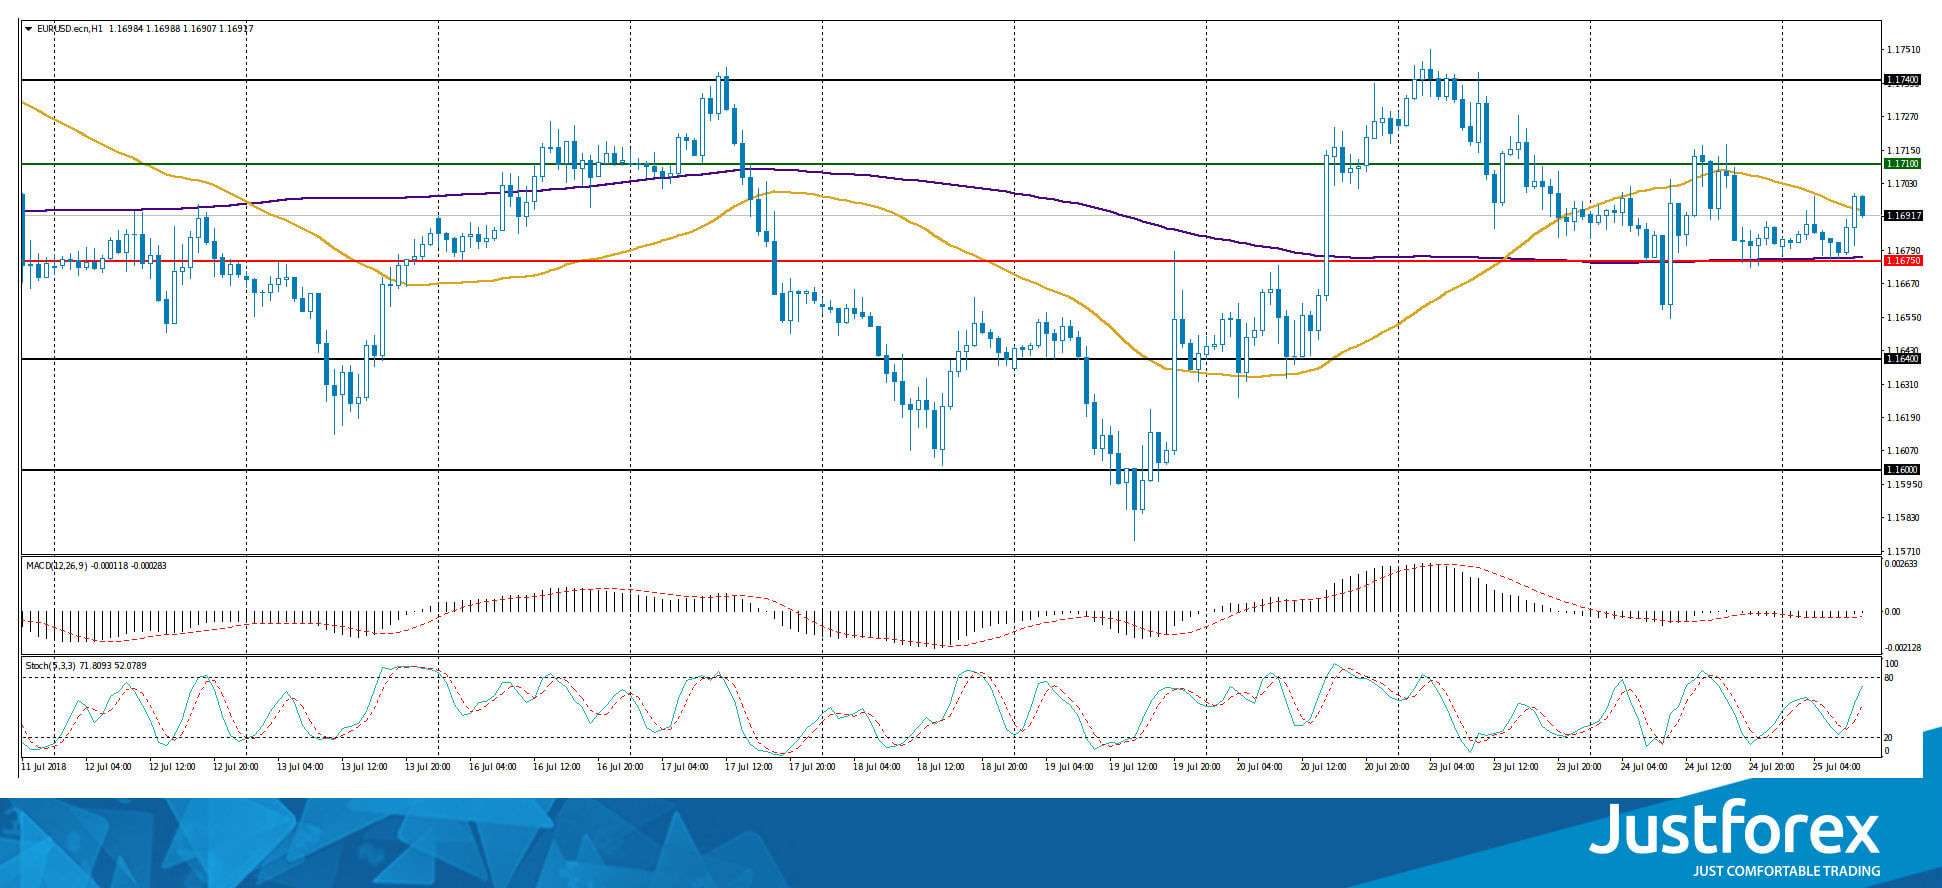
Indicators do not send accurate signals: the price is testing 50 MA.
The MACD histogram is located in the negative zone, but above the signal line, which gives a weak signal to sell EUR/USD.
Stochastic Oscillator is in the neutral zone, the %K line is above the %D line, which indicates the power of the buyers.
Trading recommendations
Support levels: 1.16750, 1.16400, 1.16000
Resistance levels: 1.17100, 1.17400
If the price fixes below 1.16750, we recommend considering sales of EUR/USD. The movement is tending to 1.16400-1.16200.
Alternative option. If the price fixes above the resistance level of 1.17100, the EUR/USD quotes are expected to grow. The movement is tending to 1.17400-1.17600.
The GBP/USD currency pair
Technical indicators of the currency pair:
Prev Open: 1.30944
Open: 1.31421
% chg. over the last day: +0.37
Day's range: 1.31610 – 1.31738
52 wk range: 1.2361 – 1.4345
During yesterday's trading session, the GBP/USD currency pair strengthened. Quotes rose by more than 70 points. At the moment, the key levels of support and resistance are: 1.31400 and 1.31900, respectively. The positions must be opened from these marks. The trading instrument is tending to grow.
The news feed on the UK economy is calm.
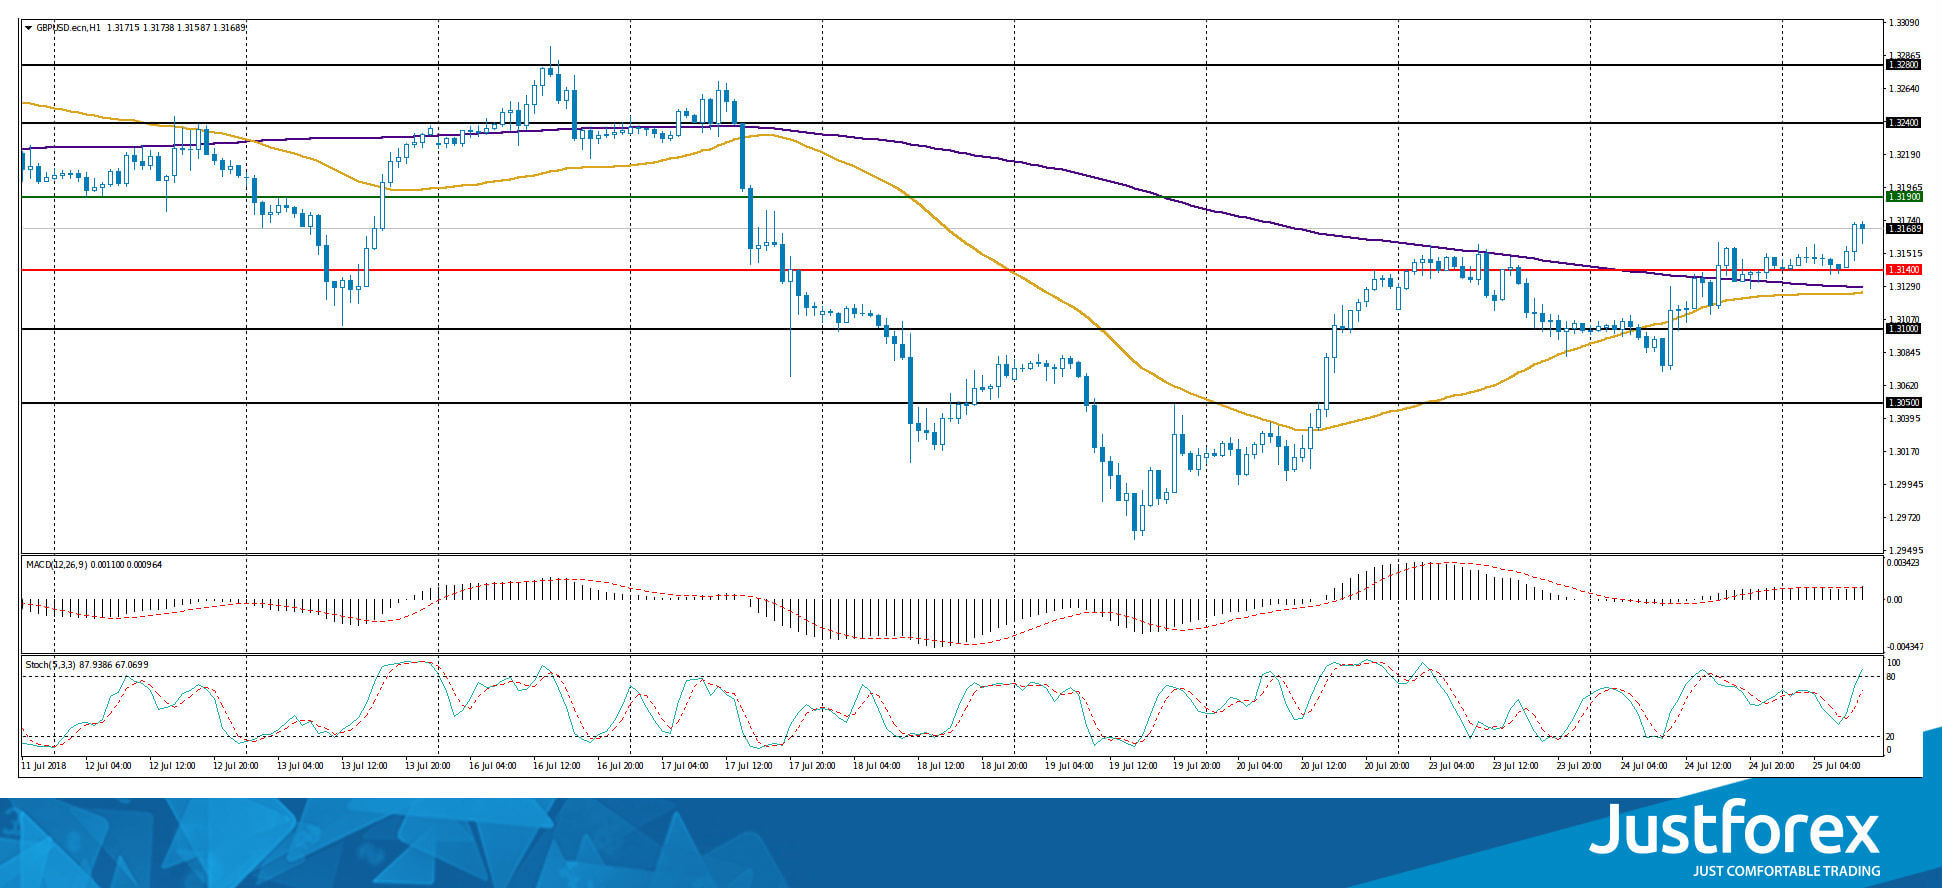
Indicators point to thw power of buyers: the price has fixed above 50 MA and 200 MA.
The MACD histogram is in the positive zone and above the signal line, which sends a signal to buy GBP/USD.
Stochastic Oscillator is located in the neutral zone, the %K line is above the %D line, which also sends a signal to buy GBP/USD.
Trading recommendations
Support levels: 1.31400, 1.31000, 1.30500
Resistance levels: 1.31900, 1.32400, 1.32800
If the price fixes above 1.31900, further growth of GBP/USD is expected. The movement is tending to 1.32400-1.32600.
Alternative option. If the price fixes below the support of 1.31400, it is necessary to consider sales of GBP/USD. The movement is tending to 1.31000-1.30800.
The USD/CAD currency pair
Technical indicators of the currency pair:
Prev Open: 1.31667
Open: 1.31542
% chg. over the last day: -0.16
Day's range: 1.31491 – 1.31575
52 wk range: 1.2059 – 1.3795
There is an ambiguous technical pattern on the USD/CAD currency pair. At the moment, the trading instrument is in a sideways trend. Local support and resistance levels are: 1.31350 and 1.31650, respectively. The positions must be opened from these marks. We recommend paying attention to the dynamics of oil quotations.
Publication of important news from Canada is not expected.
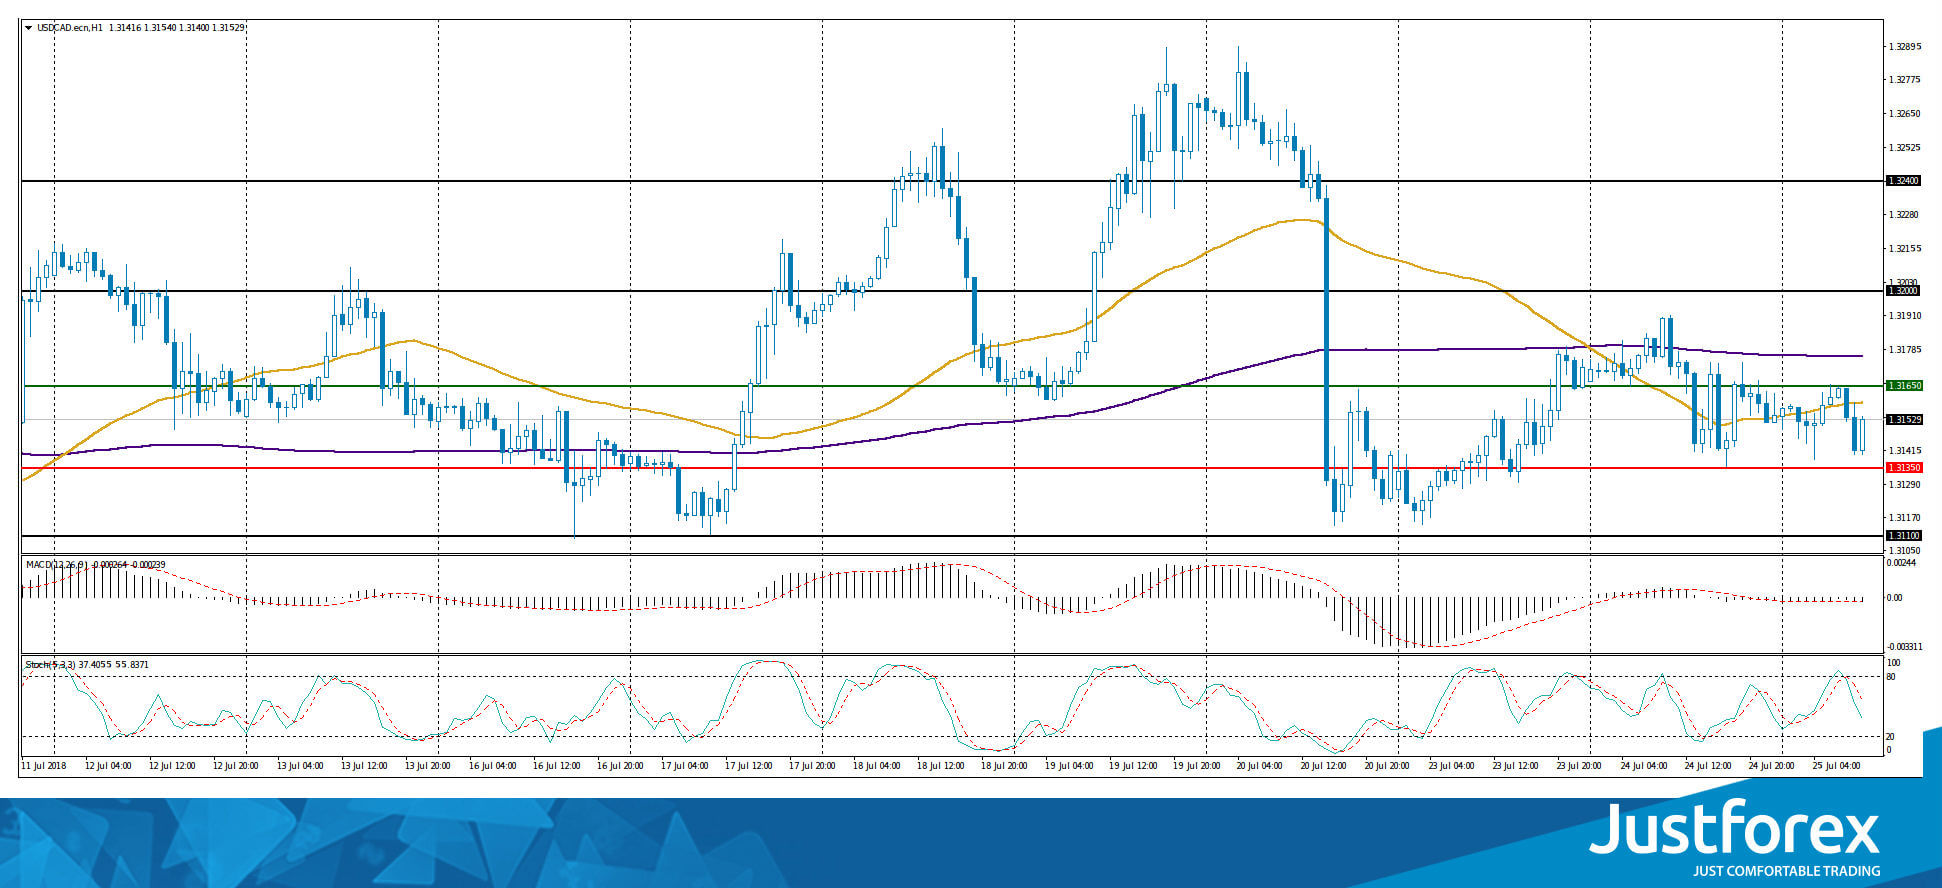
Indicators point to the power of sellers: the price has fixed below 50 MA and 200 MA.
The MACD histogram is near the mark 0. There are no accurate signals.
Stochastic Oscillator is in the neutral zone, the %K line is below the %D line, which gives a signal to sell USD/CAD.
Trading recommendations
Support levels: 1.31350, 1.31100
Resistance levels: 1.31650, 1.32000, 1.32400
If the price fixes below the support level of 1.31350, a decline of the currency pair is expected. The movement is tending to 1.31100-1.30900.
If the price fixes above the level of 1.31650, one should look for entry points to the market to open long positions. The target movement level is 1.32250-1.32600.
The USD/JPY currency pair
Technical indicators of the currency pair:
Prev Open: 111/325
Open: 111.141
% chg. over the last day: -0.05
Day's range: 111.240 – 111.310
52 wk range: 104.56 – 114.74
There is an ambiguous technical pattern on the USD/JPY currency pair. The trading instrument is in a sideways trend. Investors expect additional drivers. The key support and resistance levels are: 111.100 and 111.400, respectively. We recommend opening positions from these marks.
The news feed on Japan's economy is calm.
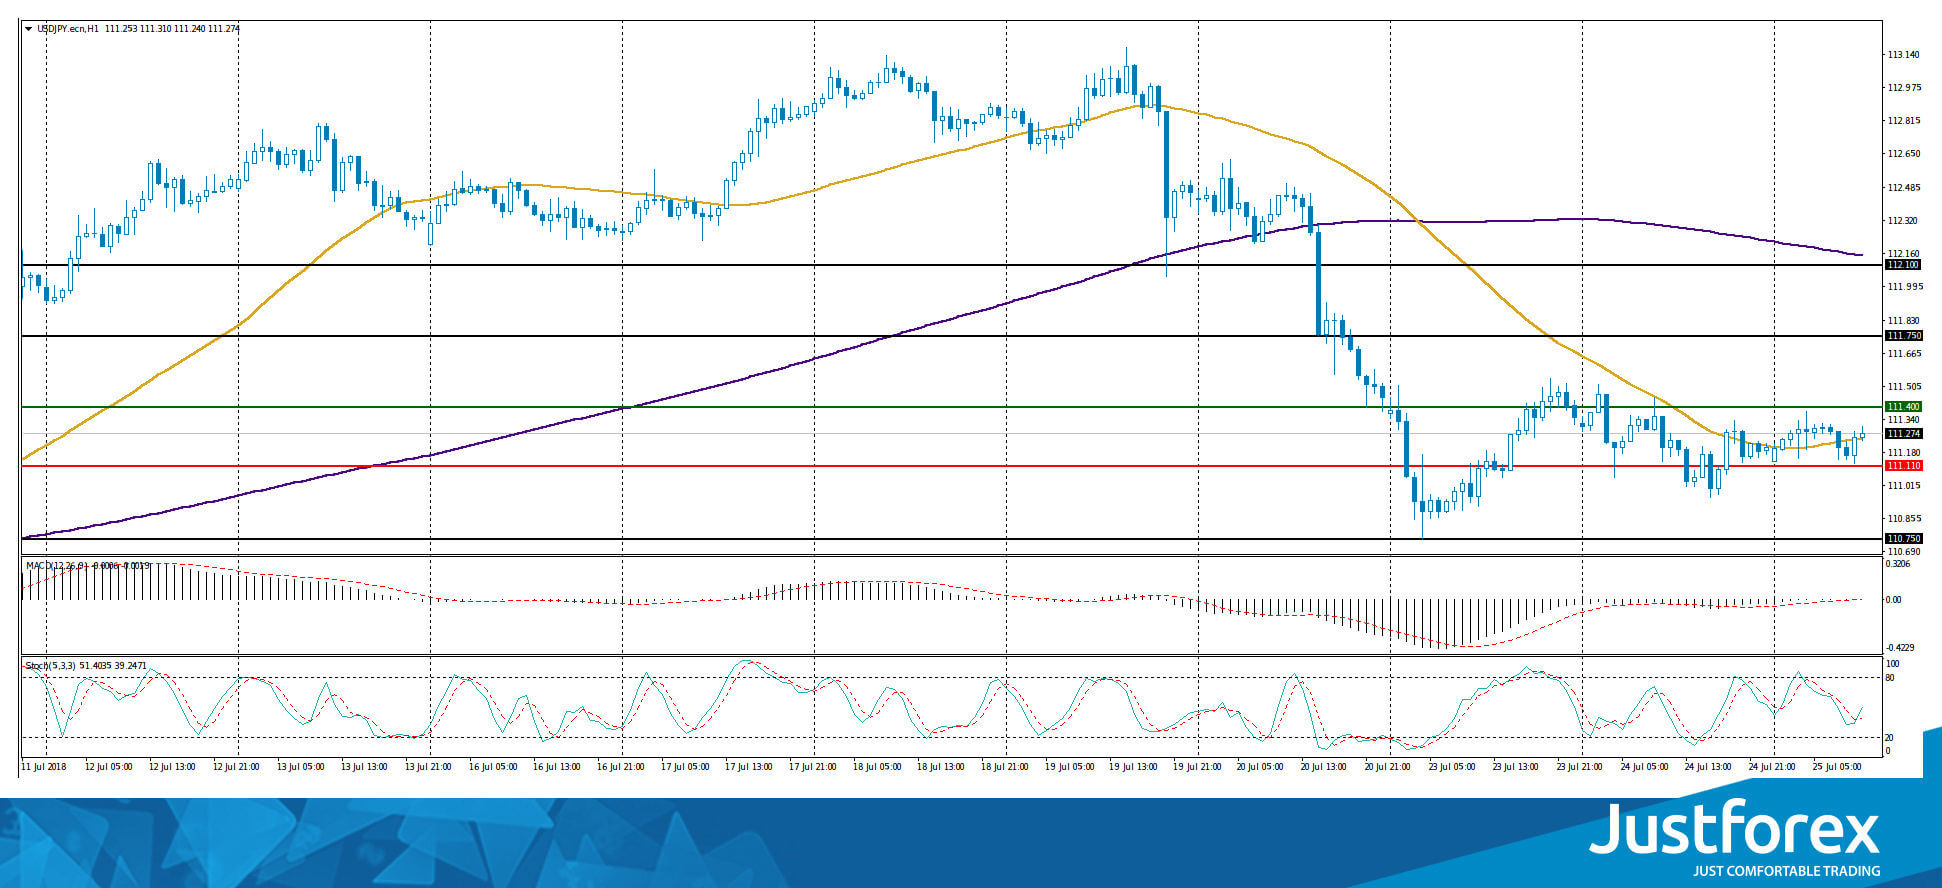
Indicators do not send accurate signals: the price is testing 50 MA.
The MACD histogram is near the 0 mark.
Stochastic Oscillator is located in the neutral zone, the %K line has crossed the %D line. There are no accurate signals.
Trading recommendations
Support levels: 111.100, 110.750
Resistance levels: 111.400, 111.750, 112.100
If the price fixes below the 111.100 level, the USD/JPY currency pair is expected to decline. The movement is tending to 110.750-110.500.
Alternative option. If the price fixes above the level of 111.400, it is necessary to consider buying USD/JPY. The movement is tending to 111.750-112.100.
USDJPY Outlook: Mixed Signals Result In Extended Narrowing Consolidation
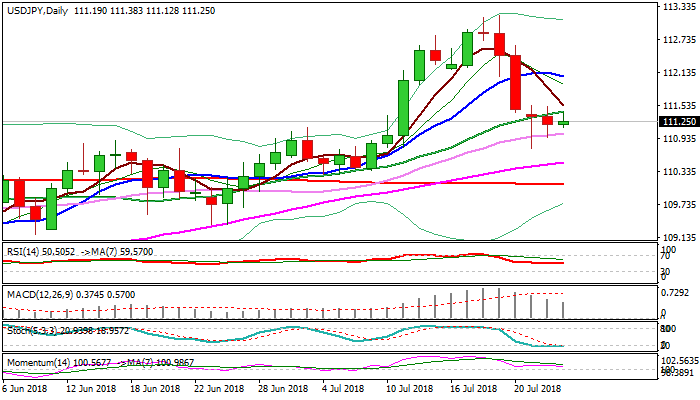
The pair is holding within narrowing consolidation which extends into third straight day, but so far without clear direction, due to mixed signals/techs. Monday’s strong downside rejection at 110.75 (left long-tailed Doji) was initial bullish signal, which was diminished by bearish close on Tuesday which also occurred below pivotal support at 111.24 (Fibo 38.2% of 108.11/113.17 ascend).
Mixed daily studies add to current neutral mode.
Initial bullish signal could be expected on break above 20SMA (111.42) which so far caps today’s action, with extension above 111.67 pivot (Fibo 38.2% of 113.17/110.75 pullback) needed to generate strong bullish signal and turn near-term focus higher.
On the other side, rising 30SMA offers initial support (111.02) guarding pivot at 110.75 (Monday’s spike low) loss of which would generate negative signal for bearish extension towards 55SMA (110.49) and strong 110 support zone (200SMA/daily cloud top).
Res: 111.42, 111.67, 112.05, 112.25
Sup: 111.02, 110.75, 110.35, 110.10
AUD/USD Slid Despite Broad USD Weakness
AUD tumbles amid weak inflation data
On Wednesday morning, all G10 currencies extended gains against the US dollar, with the exception of the Australian dollar after inflation data fell short of expectations. The Aussie fell as much as 0.75% against the buck as AUD/USD slid to $0.74. Headline CPI printed at 2.1%y/y in the second quarter versus estimate of 2.2% and 1.9% in the previous one. The trimmed mean measure – a gauge of core inflation – held stable at 1.9%, while the weighted mean CPI eased to 1.9%y/y, down from 2.1% in the first quarter.
Lately, the Aussie has been under heavy selling pressure amid escalating trade war between the US and China. Indeed, China is Australia’s largest trading partner with more than 36% of its exports going to the world’s second largest economy. In view of the ongoing uncertainties, it looks like the Aussie is doomed to trade below the $0.75 support area, as speculators have no reason to develop a bullish view on the currency. Nevertheless, the $0.73 support seems to be holding out (has not been broken since May 2017), which suggests that AUD/USD will most likely continue to tread water between 0.73 and 0.75.
Trade war: Juncker visits Trump
Starting today, European Commission President Jean-Claude Juncker and Donald Trump will be holding talks in Washington related to current trade battle between both blocs. As a reminder, the US announced early March tariffs measures of 25% and 10% on steel and aluminum for its trading partners while the EU retaliated by imposing tariffs on popular US goods for a total of USD 3.2 billion. Both trade sanctions are currently effective. Following EU retaliation, Trump threatened to impose further tariffs of 20% on EU imported vehicles, a step that would impact a total of USD 58.2 billion of auto products. The EU says it is currently drawing up a new list of products it could potentially tax in retaliation.
Contrarily to Trump’s complaint about unfair trade practices, it appears that average tariffs between both partners remained historically low, at 3%, while EU goods trade surplus to the US of USD 150 billion (USD 101 billion incl. services) confirms that the US economy is in good shape rather than being related to a bad trade deal.
Therefore, today’s trade talks remain crucial for both blocs, as further tariffs measures are underway. However, the odds of both parties finding a common agreement that is deemed to be fair is rather low, as EU diplomats are rather less optimistic. The first meeting is expected to remain a first exchange of primary views above all.
EUR/USD sideways price action started in 23. July 2018 along 1.1690 is maintained for the time being. We expect current trend to change tomorrow during ECB’s monetary policy decision, which should push the pair to the upside.
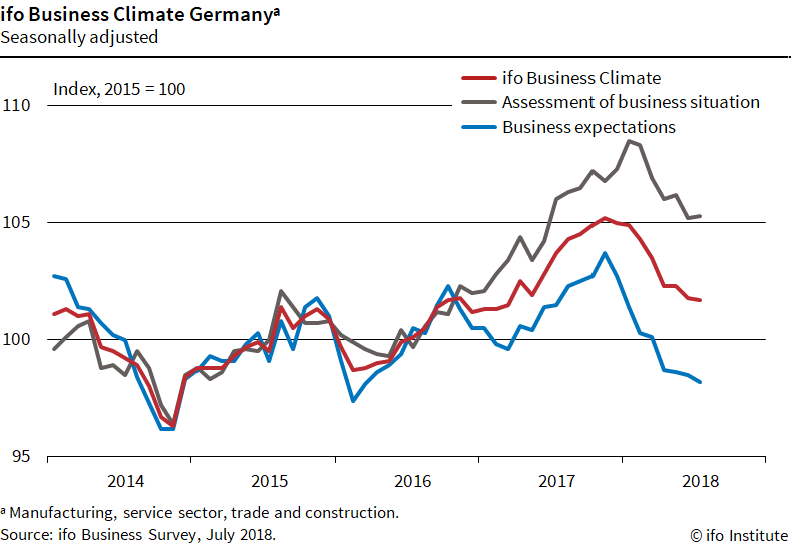
German Ifo dropped 0.1 to 101.7 in July, match expectations
German Ifo Business Climate dropped 0.1 to 101.7 in July, inline with expectation. Current Assessment, on the other hand, rose 0.2 to 105.3, above consensus of 105.1. But Expectations dropped 0.4 to 98.2, below expectation of 98.7.
Ifo President Clemens Fuest said in the release that "companies were slightly more satisfied with their current business situation, but scaled back their business expectations slightly. The German economy continues to expand, but at a slower pace."
Also, "the business climate index fell in trade. Traders were increasingly sceptical about their six-month business outlook, but more satisfied with their current business situation. This effect was particularly marked in retailing."
GBP/JPY Daily Outlook
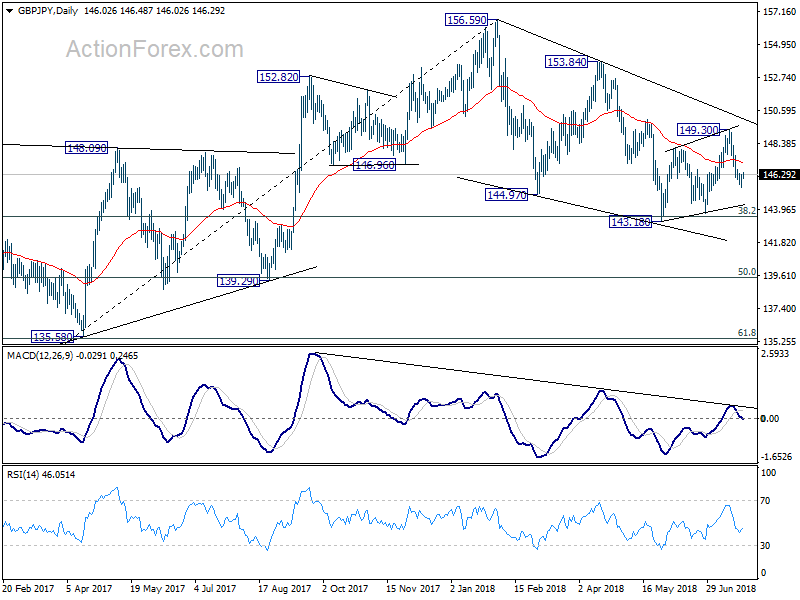
Daily Pivots: (S1) 145.62; (P) 145.97; (R1) 146.50; More...
GBP/JPY lost some downside momentum as seen in 4 hour MACD. But with 146.85 minor resistance intact, deeper fall is expected for 143.18/76 support zone. On the upside, though, above 147.65 minor resistance will turn bias back to the upside for 149.30/99 resistance zone instead.
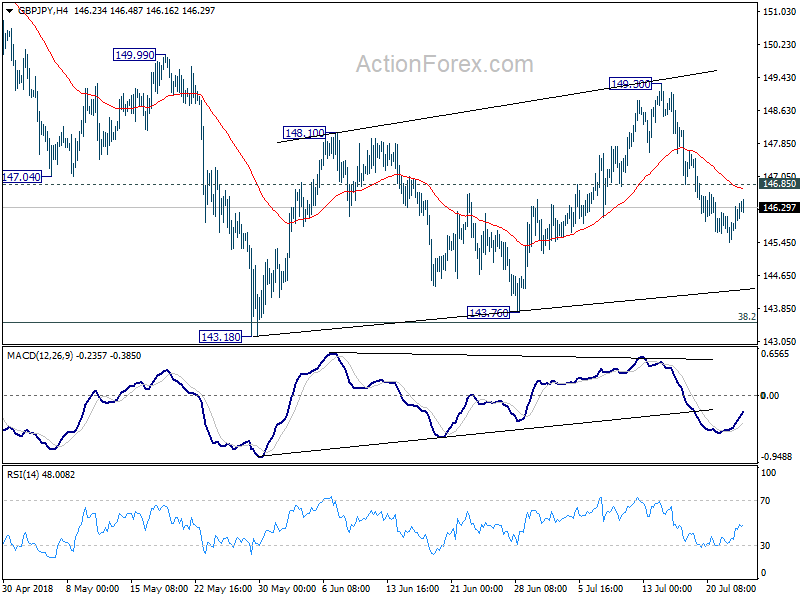
In the bigger picture, no change in the view that decline from 156.59 is a corrective move. In case of another fall, strong support should be seen above 139.29 cluster support (50% retracement of 122.36 to 156.59 at 139.47) to contain downside and bring rebound. Meanwhile, break of 153.84 should confirm that the correction is completed and target 156.59 and above to resume the medium term up trend.
EUR/JPY Daily Outlook
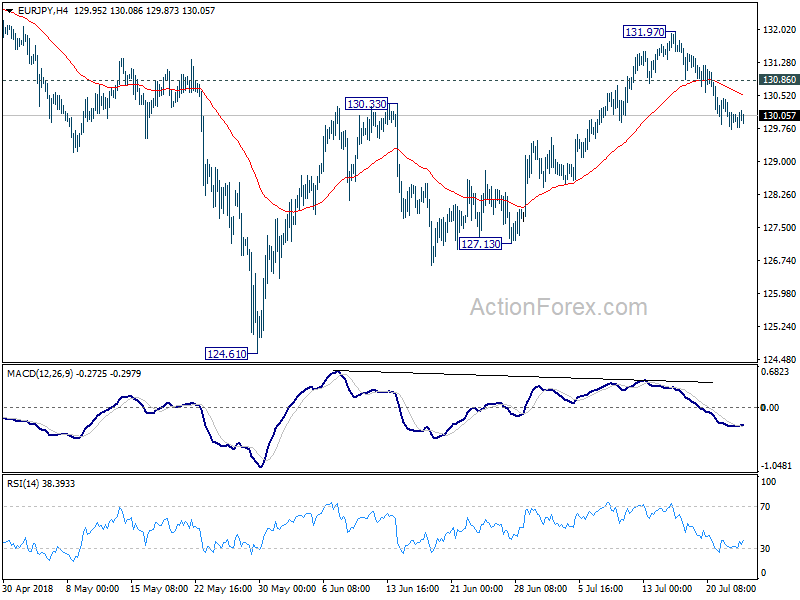
Daily Pivots: (S1) 129.64; (P) 130.01; (R1) 130.28; More....
Intraday bias in EUR/JPY remains mildly on the downside for 127.13 support. The rebound from 124.61 could have completed at 131.97 already. Break of 127.13 will confirm this bearish case and target 124.61 low. On the upside, though, above 130.86 minor resistance will dampen this bearish cas and bring retest of 131.97 instead.
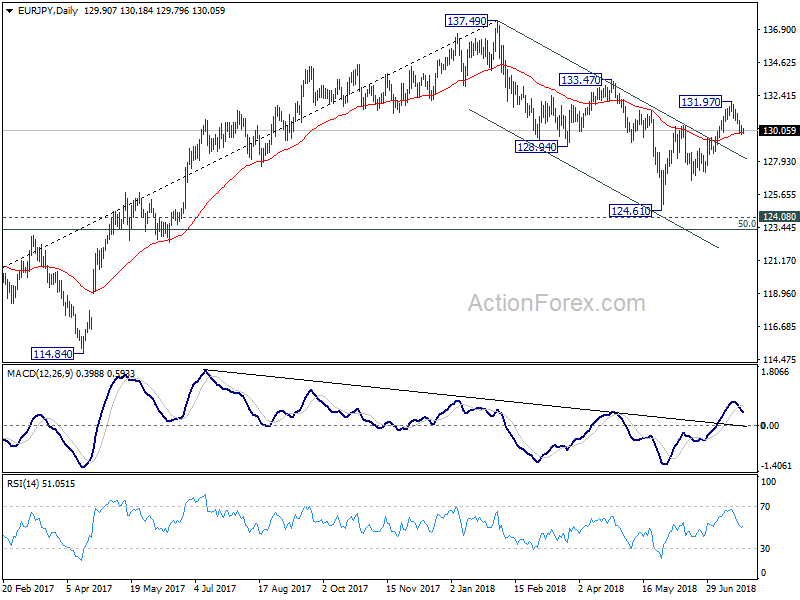
In the bigger picture, the strong break of channel resistance from 137.49 suggests that the decline from there has completed. The three wave structure suggests that it's a correction. With 124.08 key resistance turned support intact, medium term bullishness is also retained. Break of 133.47 will affirm this bullish case and target 137.49 and above. This will now be the favored case as long as 127.13 support holds.
EUR/GBP Daily Outlook
Daily Pivots: (S1) 0.8870; (P) 0.8903; (R1) 0.8921; More...
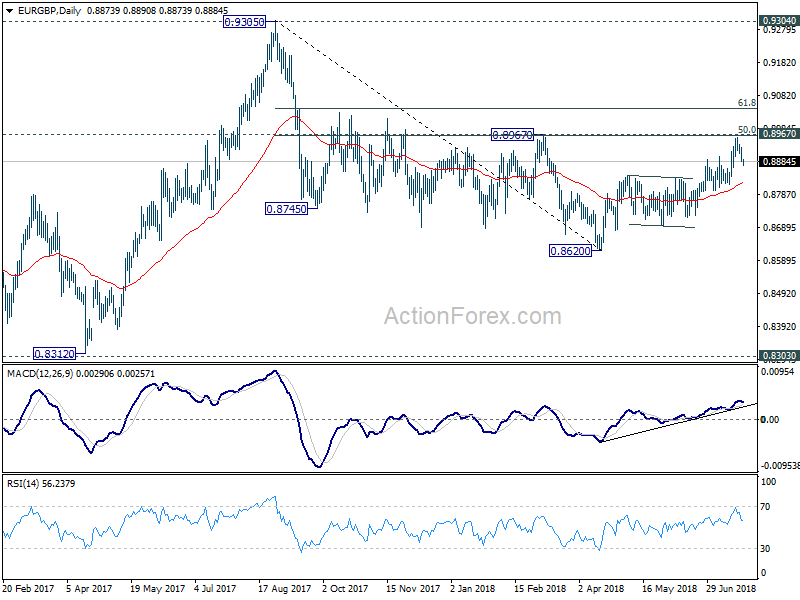
EUR/GBP's pull back from 0.8597 extends lower today but it's staying well above 0.8815 support. Intraday bias remains neutral and further rise is still expected. On the upside, sustained break of 0.8967 cluster resistance (50% retracement of 0.9305 to 0.8620 at 0.8963) should confirm completion of whole decline from 0.9305. EUR/GBP should then target 61.8% retracement at 0.9043 next.
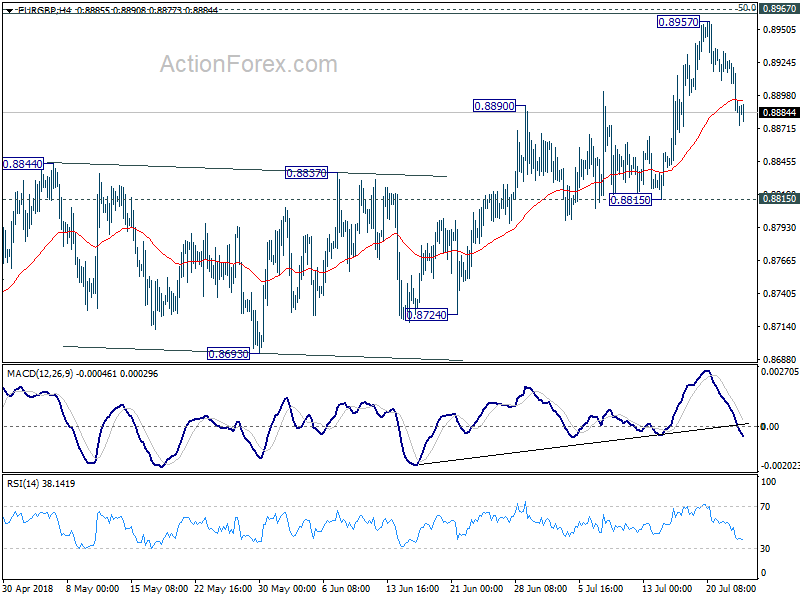
In the bigger picture, EUR/GBP is staying in long term range pattern from 0.9304 (2016 high). The corrective structure of the fall from 0.9305 to 0.8620 is raising the chance that rise from 0.8312 to 0.9305 is an impulsive move. But we're not too confident on it yet. In any case, we'd stay cautious on strong resistance from 0.9304/5 to limit upside in case of further rally. Meanwhile, if there is another medium term decline, strong support will likely be seen from 0.8303 to contain downside.
EUR/AUD Daily Outlook
Daily Pivots: (S1) 1.5705; (P) 1.5789; (R1) 1.5833; More....
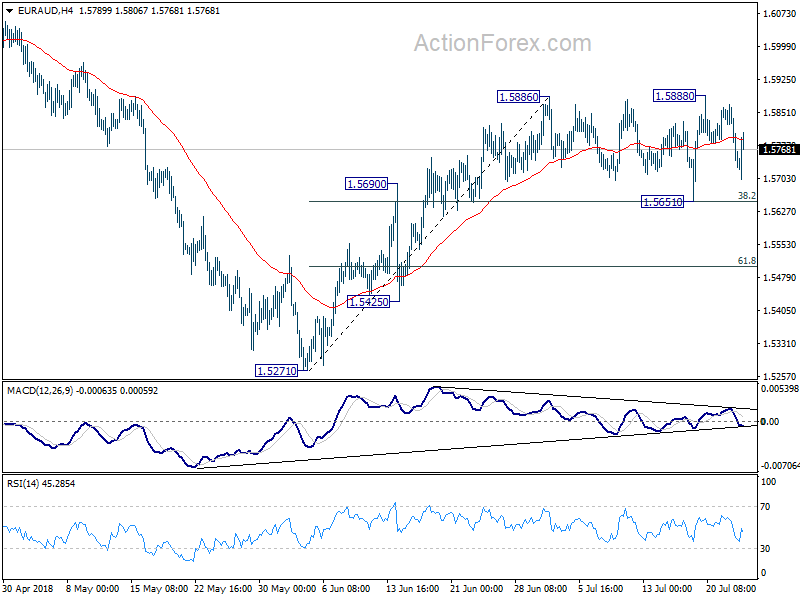
No change in EUR/AUD's outlook as consolidation from 1.5886 is in progress. Intraday bias stays neutral, and with 1.5651 minor support intact, further rise would be seen. On the upside, break of 1.5888 resistance will extend the rally towards 1.6139/89 resistance zone. However, break of 1.5651 cluster support (38.2% retracement of 1.5271 to 1.5886 at 1.5651) will indicate near term reversal and turn bias back to the downside for 1.5271.
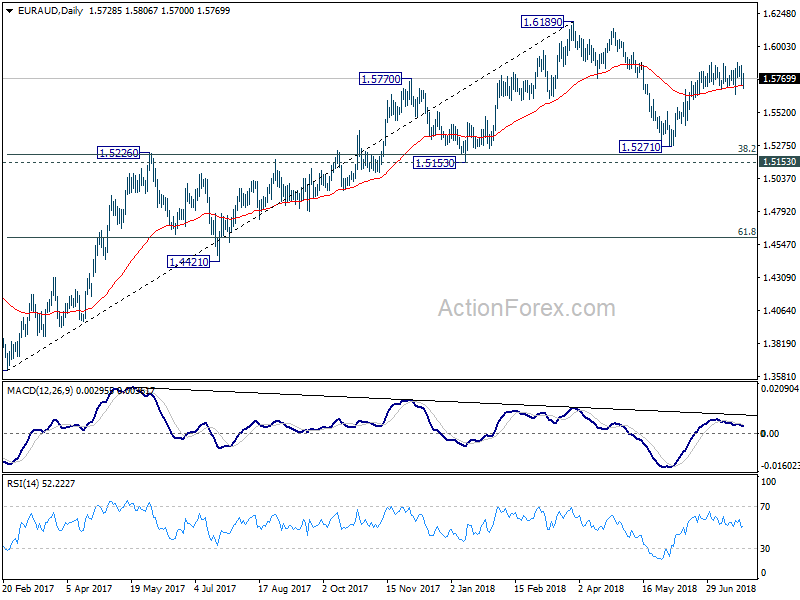
In the bigger picture, current development suggests that fall from 1.6189 is a corrective move and has completed at 1.5271 already. Key support levels of 1.5153 and 38.2% retracement of 1.3624 to 1.6189 at 1.5209 were defended. And medium term rise from 1.3624 (2017 low) is still in progress. Break of 1.6189 will target 1.6587 key resistance (2015 high).
EUR/CHF Daily Outlook
Daily Pivots: (S1) 1.1593; (P) 1.1612; (R1) 1.1629; More...
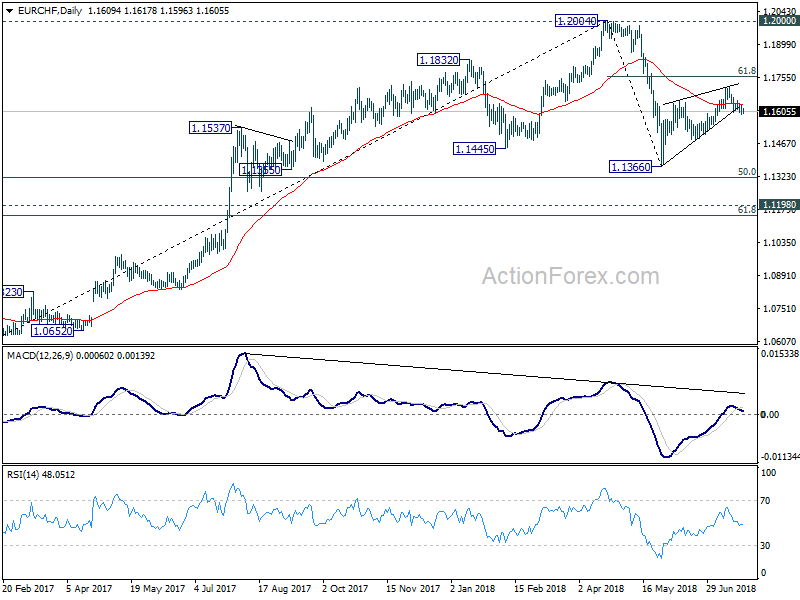
With 1.1653 minor resistance intact, further decline is expected in EUR/CHF for 1.1478 support. We're holding on to the view that corrective rebound from 1.1366 has completed with three waves up to 1.1713 already. Break of 1.1478 will resume the whole decline from 1.2004 through 1.1366 low. On the upside, above 1.1653 minor resistance will bring another rise. But in that case, we'd expect strong resistance from 61.8% retracement of 1.2004 to 1.1366 at 1.1760 to bring near term reversal.
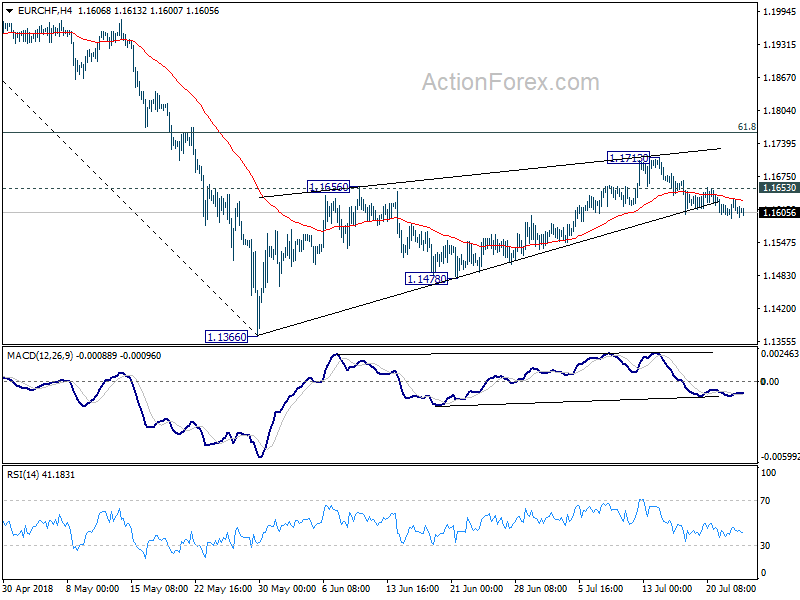
In the bigger picture, 1.2004 is seen as a medium term top with bearish divergence condition in daily and weekly MACD. 1.2000 is also an important resistance level. Hence, the corrective pattern from 1.2004 is expected to extend for a while before completion. We're not anticipating a break of 1.2004 in near term. Another decline cannot be ruled out yet. But in that case, strong support should be seen at 1.1198 (2016 high), 61.8% retracement of 1.0629 to 1.2004 at 1.1154 to contain downside.