Sample Category Title
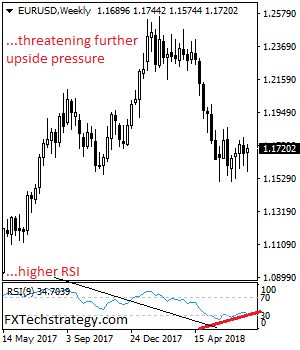
EURUSD – Backs Off Lower Prices, Eyes More Strength
EURUSD - The pair looks to extend its recovery triggered the past week in the new week. On the upside, resistance comes in at 1.1750 level with a cut through here opening the door for more upside towards the 1.1800 level. Further up, resistance lies at the 1.1850 level where a break will expose the 1.1900 level. Conversely, support lies at the 1.1700 level where a violation will aim at the 1.1650 level. A break of here will aim at the 1.1600 level. Below here will open the door for more weakness towards the 1.1550. All in all, EURUSD faces further upside pressure.
GOLD – Rejects Lower Prices, Eyes More Upside
GOLD - The commodity looks to strengthen further after rejecting lower prices the past week. On the downside, support comes in at the 1,220.00 level where a break will turn attention to the 1,210.00 level. Further down, a cut through here will open the door for a move lower towards the 1,200.00 level. Below here if seen could trigger further downside pressure targeting the 1,190.00 level. Conversely, resistance resides at the 1,240.00 level where a break will aim at the 1,250.00 level. A turn above there will expose the 1,260.00 level. Further out, resistance stands at the 1,270.00 level. All in all, GOLD looks to strengthen further.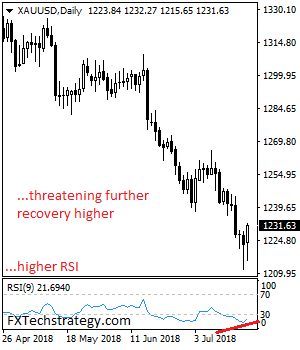
Eco Data 7/23/18
[php_everywhere instance="1"]
Basic Market Structure
While indicators certainly have a place, very little trumps good old fashioned market structure.
As you’ll see demonstrated in the following article, building trading ideas off basic market structure can be surprisingly easy, and more importantly, profitable!
Price movement
As much as we’d all love to see price trade linearly, particularly if one has a position in that direction, it’s just not how the market functions.
As the ocean rises and falls along a shoreline, price action ebbs and flows in a similar manner. This can be observed on any timeframe from as low as the 1 minute chart right up to the monthly scale.
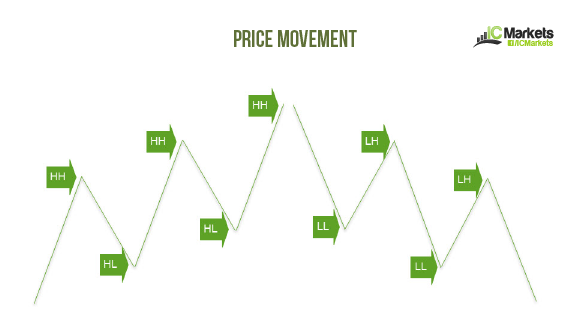
Below is a visual representation of basic market movement, comprised of four key swing points:
- HH – Higher high
- HL – Higher low
- LL – Lower low
- LH – Lower high
On a live chart, however, things are a little more complicated. Between the main swing points one also has to contend with minor-league swing points, which tend to cause confusion. For that reason, you may want to consider minimizing (zooming out from) the charts slightly. You’ll see this in action on the 1 minute chart of the EUR/USD posted below. Notice the clear alternating swings between lower lows and lower highs in motion.
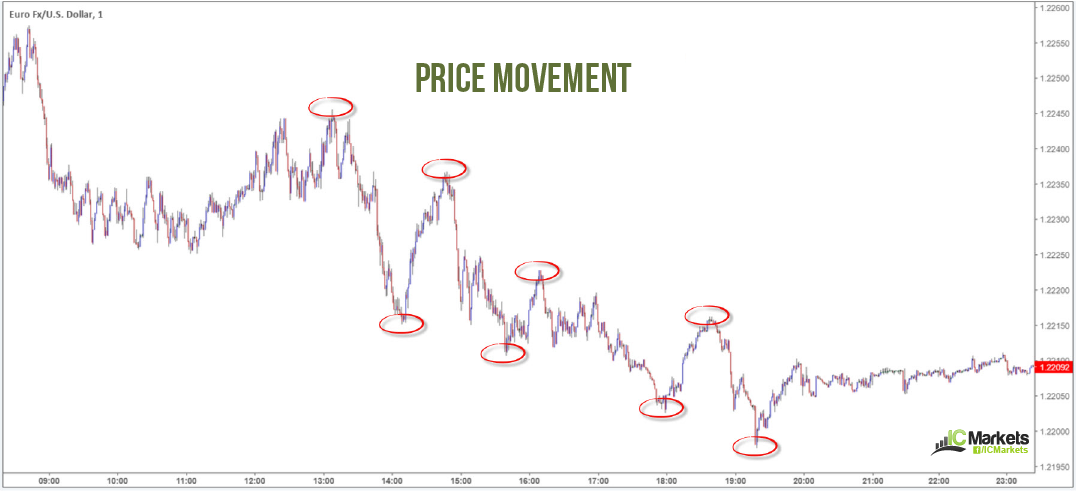
While we may very well see a down trending market on the M1 timeframe, as per above, higher timeframes may (and very commonly do) trend in the opposite direction. This is the fractal nature of the market.
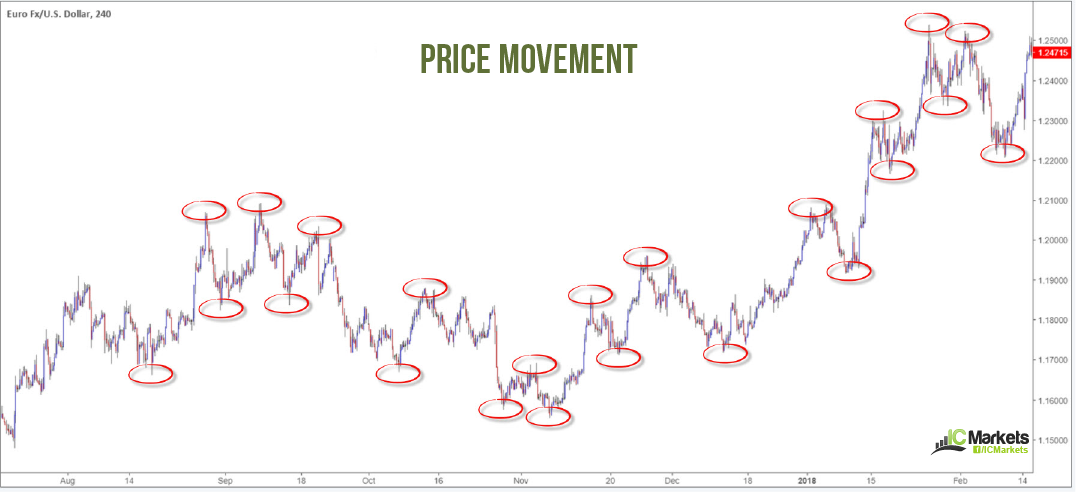
As demonstrated on the EUR/USD H4 chart below we had a brief period of LLs and LHs during September and October. The market, nevertheless, recovered in November and went on to chalk up multiple higher highs and higher lows. Using this structural approach one can identify trending markets.
Using basic structure can I forecast potential trend reversals?
There is NO methodology that can identify a trend reversal 100% of the time. This is impossible!
With that being said, using the basic principles shown above one can accurately determine where the buyers/sellers are gaining strength. This could lead to an eventual trend change.
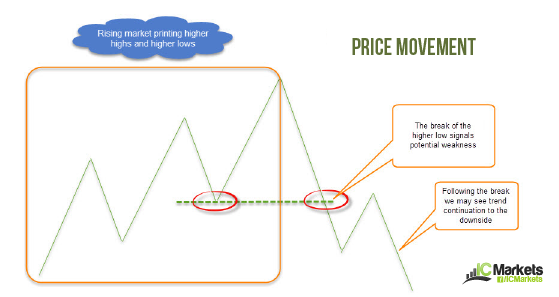
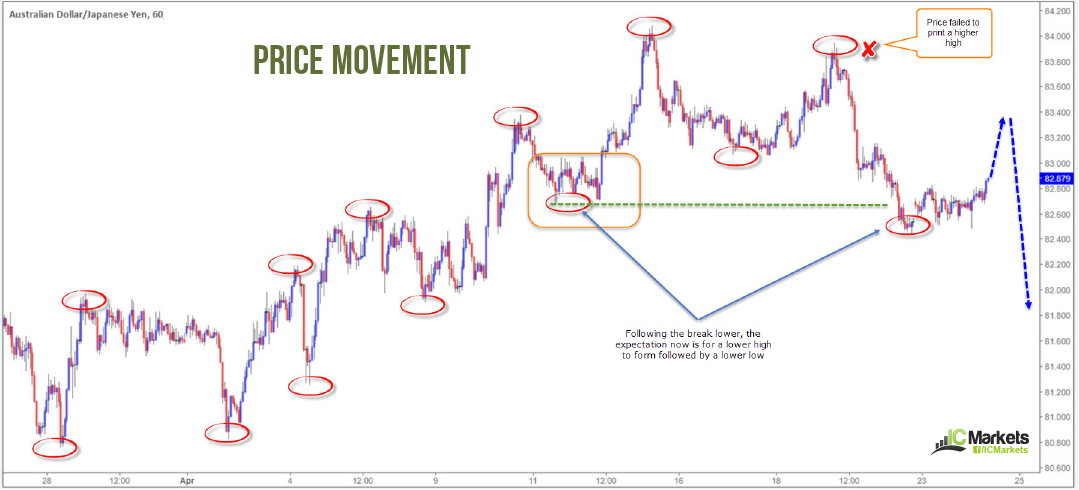
A market that’s pencilling in a series of higher highs and higher lows (referred to as an uptrend) will generally attract buyers looking to join this trending movement, and rightly so. But what happens when a higher low is unable to sustain its upside presence and drops lower, printing a lower low? This can be interpreted as a possible trend change to the downside (referred to as a downtrend). Here’s a pre-drawn image to show what we mean:
And here’s the same formation on a live chart of the H1 AUD/JPY:
How can I take advantage of this movement?
There are a myriad of ways one can use this knowledge to their advantage, but let’s remember that it all begins with basic market structure and builds from there. Here are a couple of methods one could potentially consider:
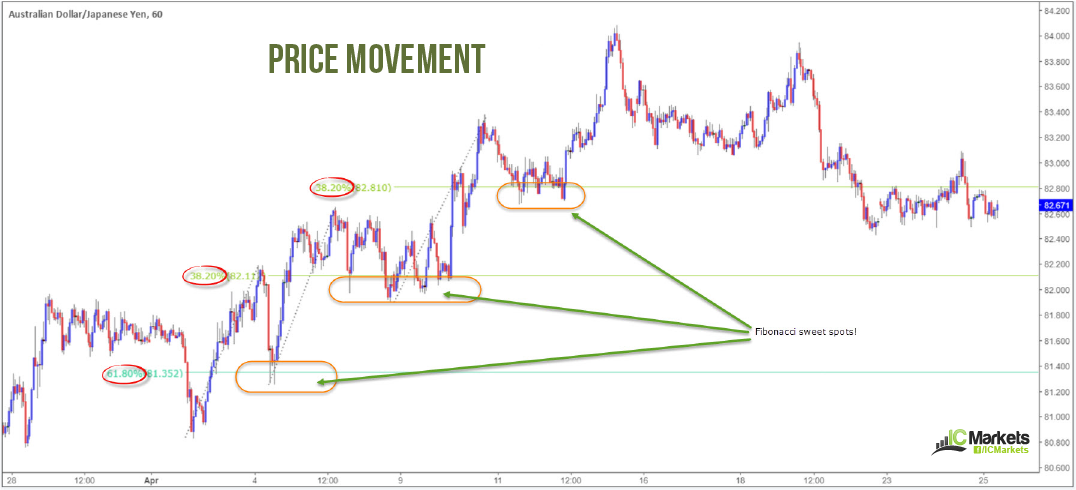
- In terms of a rising market, one will naturally expect price to pullback and eventually form a higher low. Knowing this, initiating long positions in-line with market structure at Fibonacci sweet spots could be an option. For those of you who do not know, Fib sweet spots, in our technical book, are the 61.8% and 38.2% values. Using the same chart posted above (AUD/JPY H1), notice how on the pullbacks both of these Fib values played key roles in supporting the market before probing higher:
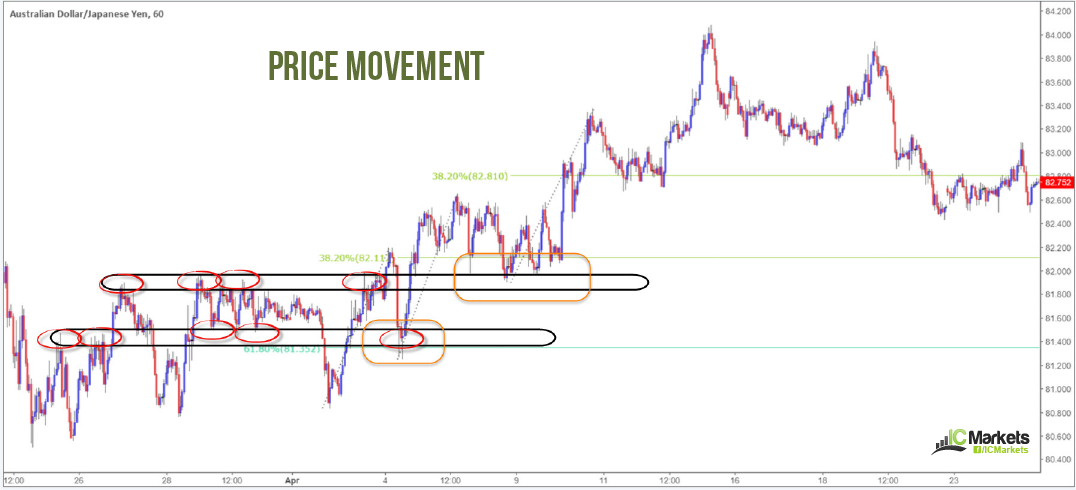
- Using the same chart one could also look to combine Fib sweet spots with support/resistance zones. We touch on this concept here: Support and Resistance. On the chart below, we demonstrate the effectiveness of fusing support and resistance areas with basic market structure and Fibonacci points. In regard to the upper level, however, we were unable to pin point any form of support and resistance, only a Fib support. Despite this, as you can see, we have clearly identified three potential buy zones, built off basic market structure.
Is it worth focusing on basic structure?
It certainly is!
Mapping out your charts and basing trading ideas off of market structure is an incredibly organized approach to trading the markets.
Give it a try! You may be surprised how simple it really can be.
Do You REALLY Have What it Takes to be a Successful Forex Trader?
Trading any market consistently is difficult. It tests you in ways you’ve not likely been tested before, with the majority failing to achieve their goals.
So what separates the successful traders from the pack?
In essence, it boils down to clear planning, correct education and strong will power. Devoid of these three elements, aspiring traders will, without question, struggle and eventually quit.
Learning new skills
To trade consistently, several skills require mastering.
- Analytical skills are necessary components to help navigate the markets and pin down high-probability trading opportunities. A large majority of retail trading decisions are based off technical analysis. Successful (technical) traders have developed an ‘eye’ for the charts, which, for many of us, can take years to achieve.
- Attention to detail is paramount. Accomplished traders have the ability to hone in on actionable data. In other words, they choose information wisely as it’s easy to get caught up in the media circus.
- Mastery of one’s mind is probably the most important skill a trader develops. The randomness/probability sphere turns the world upside down for the hunter-gatherer part of our brain. The emotional aspect of this business is, undeniably, the toughest hurdle between aspiring traders and consistent success. A lot of educators unfortunately fail to address this section fully.
- Patience and discipline are two essential inner traits efficient traders possess. The discipline to not deviate from your trading plan and remain focused on the task at hand is crucial.
This is by no mean an exhaustive list, nor a guarantee for success, but it does highlight specifically important skills one should master if they want to accomplish success.
It’s a business – NOT a hobby!
Treat trading as a hobby and it will highly likely pay you as a hobby.
Trading is a serious business and should always be treated as such, be it a part-time venture or as one’s day job. If you intend on using the markets as a place for amusement or somewhere to have a bet every now and then, you may as well throw whatever funds you have in your account in the garbage. Better still; send it to a noteworthy charity!
Successful traders view trading as a business, with detailed strategies, firm money management and strict risk control. For that reason, if you truly want to trade alongside the best, you’re going to have to approach trading in the correct manner!
If we think about it rationally, can you imagine a doctor, lawyer or businessman approaching day-to-day business as a hobby? Very unlikely! So, why should it be any different for trading?
Being wrong and losing money
How many of us truly like admitting we’re wrong? Couple this emotion with losing money and you have yourself a double whammy of hurt!
However, it is simply not a matter of pain and distress, since losses tend to be the catalyst that pushes some to make financially fatal mistakes – think revenge trading. This can exacerbate losses, creating a vicious spiral in which the trader’s account becomes out of control.
Winning traders are cognizant of this hazard. A loss is simply that – a loss. They know losing trades are an inevitable expense.
Temptation
Having the discipline to CONTROL oneself is an integral part of a profitable trader’s character. Rules are NOT to be broken in this business. Following your strategy and taking clear setups in accordance with its rules is critical.
The FX market is a continuous flow of temptation, offering numerous opportunities to break one’s trading rules. Having the patience and discipline to pass on these enticements will make or break you, PERIOD.
Becoming a consistent trader
Reaching a level of proficiency in this business will NOT happen overnight.
Enrolling in a weekend course and expecting to trade successfully is almost comical.
Profitable trading will take time, study and practice.
To get started, look to select one method (for example, one that is price action based) and master this. Jumping from method to method will waste time and energy, and will likely end with you throwing in the towel and becoming another losing statistic. If the method you focus on continues to fail after 4-6 months, then consider moving on. But give it a chance to work. Remember, one, two or even three consecutive losses means absolutely NOTHING considering you’ll likely be taking at least 100 trades in any given year!
Trading successfully IS POSSIBLE. But a high chance of success, just like anything, depends on how much you want it.
Sometimes the Best Position is NO Position
At first glance, this may seem inefficacious. As a trader, you engage with the market to profit and the only way to achieve this is to trade! We get that.
However, there are times that remaining on the side lines may be the more fitting pathway to take. So, what are the signs we look for to indicate that it could be time to step back?
Personal life CAN affect your trading ability:
- Trading when under emotional strain can seriously affect the way traders interpret the market. A recent death in the family, for example, can unlock a wide and confusing range of emotions. Denial, disbelief, anger and depressed moods, to name but a few. Interacting with the market under these settings frequently lead to disastrous consequences. For that reason, during times of emotional stress it is commonly advised to try and avoid trading with live funds.
- Distractions. Every profession requires focus to some degree or another. Some jobs are inherently tougher than others and need greater focus. No matter what the profession, though, battling distractions and focusing on the task at hand is an implicit requirement.
Limiting distractions during trading is crucial. As an example, let’s imagine Harry the trader is watching the 1.2050 support level on the EUR/USD, and has been for the past hour. The telephone rings, which is conveniently located downstairs, and he leaves his desk to answer it. In those five minutes he was on the phone, price tested and bounced from 1.2050. He’s now faced with a dilemma: chase price which is currently trading at 1.2057, or pass on the setup knowing he’s missed a perfectly good opportunity.
Another incontrovertible distraction is social media. Not only does it divert your focus from what’s important, it can also alter your decisions based on other opinions.
The good news, however, is these are aspects you have some degree of control over and can rectify with discipline. Market-related reasons, on the other hand, are more of a challenge. These tend to be external in which you have little to no control.
Market-related reasons for possibly staying on the side lines:
- Economic news. In most cases, executing technical trades immediately before or after high-impacting news events is a recipe for disaster. In periods of extreme volatility price can jump (gap) in either direction in response to an economic event. Unless you’ve accepted this risk, steer clear of trading before or directly after news. Let the dust settle and then reassess the situation. The majority of economic calendars highlight important events to be aware of: Forex News and Calendar
- Central bank movement. Central banks are tasked with the mission of overseeing the monetary system of a nation, or a group of nations. Members of the banks often interact with media and attend events. Frequently, the banks script their speeches, but there are also plenty of times when they may say something unexpected, consequently jolting markets across the board. These can develop into huge currency movers, easily clearing out several technical levels in the process. Luckily, central bank interactions are generally scheduled on one’s economic calendar.
- Bank holidays. Commercial banks are major players in the currency market. They facilitate the majority of the trading volume. When these banks close in observance of bank holidays the market is less liquid. This can lead to both abnormally low and high volatility. It is advisable to avoid currencies associated with banks that are closed, as price action will typically not follow its normal pattern, thus likely offering unfavourable trading conditions.
- Weekend trading. Unless a long-term strategy is employed, which tends to involve holding trades for weeks, months and sometimes even years, leaving trades open over the weekend can potentially be extremely damaging, in the shape of an aggressive opening weekend gap in price.
A lot can happen over the weekend! All it takes is one disaster to strike and an account could be wiped out. Intraday traders should not have this concern given most of the trades are liquidated by the day’s close. However, concerning a swing trading approach, it’s down to the individual trader to decide whether it is really worth leaving active positions open over the weekend. Remember, always, always trade in your OWN best interests.
Final words…
If you are not feeling on top of your game, never feel bad about taking a seat on the side line. It is far better to miss a setup than to risk an emotional meltdown.
EUR/USD Weekly Outlook
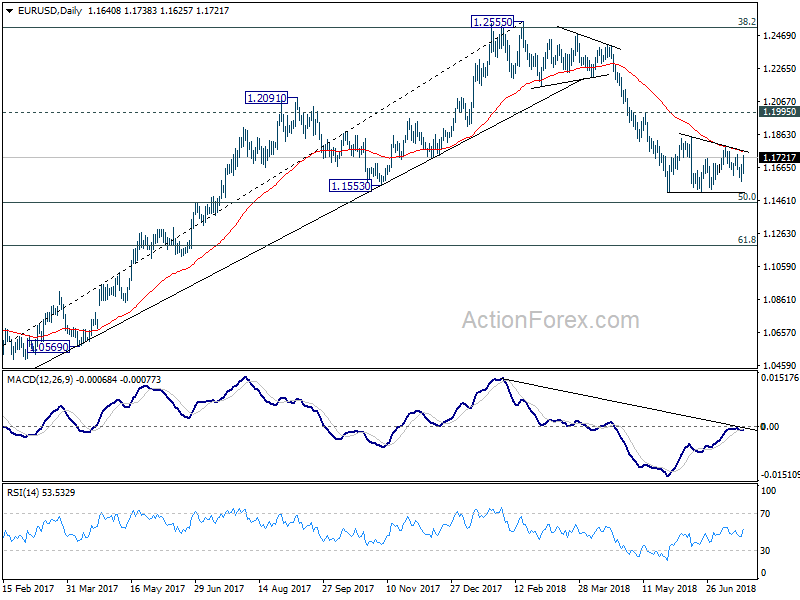
EUR/USD gyrated lower to 1.1574 last week but recovered from there. The pair is staying in the consolidation that started back in 1.1509. Initial bias is neutral this week first. Above 1.1790 resistance will bring stronger rebound. But we'd expect strong resistance from 1.1851 to limit upside. On the downside, firm break of 1.1507 will resume larger down trend through 50% retracement of 1.0339 to 1.2555 at 1.1447
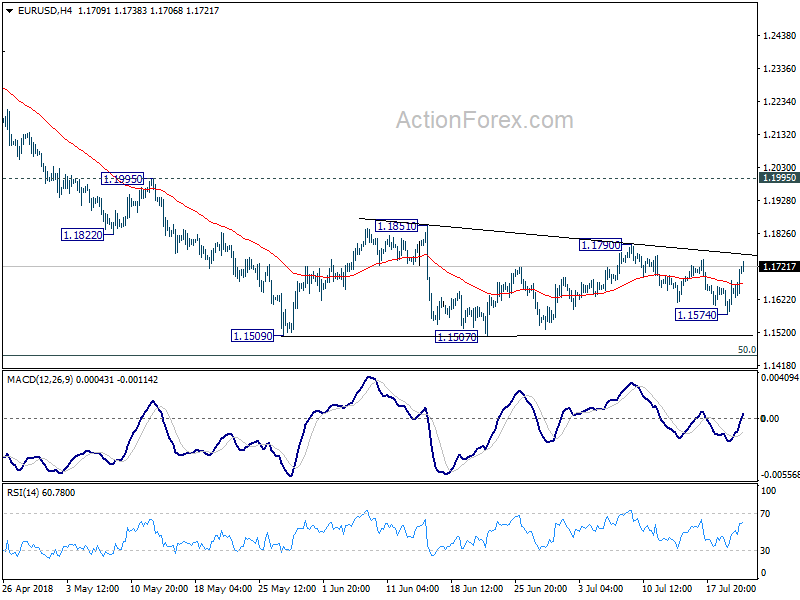
In the bigger picture, EUR/USD was rejected by 38.2% retracement of 1.6039 (2008 high) to 1.0339 (2017 low) at 1.2516. And, a medium term top was formed at 1.2555 already. Decline from there should extend further to 61.8% retracement of 1.0339 to 1.2555 at 1.1186 and below. For now, even in case of rebound, we won't consider the fall from 1.2555 as finished as long as 1.1995 resistance holds.
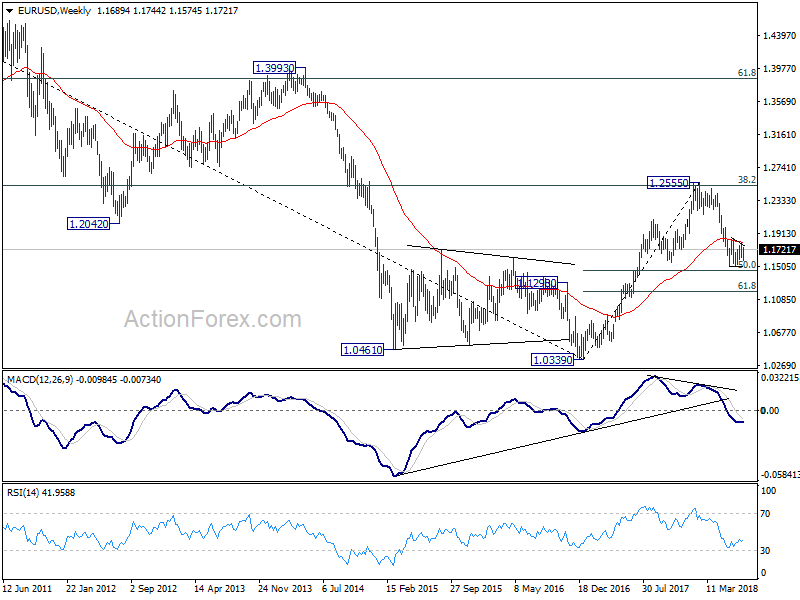
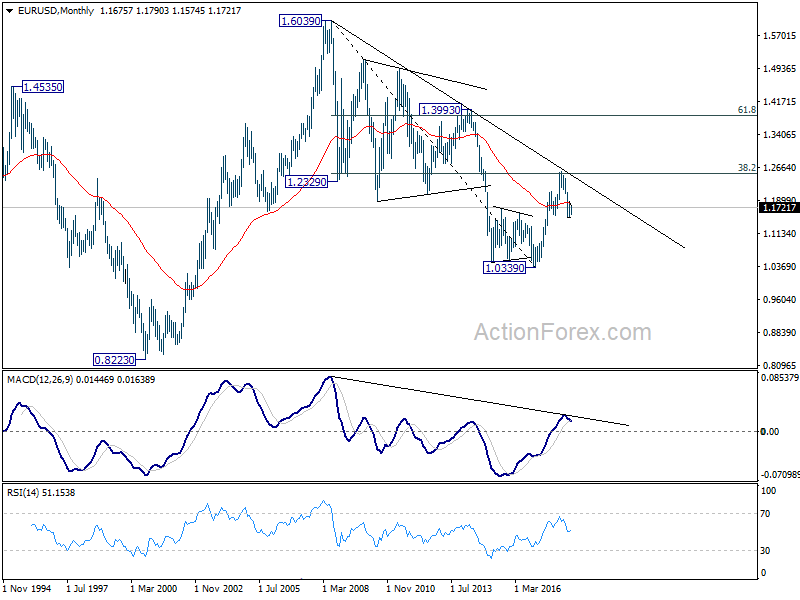
In the long term picture, the rejection from 38.2% retracement of 1.6039 to 1.0339 at 1.2516 argues that long term down trend from 1.6039 (2008 high) might not be over yet. EUR/USD is also held below decade long trend line resistance. Focus will now turn to 1.1553 support. Sustained break there would raise the chance of retesting 1.0339 low. It's early to tell, but the chance of long term bullish reversal is fading.
USD/JPY Weekly Outlook
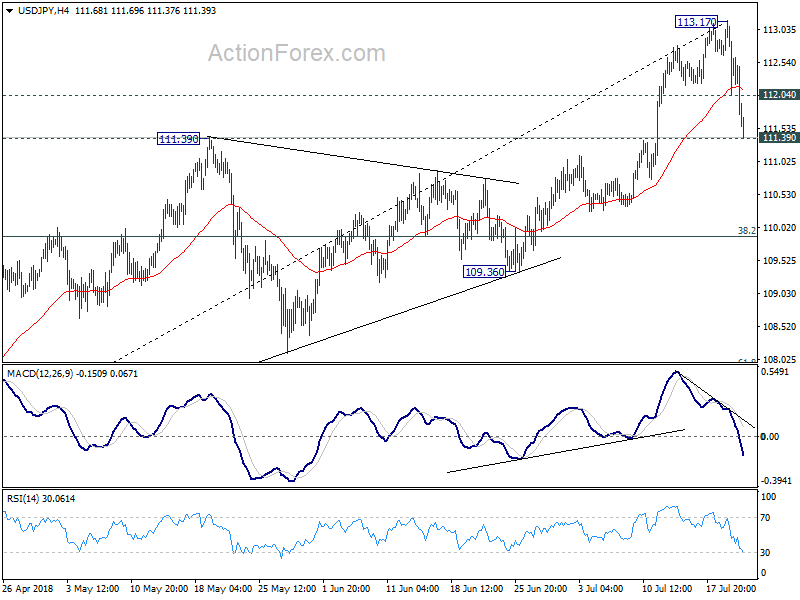
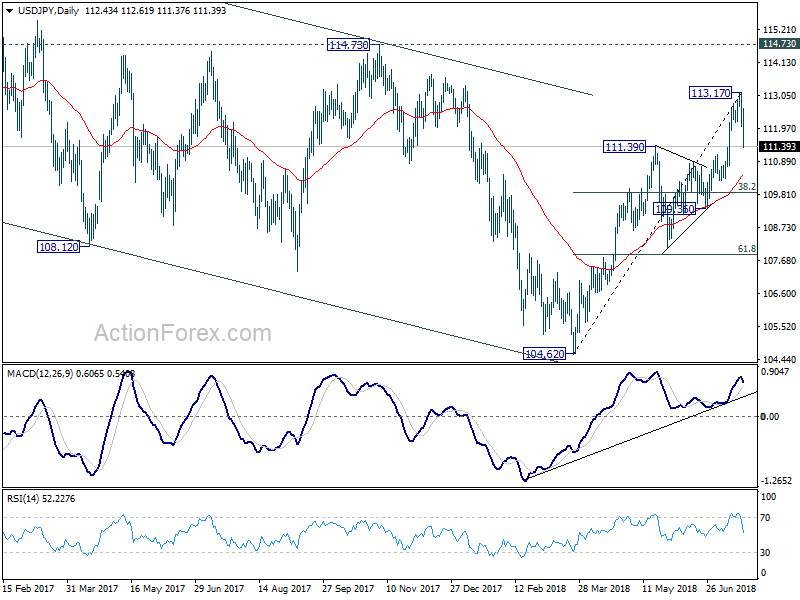
USD/JPY edged higher to 113.17 last week but subsequent sharp fall indicates short term topping. Breach of 111.39 resistance turn support argues that it's now corrective whole rise fro 104.62. Initial bias remains on the downside this week for 55 day EMA (now at 110.39). We'd expect strong support from 38.2% retracement of 104.62 to 113.17 at 109..90 to contain downside and bring rebound. On the upside, above 112.04 minor resistance will turn intraday bias neutral first. But break of 113.17 is needed to confirm up trend resumption. Otherwise, more condition would be seen with risk of another fall.
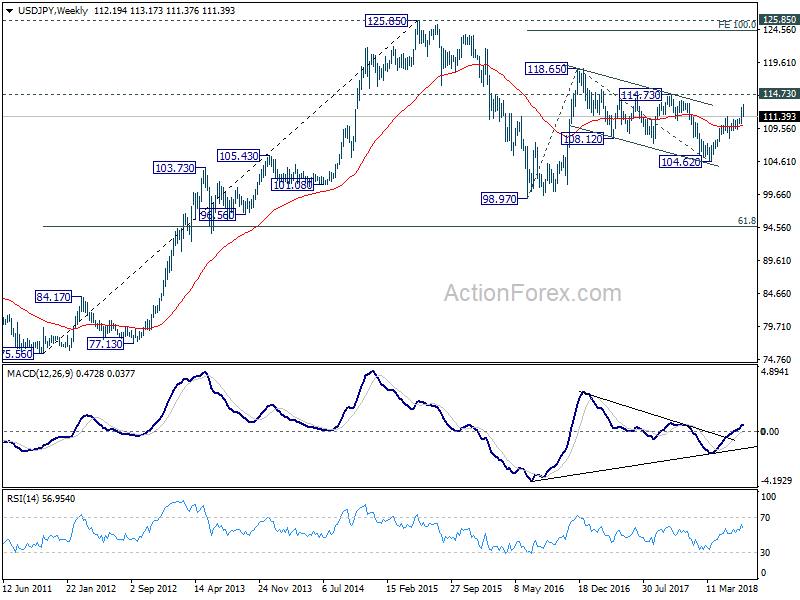
In the bigger picture, corrective fall from 118.65 (2016 high) should have completed with three waves down to 104.62. Decisive break of 114.73 resistance will likely resume whole rally from 98.97 (2016 low) to 100% projection of 98.97 to 118.65 from 104.62 at 124.30, which is reasonably close to 125.85 (2015 high). This will now be the preferred case as long as 109.36 support holds.
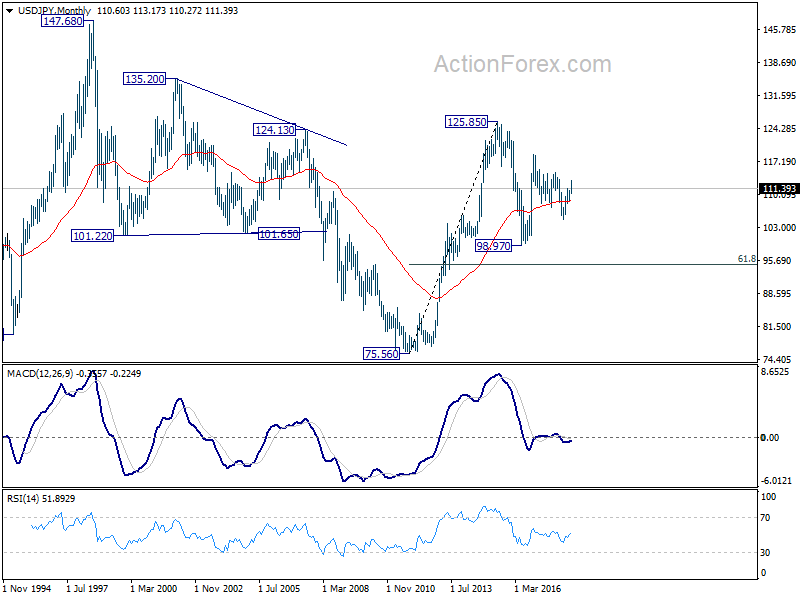
In the long term picture, the rise from 75.56 (2011 low) long term bottom to 125.85 top is viewed as an impulsive move, no change in this view. Price actions from 125.85 are seen as a corrective move which could still extend. In case of deeper fall, downside should be contained by 61.8% retracement of 75.56 to 125.85 at 94.77. Up trend from 75.56 is expected to resume at a later stage for above 135.20/147.68 resistance zone.
GBP/USD Weekly Outlook
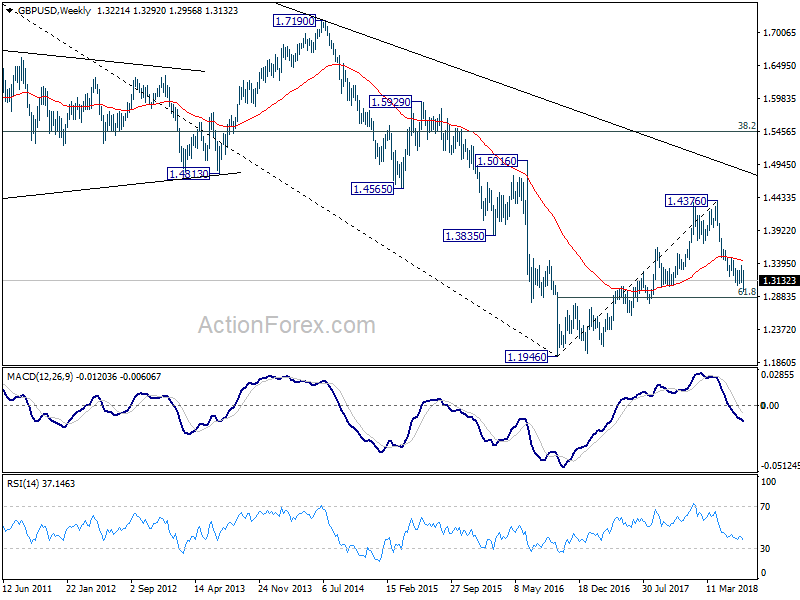
GBP/USD's downside resumed and extended to as low as 1.2956 last week. But subsequent rebound suggests short term bottoming there. Initial bias is neutral this week for some more consolidations first. Stronger recovery could be seen but upside should be limited below 1.3362 resistance to bring fall resumption. On the downside, break of 1.2956 will resume the fall from 1.4376 to 1.2874 fibonacci level
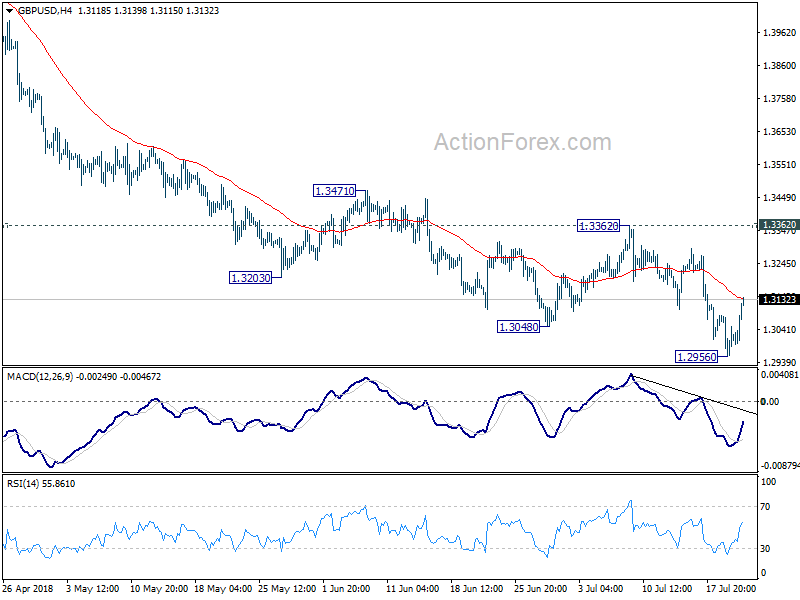
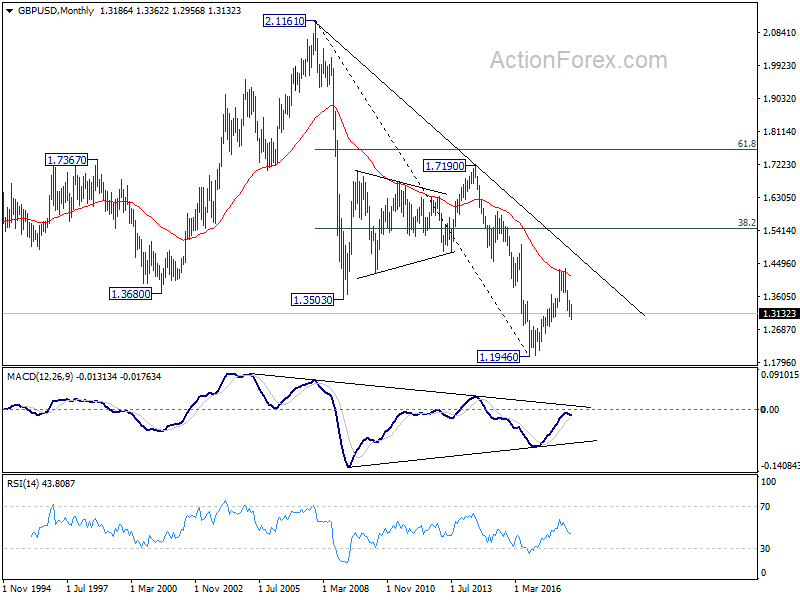
In the bigger picture, whole medium term rebound from 1.1946 (2016 low) should have completed at 1.4376 already, after rejection from 55 month EMA (now at 1.4179). Fall from 1.4376 should extend to 61.8% retracement of 1.1946 (2016 low) to 1.4376 at 1.2874 next. Decisive break of 1.2874 will raise the chance of long term down trend resumption through 1.1946 low. On the upside, break of 1.3362 resistance is needed to be the first indication of medium term bottoming. Otherwise, outlook will remain bearish even in case of strong rebound.
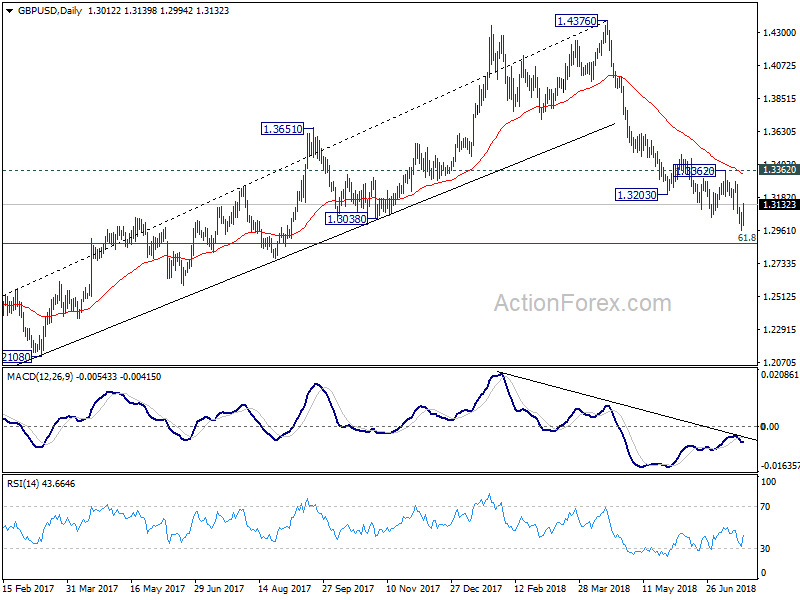
In the longer term picture, rise from 1.1946 (2016 low) is viewed as a corrective move, no change in this view. Rejection from 55 month EMA argues that it might be completed already. Larger down trend from 2.1161 (2007 high) could extend to a new low. This will now be the preferred case as long as 1.4376 resistance holds.
USD/CHF Weekly Outlook
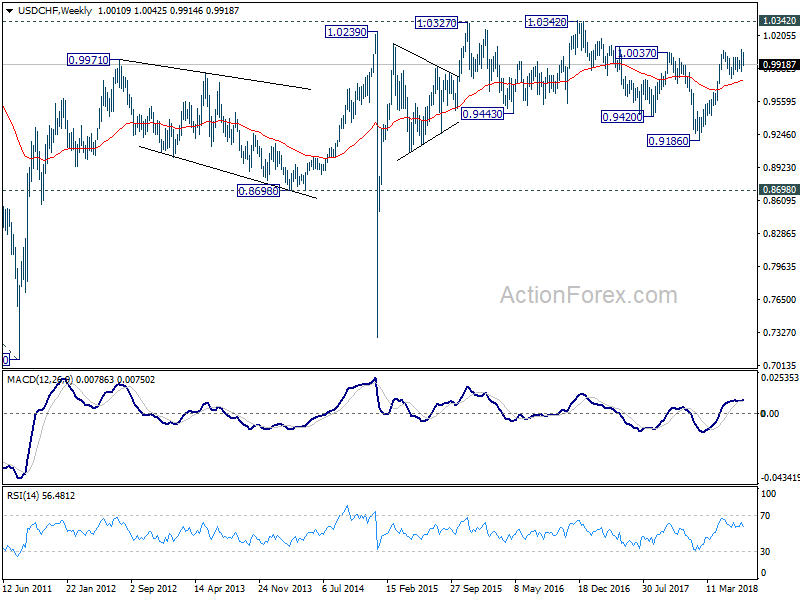
USD/CHF's steep decline last week suggested that, at least, USD/CHF is not ready for rally resumption yet. Initial bias is mildly on the downside this week for 0.9856 support first. Break there will pave the way to key support level at 0.9787. On the upside, above 0.9957 minor resistance will turn intraday bias neutral first.
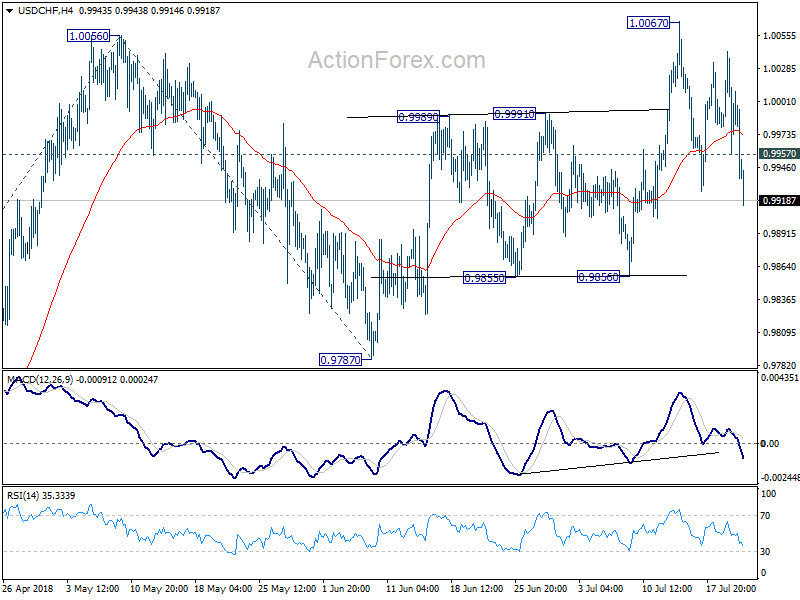
In the bigger picture, as long as 0.9787 support holds, we're still favoring the bullish case. That is, rise fro 0.9787 is resuming the whole up trend from 0.9186 and should target 1.0342 key resistance on resumption. However, break of 0.9787 will indicate medium term reversal and turn outlook bearish.
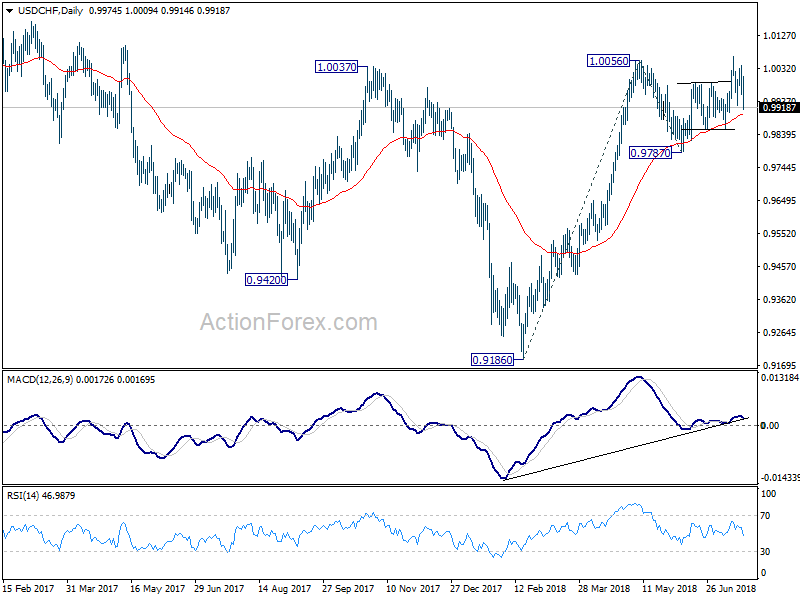
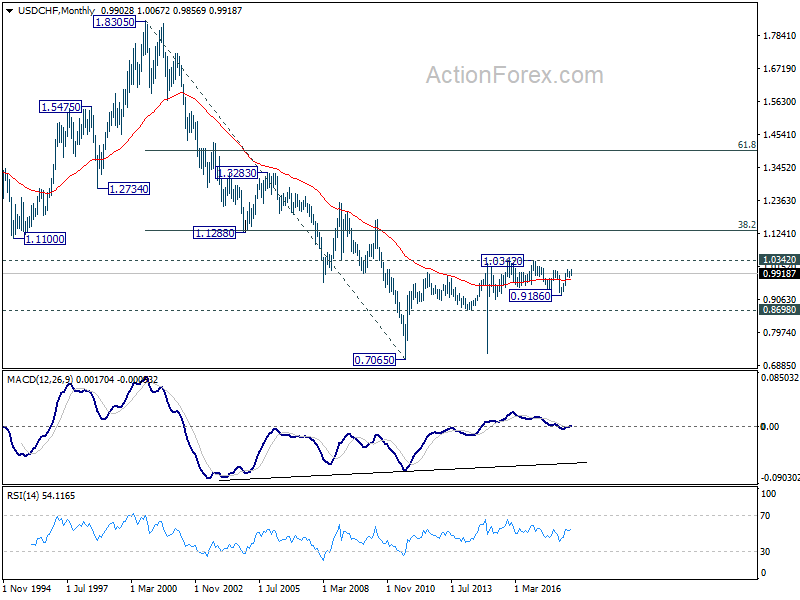
In the long term picture, price actions from 0.7065 (2011 low) are not clearly impulsive yet. Thus, we'll treat it as developing into a corrective pattern, at least, until a firm break of 1.0342 resistance.