

Sample Category Title
The Weekly Bottom Line: Happy-Go-Lucky Fed Presses On With Rate Hikes
U.S. Highlights
- Economic data was a mixed bag this week: retail sales were a bright spot, but housing starts unexpectedly plunged in June.
- Trade developments continued to make headlines, with Donald Trump announcing he was prepared to extend duties on $500bn of imports from China – roughly the value of all China's imports into the U.S.
- In his testimony to Congress, Fed Chair Powell offered an upbeat view of the U.S. economy, and noted that the risks posed by trade protectionism would not push them off course on further rate hikes.
Canadian Highlights
- It was a good week for Canadian data releases, with positive surprises in retail, manufacturing, and housing, affirming last week's upbeat tone set by the Bank of Canada.
- Existing home sales were particularly positive, and, taken together with last week's housing starts, support the view that the housing market is gradually stabilizing following the implementation of B-20 guidelines.
- The U.S. announced that it will probe tariffs on uranium imports, increasing already-heightened global trade uncertainty risks.
U.S. - Happy-Go-Lucky Fed Presses On With Rate Hikes
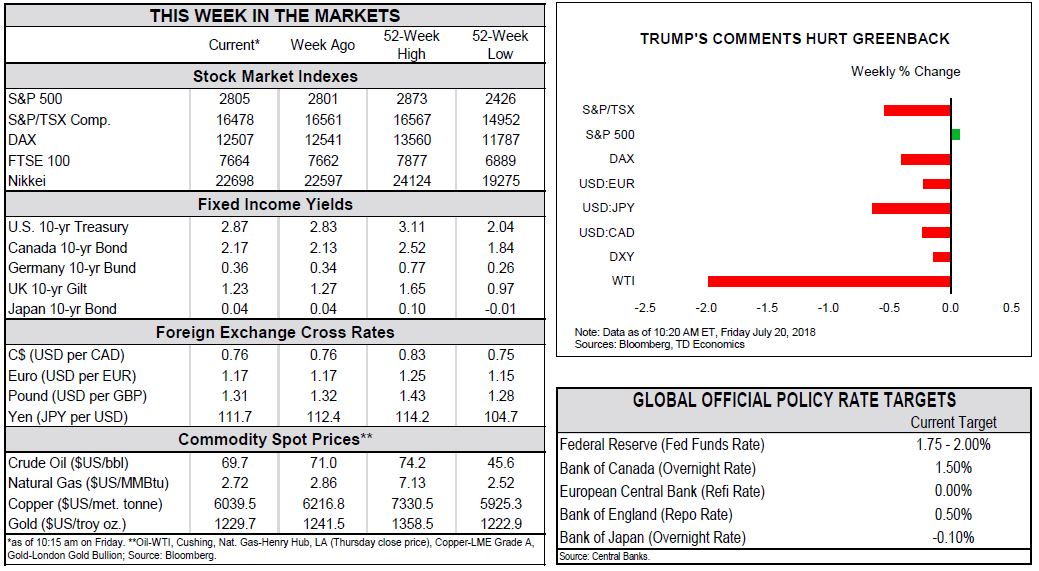
Economic data was a mixed bag this week. While May's retail sales were a bright spot, housing starts unexpectedly plunged in June. Trade policy developments also remained top of investors' minds: Angela Merkel spoke strongly against tariffs, while Donald Trump ramped up his protectionist rhetoric, saying he was prepared to extend duties on the full $500bn of imports from China. He also criticized the Fed's interest rate hikes, and the strong U.S. dollar – leading to modest greenback selloff.
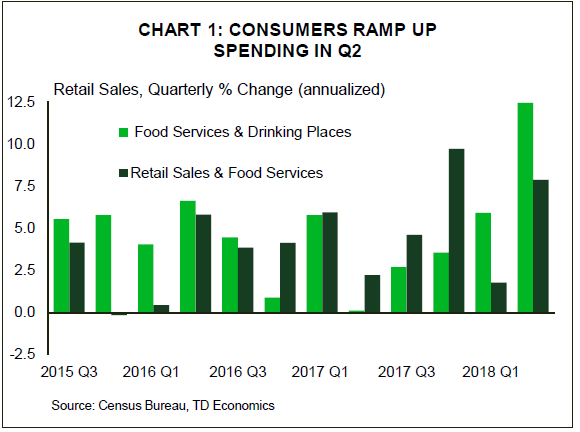
While the threat of further trade tariffs continues to pose a substantial downside risk to U.S. and global growth, for the time being the U.S. economy is moving full steam ahead. In June, retail spending rose by a robust 0.5%, on top of a substantial upgrade to May's data, as consumers continued to hit stores and restaurants in masses. One of the categories that saw strong growth was spending on restaurants and eating out (+1.5% m/m), accelerating to 8% y/y – the fastest pace since August 2015. The pickup in spending in this largely-discretionary category is a testament to strong momentum in consumer spending. Indeed, for the second quarter as a whole, nominal retail sales were up nearly 8% annualized (versus 1.8% in Q1) (Chart 1), suggesting that even adjusting for inflation, second quarter consumer spending is set to come in above 3% (annualized) in next week's GDP release.
The upbeat view of the domestic economy was further echoed by Fed Chair Powell this week. In his semi-annual testimony to Congress he noted the strong labor market, rising after-tax incomes, and healthy growth in business investment. He also praised progress on the inflation front, and somewhat downplayed the risk stemming from trade protectionism noting that "the risks to the outlook were roughly balanced". He concluded, that "the FOMC believes that, for now, the best way forward is to keep gradually raising the federal funds rate." In other words, current trade risks are not enough to derail the Fed from hiking rates on a quarterly basis.
The U.S. economy continues to be red-hot, but this pace of expansion will be hard to sustain going forward as it starts to bump against capacity constraints, particularly on the labor front. Higher material prices, wages and shortages of labor in some sectors featured prominently in the latest Beige Book.
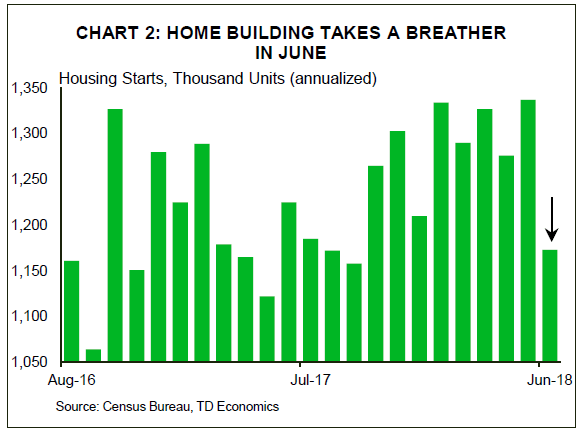
The construction industry is one sector facing these headwinds, with prices of lumber and steel rising precipitously following the tariffs. While homebuilders' optimism remains quite high, housing starts fell by 12.3% m/m in June – the largest decline since November 2011. (Chart 2). The bulk of the pullback was seen on the multifamily side (-20% m/m), with more moderate decline in single-family starts (- 9.1%). The large decline on the multifamily side could be reflective of the changing housing market dynamics, with demand rotating away from rental units. Next week's release of both new and existing home sales should shed more light on the health of the housing market, particularly on the demand side.
Canada - Positive Data Releases Point to a Solid Q2
This was a good week for Canadian data, with releases on manufacturing, retail, and existing home sales, as well as consumer price inflation all surprising on the upside.
Existing home sales kicked off the release schedule, moving up 4.1% in June, with the relatively broad-based increase erasing much of the losses in the previous month. Taken together with last week's housing starts release, this confirms expectations of a stabilizing housing market following the implementation of B-20 guidelines.
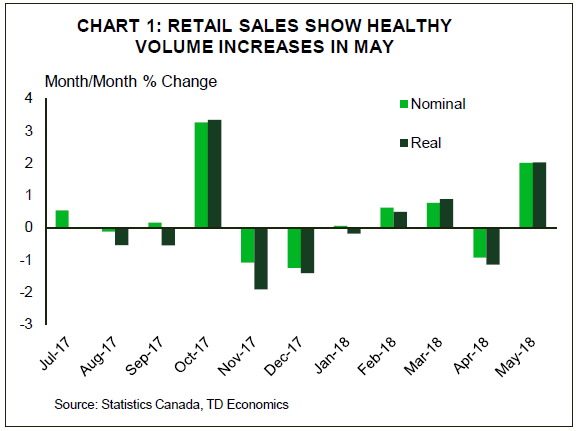
Manufacturing sales also showed a broad-based rebound of 1.4% in May, offsetting April's disappointing performance. Even more encouraging, retail sales growth came in at 2.0% for May, significantly exceeding expectations and suggesting healthy wage gains are making their way into household spending. With retail and manufacturing sales recently subjected to one-off factors (weather, temporary refinery outages), this paints a reassuringly healthy picture of their underlying trend this quarter.
Finally, CPI came in slightly above expectations as headline inflation accelerated to 2.5% (year-on-year) from 2.3% in May – the fastest pace since early 2012. The average of the Bank of Canada's core measures, meanwhile, remained at its 2.0% target. The CPI-Common core measure held steady at 1.9%, while the other two core measures edged up to 2.0% (from 1.9% previously).
All told, the data this week paint a positive picture of Canadian economic growth, and support the notion that activity is bouncing back from its soft performance early in the year. Indeed, with the releases this week, we anticipate real GDP growth to advance at a solid 2.9% in the second quarter, in line with the Bank of Canada's recently-updated forecast.
The case for cautiousness on further rate hikes continues to lie in the risk management framework of Governor Poloz. As long as the threat of a further escalation of trade wars looms on the horizon, we expect the Bank to keep the pace of hikes very gradual.
Accentuating lingering trade uncertainties was an announcement from the United States Commerce Department this week, of a probe into uranium imports using the same national security lens used to justify tariffs on steel and aluminum. With the potentially impacted value of goods at 0.2% of the country's total merchandise goods exports, its magnitude comes in at less than those already imposed on steel and aluminum, and much less than the more worrying auto tariff investigations. If implemented, however, their effects would be more regionally concentrated.
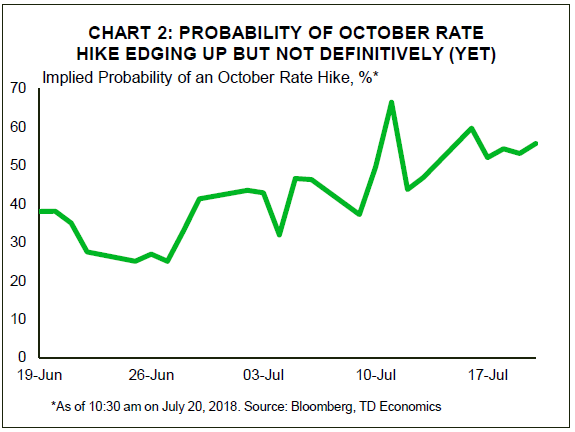
Looking at OIS-implied probability of rate hikes confirms the absence of a pre-determined path for rate hikes. The odds of an October hike are still divided at the 55% mark (as of 10:30 am this morning), moving up only modestly following the releases this week.
Dollar Rally Ends With Trump Monetary Policy and Currency War Comments
The USD fell against major pairs on Friday after US President Donald Trump tweeted that China and the EU manipulate their currency. Trade war escalation has reached a second phase at a time when American politics are having an identity crisis with the ongoing Russian interference during the 2016 elections. Steven Mnuchin will head to Buenos Aires to take part in the finance ministers G20 meeting with trade and monetary policies sure to be a topic of discussion. The European Central Bank (ECB) will announce its main refinancing rate on Thursday, July 26 at 7:45 am EDT with little expectations of a change. ECB President Mario Draghi will host a press conference at 8:30 am EDT with the market focused on his comments for insights into the monetary policy of the central bank.
- US President worried about Fed’s monetary policy triggers currency war
- European Central Bank meeting anticipated to be a quiet affair
- Canadian inflation and retail sales beat expectations
EUR Rises Ahead of ECB as Currency War Concerns Rise
The EUR/USD gained 0.28 percent in the last week. The single currency is trading at 1.1717 after a volatile week is over. The EUR rose 0.73 percent on Friday as Trump’s comments on currency manipulation hit the newswires. The US dollar had fallen on Thursday after President Trump criticized the U.S. Federal Reserve for raising rates and eroding the competitiveness of American products.
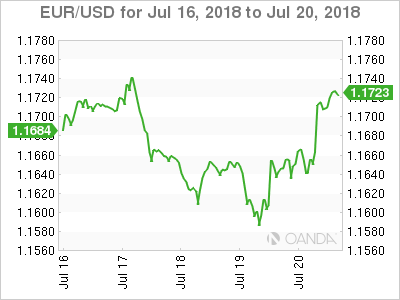
In an interview with CNBC the US President said he was not thrilled with the path of interest rates, although he did mention that he would let them do what they feel is best. Earlier in the week Fed Chair Powell testified before the Senate Banking Committee and the House Financial Services Committee side-stepping any comments on trade spats.
The U.S. Federal Reserve has hiked two times already in 2018 leaving the benchmark rate at 175 to 200 basis points. The CME FedWatch tool shows a 86.9 percent chance of a September rate hike and 53.9 percent of a follow up in December. Both sets of probabilities where higher on Wednesday before Trump’s comments were released.
The economic calendar will not feature a large number of North American indicators with the main standout being the release of the first estimate of the US GDP data on Friday, July 27. Analysts forecast a rise of 4.1 percent and could serve as an antidote to Trump’s tweets. The European Central Bank (ECB) will feature on Thursday, but there is little expectation that new guidance will be provided after the June monetary policy meeting.
Loonie Higher on Strong Retail Sales and Inflation Data
The Canadian dollar rose on Friday after the release of retail sales and inflation data. The USD/CAD DROPPED 0.05 percent on a weekly basis. The currency pair is trading at 1.3146 after Canadian retail sales surprised with a 2 percent rise to a seven month high boosted by auto and gasoline sales on Friday. Inflation rose 2.5 on an annual basis in June also impacted by higher gasoline prices. The economic indicators validate the decision of the Bank of Canada (BoC) earlier this month to hike rates by 25 basis points and could further pressure the central bank to lift rates higher despite growing geopolitical headwinds.
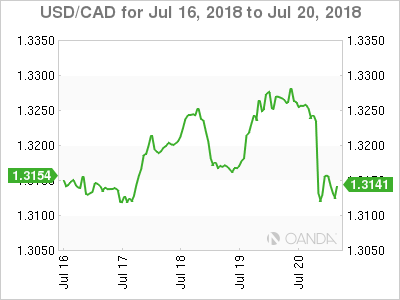
The US dollar has been on a downward trend since President Trump issued some sharp criticism on the U.S. Federal Reserve monetary policy. The comments took the market by surprise as talking about the currency is not usually the job of the President, but rather the Treasury Secretary. The statements will most likely be discussed as the G20 meeting in Buenos Aires kicks off.
The US President continued to tweet about the unfair strength of the greenback which responded by falling more than 1 percent against the Canadian dollar.
Oil prices recovered from losses earlier in the week but West Texas Intermediate will finish below $70 after concerns about the increase in supply outstripping rising demand.
The GBP/USD dropped 0.76 percent in the last five days. The currency pari is trading at 1.3133 with political headwinds keeping the pound under pressure. The confusing Brexit strategy from the UK government could end up costing Prime Minister May her job as she scrambles to call an early summer recess to avoid challenge to her leadership.
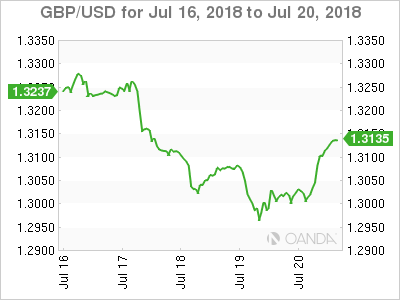
The Bank of England (BoE) held rates unchanged in June, but there were three dissenters. The economic data could support an August rate hike by the central bank, but the question now is will MPC vote for higher rates holding to its mandate, but with a high possibility that Brexit negotiations once again threaten the growth of the UK economy and the reverse action is needed. The market still believes in an August rate hike, but the GBP will continue under pressure from political uncertainty at home and abroad.
Market events to watch this week:
Tuesday, July 24
- 9:30pm AUD CPI q/q
Wednesday, July 25
- 10:30am USD Crude Oil Inventories
Thursday, July 26
- 7:45am EUR Main Refinancing Rate
- 8:30am EUR ECB Press Conference
- 8:30am USD Core Durable Goods Orders m/m
Friday, July 27
- 8:30am USD Advance GDP q/q
*All times EDT
Week Ahead – US GDP Growth Expected To Surge In Q2, ECB Meets – Can It Bring Relief To...
The preliminary estimate of US GDP growth for the second quarter and the latest monetary policy meeting by the European Central Bank will be the most keenly awaited events of the next seven days. While there should be plenty of headlines from these two risk events, the remainder of the week is looking unusually quiet, with only Australian inflation, Eurozone flash CPIs and US durable goods standing out as notable releases.
Australian inflation to rise within RBA’s target band
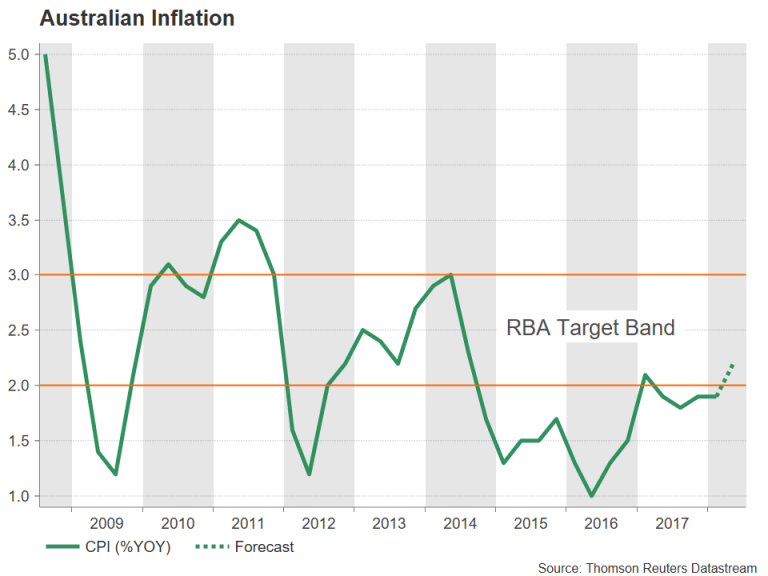
Recent data out of Australia has been fairly solid, with the economy bouncing back nicely in 2018 after a weak patch in the latter half of 2017. However, this hasn’t been enough to halt the Australian dollar’s slide, which is down by nearly 6% versus the greenback so far this year. Next week’s inflation figures might also struggle to lift the aussie given the growing trade risks and widening yield differential with the US even if, as expected, the RBA hits its price target. CPI numbers due on Wednesday are forecast to show the quarterly CPI rate rising to 2.2% year-on-year in the second quarter from the prior 1.9%. This would make it the first time since the first quarter of 2017 that inflation would have fallen inside the RBA’s target band of 2-3%. Investors will also be watching the RBA’s alternative trimmed mean and weighted median gauges of inflation due the same day, as well as quarterly producer prices on Friday for evidence that the uptick is sustainable.
The aussie is not alone in feeling the heat from the elevated trade tensions and the bullish US dollar. Its New Zealand counterpart has also been under heavy selling pressure during the past few weeks. However, the kiwi might find some short-term respite if New Zealand trade figures on Tuesday point to strong exports in June.
ECB meeting could bring more confusion about forward guidance
The ECB surprised many at its June meeting by announcing the full details of the decision to end its asset purchases and when to expect the first rate increase. Traders will be looking for more clues on the Bank’s ambiguous timeline of a rate hike on Thursday. But before then, attention will be on the Eurozone’s flash PMI releases on Tuesday, as well as on the German Ifo survey on Wednesday.
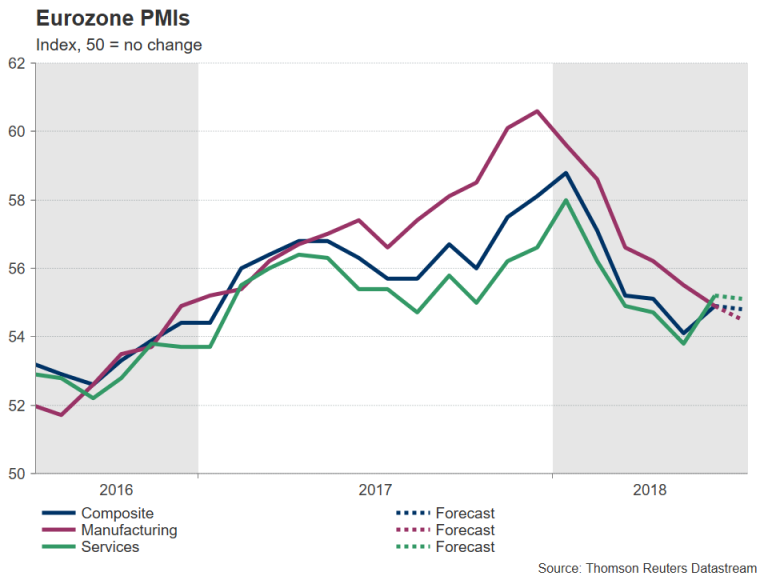
After a modest rebound in the euro area’s services and composite PMIs in June, a slight easing in activity is forecast for July. As for the manufacturing sector, the downslide is expected to continue in July. The euro could extend this week’s declines if analysts are unable to find anything positive from IHS Markit’s PMI reports. Meanwhile, there’s not likely to be much to cheer about either from Germany’s Ifo business confidence gauges. The Ifo business climate index is expected to drop marginally to 101.5 in July to more than one-year lows, underlining the deteriorating outlook of German businesses as a result of the growing trade frictions. An EU trade delegation will be holding talks with their US counterparts in Washington next week. German exporters might find something to celebrate about if the US accepts the EU’s compromise on tariffs and backs away from imposing higher levies on European car imports.
The clouded outlook for businesses is almost certain to keep the ECB on a cautious course even as the central bank readies to pull out of its bond buying program. Following last month’s landmark decision to call an end to four years of quantitative easing, investors will be hoping for more clarity on the ECB’s forward guidance to keep rates on hold “at least through the summer of 2019”, with some reports suggesting that Governing Council members had their own differing interpretations of what this meant. The unexpectedly dovish rate path forecast has been weighing on the euro ever since. But the single currency could benefit from any hint that a rate hike could come before the end of 2019, which is the current market pricing. As for the July meeting, no change in policy is anticipated by the ECB, with Mario Draghi expected to reiterate his recent message.
US GDP eyed for Q2 bounce
The first estimate of GDP growth in the June quarter will be the highlight of the US economic calendar, but there will be plenty of other US releases to keep traders busy next week. Housing data will be in focus on Monday (existing home sales) and Wednesday (new home sales) for signs of any weaknesses in the US housing market in June following this week’s surprisingly large drops in housing starts and building permits. On Tuesday, the flash PMI releases from IHS Markit are expected to show manufacturing and services activity holding near June’s levels in July, while on Wednesday, durable goods orders are set to rebound by 2.5% month-on-month in June from a 0.4% dip in the prior month.
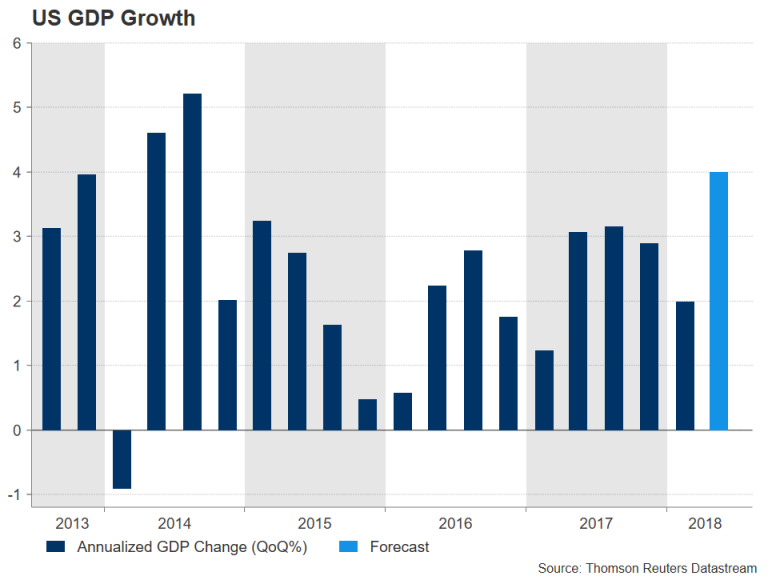
After the usual first quarter slowdown, the US economy is expected to roar back in the second quarter. Annualized growth is projected to jump from the prior 2.0% to 4.0% in the three months to June, which would make it the biggest expansion since the third quarter of 2014. The Trump administration’s tax cuts at the start of the year are thought to have stimulated consumer and business spending, putting the US at the top of the growth league table among advanced economies. Given the strong gains for the US dollar in the past two weeks, a large miss in the data would come as a shock for the markets and could lead to a sharp sell-off. Similarly, a much stronger-than-expected figure would raise questions about the Fed’s “gradual” rate hike policy.
Australia & New Zealand Weekly: Our RBA Forecast Remains on Track; FED No Lnger Likely to Pause in December
Week beginning 23 July 2018
- Our RBA forecast remains on track; FED no longer likely to pause in December.
- Australia: CPI, PPI, trade prices.
- NZ: trade balance.
- China: industrial profits.
- Europe: ECB policy decision, credit data.
- US: GDP, durable goods orders.
- Flash PMIs for Japan, Europe and the US.
- Key economic & financial forecasts.
Information contained in this report current as at 20 July 2018.
Our RBA Forecast Remains on Track; FED No Lnger Likely to Pause in December
Markets are now broadly pricing in Westpac's view on the outlook for the RBA cash rate with only around a 50% chance of a rate hike by the end of 2019. That is in stark contrast to a year ago when our call that rates would remain on hold in 2018 and 2019 was well out of market with markets anticipating around 75 basis points of tightening by the end of 2019.
A weakening housing market; soft inflation and wages growth; an uncertain consumer and pressures on funding have all conspired to cool markets' expectations. That key dynamic around an uncertain consumer facing constraints on income growth with a falling savings rate always stood out as a key constraint on the ability of the household sector to lift spending in the way anticipated by the markets.
While markets have moved largely to embrace our view, the Reserve Bank still expects to be raising rates over the course of 2018 and 2019. I think that is apparent in their ongoing above trend growth forecasts for 2018 and 2019. But, as we have argued before, the Bank does not have a perfect track record with its forecasts (as none of us in the economics community do) and it will react to any differences between its forecasts and "reality" in a timely fashion.
On the other hand our forecasts for the US Federal Funds rate have been consistently above market expectations. Our analysis of the current market pricing is for around 65 basis points of further tightening through 2018 and 2019. We have expected a total of 75 basis points over that period with one 25 bps hike in September, followed by a pause, and then 25 bps hikes in March and June with the rate peaking at 2.625% in mid - 2019.
We have expected that signs of the US economy slowing into the second half of 2019 (partly under the weight of a sharp slowdown in government spending) would see the FED curtailing its tightening cycle in anticipation of eventually cutting rates from 2021.
Under that scenario we had been arguing for a weakening AUD/ USD which had subsequently peaked around 0.81 in late January this year.
Under our relative rate profile the AUD/USD cash rate differential would sink to an unprecedented - 112.5 basis points by June 2019 (previous mark in the post stagflation history was - 50 basis points in the late 1990s).
That was likely to take a heavy toll on the AUD/USD with our target being 0.72 by next June.
That sum of 75 basis points of hikes from the FED was still slightly above market expectations but we now believe we need to be even more bold on the FED forecasts.
Trends in core inflation; wages; and employment are increasingly casting doubt on a FED pause between September and March.
On a six month annualised basis, the core PCE is now running at 2.3% (to May) and the Employment Cost Index is rising at 2.9% (to March). This pace is somewhat faster than we had expected providing the FED with ample justification for not pausing. In that regard we note that the FED has emphasised the symmetrical nature of its inflation objective and therefore not indicating any immediate concern that the momentum in the core PCE is running above the 2% target. As such, we are still expecting the gradual (3 month intervals) approach to the tightening cycle.
We now expect the FED to continue to edge rates up with an additional December hike of 25 bps while maintaining the June 2019 target timing for the end of the cycle.
That would indicate a peak Federal Funds rate of 2.875% by June 2019 - still short of the peak in the "dots" (the median of FOMC members' estimates) of 3.4% by end 2020 and 3.1% by end 2019.
Given our RBA outlook this revised forecast sees the spread between the RBA cash rate and the Federal funds rate reaching minus 137.5 basis points by June next year.
Markets are currently pricing in a margin of around minus 100 basis points so there is still ample scope for the AUD/USD to weaken further and the long bond spread to widen to our mid 2019 targets of USD 0.72 and negative 40 bps respectively (currently USD 0.735 and minus 20 bps).
Note that back in October last year when we were strongly promoting the prospect of a sharply negative differential between the RBA cash rate and the fed funds rate, the AUD was trading around USD 0.79 and the Australian 10 year bond rate was 50 basis points higher than the US 10 year bond rate.
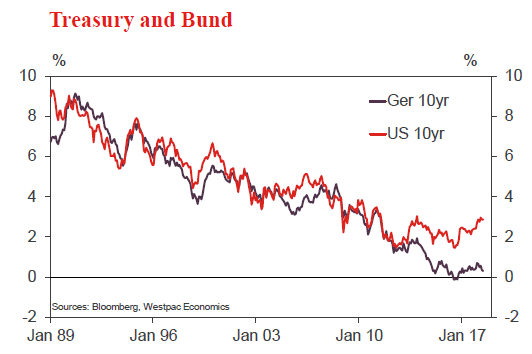
Since October last year the US 10 year bond rate has lifted from 2.32% to 2.82%. However, more recently, the rate has actually fallen from its peak in May of 3.1% despite stronger momentum in the US economy and more associated confidence around the FED's commitment to rate hikes. (2 year bond yields have lifted by around 10 basis points over that period.)
There are numerous explanations for the fall in the 10 year rate:
- Global growth concerns associated with a "trade war".
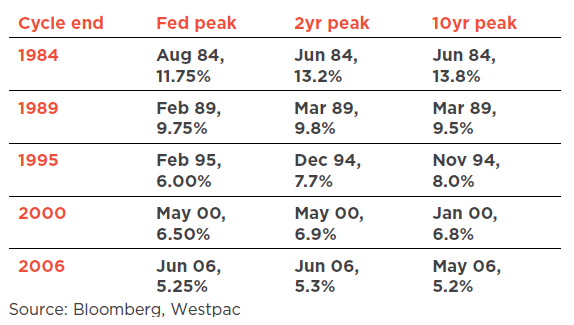
- Recognition that previous rate hike cycles have been marked by the 10 year bond rate peaking at about the same level as the fed funds rate.
- Current record spread to German Bunds of around 250bps.
Consider the table below:
On the other hand, there are also respectable arguments for higher US bond rates:
- While the trade war discussion focuses entirely on the implications for investment in US exporting industries, issues around the impact of tariffs on inflation and investment by import competing industries seem to be ignored.
- Assumptions are almost entirely biased towards a negative outcome from the trade discussions. There remains the possibility of some lowering of trade barriers in response to Trump's tactics.
- The supply/demand dynamics of the US bond market are also conducive to higher rates with supply being lifted by new Treasury issuance (recent issuance plans being focussed on a wide distribution across the yield curve) and demand being affected by the reversal of QE by the FED and some potential political resistance to purchasing Treasuries due to the trade tensions.
- In considering previous tightening cycles we have never seen a cycle where the bond rate has peaked more than 12 months before the end of the FED's tightening cycle (see table). It may be that the guidance provided by the FED has encouraged bond markets to pre - empt the moves in the Federal funds rate.
- As discussed, we expect that markets are underestimating the likely extent of the FED's tightening cycle.
- The FED is unlikely to be dissuaded from tightening with a view on the yield curve. While 9 of the last 10 inverse yield curves (10's versus cash) have correctly signalled recession, they have been characterised by a FED which has over - tightened due to losing control of inflation late in the cycle. We expect this will not be the case in this cycle with the FED being able to go on hold at around 30 bps above neutral (assessed as around 50 bps in real terms). To the extent that US bond rates are held down because of relative interest rates rather than some concern about US growth, it distorts the "recession" signal which may be contained in the shape of the yield curve.
- The ECB is set to end QE by end December while the BOJ has been tapering its bond purchases.
Our current US 10 year forecast envisages the rate eventually peaking around 3.5% in the June quarter 2019 prior to the FED going on hold. Recognition by the market that the FED was likely to go on hold (but not really becoming a clear signal until well into the September quarter) would then see a solid retracement in the bond rate through the course of the remainder of 2019 and 2020. That peak in the 10 year bond rate would be 60 bps above the eventual Fed funds peak, (and is therefore unusual), albeit around the current peak level of the "dots". We do not envisage any major downward assessment of the dots over the course of the next 12 months.
The outlook for the US 10 year bond rate is the most intriguing challenge facing markets. We have set out some strong arguments supporting our current view that there will be another up leg in the cycle through to mid - 2019. We recognise there are respectable arguments opposing that view and would certainly grant that the risks around the 3.5% cycle peak are more to the downside than the upside.
The week that was
This week has been full of contrasts. For Australia, our Leading Index fell below trend as employment growth jumped higher. In China, GDP met the market's robust expectation for Q2 as the latest credit data clouded the outlook. And in the US, Chair Powell put forward a positive view on the outlook, while remaining cognisant of the risks.
Beginning with Australia, in June the Westpac - MI leading index recorded its first below - trend reading since September last year. Notably, this deceleration came about owing to domestic factors: a turnaround in unemployment expectations, a deepening contraction in dwelling approvals and a reduction in support from Australian dollar denominated commodity prices. This week's June employment outcome was well ahead of this level (51k jobs created; 41k of which were full time); but over 2018 to date, the average has been 19k. Comparing the first half of 2018's 19k average to the 34k month - average of 2017 highlights why households are (a little) less confident in their employment prospects. However, as these gains are enough to hold the unemployment rate steady, one suspects that sentiment in this area of the economy will remain robust. See chart of the week below.
More broadly on the RBA, the July meeting minutes clearly highlighted the many tensions regarding growth for policy at the moment. Continued job gains; public infrastructure and non - residential construction combined should offer the economy strong support through 2018 and 2019, yet the debt burden of Australian households and persistent weakness in wage growth cast a long shadow. Some had hoped for guidance from the RBA on short - term funding pressures and the potential impact it could have on activity. Detail however was scant, with the RBA instead keen to continue investigating the issue.
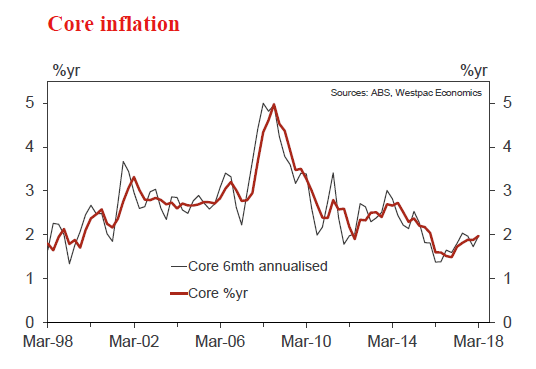
Of equal significance with activity growth for policy is inflation. Next week's June CPI is expected to be (yet another) benign print, at 0.4 (2.1%yr) for headline inflation and 0.5% (1.9%yr) for core. Our preview has all the component detail for those interested, but two additional points are worth noting here. First is that for the past 18 months, market forecasters have consistently overestimated inflation outturns. Second, recognising the persistence of this disappointment as well as the disinflationary impact of energy prices over the year ahead, we have recently revised down our view for inflation in 2018 and 2019. We now believe it will be difficult for the CPI to move materially above the bottom of the RBA's target range over that entire period.
Turning then to the global economy, China was front and centre this week. GDP came in right on the market's expectation of 6.7%yr. The detail was consistent with the intent of authorities: for improved consumer incomes and wealth to beget stronger consumption. In terms of assessing the sustainability of growth, two points are worth noting. First, consumption held up in Q2 (instead of slowing after lunar new year holidays as it typically does) indicating the gain in Q2 was outsized, likely aided by buoyant confidence. Amid tariff concerns, and given the employment pulse has softened, this does not seem sustainable. Second, what is likely to endure is entrenched weakness in investment. Clearly evident in the investment detail at June is the shock that has come from tighter credit standards and loan availability necessary to reset the system and push capital to the 'industries of tomorrow'. We therefore remain comfortable calling for weaker growth in the second half, and a full year outcome below the 6.5%yr target of authorities - our best guess, 6.3%. One additional point on housing. In recent months, there has been a distinct acceleration in price gains across the nation. This is however unlikely to require a further tightening of standards as: (1) the price growth is skewed towards tier 2 and 3, where it is desired; and (2) construction activity is broad based.
Finally on the US, Chair Powell appeared before the US Congress in his semiannual testimony. The core view on the economy was unchanged, a 'just right' combination of robust confidence in economic momentum and little concern over inflation. The consequence for policy is that "the FOMC believes that - for now - the best way forward is to keep gradually raising the federal funds rate". The inclusion of "for now" emphasises clearly that the outlook is not entirely benign. Risks remain. On the financial front, it is best to hold that risks will be reacted to only as they manifest. Financial conditions and stability are seen as "normal" despite some assets being priced at elevated levels. Comments on the yield curve were also non - threatening. The risks to watch more closely then are those tied to the real economy, particularly current trade tensions. Most notable from the Q&A was the comment from Chair Powell that the FOMC had evidence of capital expenditure plans being "put on ice". If we are correct in anticipating decelerating support for growth from the consumer, then to sustain GDP growth near 3.0% past Q2, business investment must remain strong. The building evidence however is that this open - ended uncertainty around trade may preclude it. Government spending would then be left as the prime contributor to momentum from late - 2018, setting the US economy up for a very sharp growth slowdown in 2019 - even absent a material shock to household incomes and confidence.
Chart of the week: Australia unemployment rate
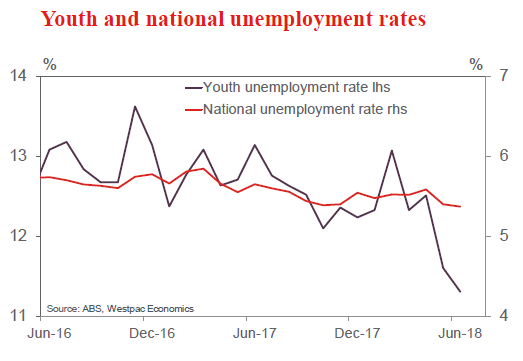
June's employment gain of 51k was a very positive one. Putting it into context, it still caps off a slower first half of 2018 for Australian employment growth than last year's uplift of 3.4%. The six month annualised pace is down to 1.9% from a peak of 4.3% in August 2017. Yet, the last three months have been more positive, averaging 28k per month after a slow start to 2018 with employment growth stalling through February and March.
In line with the relationship over the past year, the participation rate is closely following changes in employment, keeping the unemployment rate fairly steady at around 5 ½ per cent. However, we are nearing a breach to 5.3% - which at the conventional one decimal place, would be a low for unemployment back to 2012.
The latest move lower has been driven by a sharp decline in youth unemployment where jobs growth tends to be more pro - cyclical than the national aggregate and its unemployment rate is more volatile.
New Zealand: week ahead & data wrap
Economic news over the past week continued to highlight the flagging momentum in activity through the first half of 2018. However, while the economy has lost some steam, the back half of the year is likely to see a rotation in the drivers of growth, underpinned by a large increase in fiscal spending. This will help to provide a floor under GDP growth over the next year or two. Against this backdrop, we have seen a firming in inflation, with a further lift expected over the next few quarters.
The New Zealand economy slowed through the first half of 2018
The first half of 2018 saw some of the wind coming out of the economy's sails, with annual GDP growth estimated to have slowed to around 2.5% in the year to June. This has broadly matched our expectations for a cooling in private sector demand in the face of a slowing housing market and emergence of capacity constraints. But while GDP growth may have slowed, we certainly wouldn't describe the New Zealand economy as being weak, especially not with unemployment at a ten year low. The economy is now into its eighth year of expansion, and it's normal to see some easing in growth at this late stage of the cycle as spare capacity has been absorbed.
Slowing economic momentum has been seen on several fronts. One of the most important is the housing market. The latest update from REINZ revealed that nationwide house prices fell by 0.1% in June, leaving the level of house prices essentially flat since February. Prices are still 3.8% higher than this time last year. However, that is a far cry from the double - digit rates of increase we saw in recent years.
Softness in house prices has been centred squarely on the Auckland and Canterbury markets, which together account for 40% of sales. Prices in Auckland fell 0.3% in June (their fourth decline in as many months) and have been tracking sideways for close to two years now. Similarly, prices in Canterbury have held steady for an extended period as the region continues its post - earthquake adjustment. Outside of Auckland and Canterbury, we're still seeing reasonable price gains, though the rate of increase has taken a noticeable step down from the frantic pace seen in previous years.
The slowdown in the housing market comes against a backdrop of significant policy changes. The 'Bright Line Test' for taxing capital gains has already been extended. Restrictions on foreign buyers of property are expected to come into force some time next month. Then from early next year, the use of negative gearing by property investors will start to be phased out. Combined with increases in housing supply (which are also being supported by policy changes like the KiwiBuild program and Auckland's Unitary Plan), we expect that these measures will result in house price growth remaining muted for some time.
New Zealanders hold a large portion of their wealth in owner - occupied and investor housing, and we've already seen nominal spending growth flattening off through the first half of the year as the housing market has cooled. Looking ahead, we expect that continued softness in the housing market will weigh on household spending for some time yet (though as discussed below, this will be partially offset by increases in family support payments).
The slowdown in the housing market comes atop other signs that growth has cooled. A range of recent surveys have highlighted falling confidence and softening activity in the business sector. That message was reinforced by the latest surveys of manufacturing and service sector conditions from BusinessNZ, which pointed towards slowing output growth, as well as a cooling in the demand for workers and a moderation in forward orders in recent months.
Fiscal spending to provide a floor for growth going forward
After cooling in recent months, we expect GDP growth will find a floor through the second half of the year. A key reason for this is that significant increases in Government spending are now being rolled out. That includes around $1.5b of spending on the Government's families package and accommodation support payments, which together will provide a significant boost to the disposable incomes of many households. The coming year will also see big spending increases in other areas, including health and education.
Increases in government spending, along with firmness in some export sectors (including tourism) will help to offset the moderation in private sector demand. Putting it all together, we expect to see the economy growing at rates a little below 3% over the next year or two.
The inflation backdrop is also firming
The other area of the economy where things have been changing is inflation. Consumer prices rose by 0.4% in the June quarter to be up 1.5% over the year. That was a little softer than we had expected, weighed down by some one - off factors (like falls in the prices of imported cars and televisions). However, digging into the details, what we are seeing is an ongoing gradual firming in the economy's underlying inflation pulse. That was reflected in the range of core inflation measures StatsNZ and the RBNZ produce, which are now running at levels approaching 2%. Importantly, this lift in core inflation has been underpinned by a rise in the more persistent domestic components of inflation. Combined with a firming in wage growth and rise in petrol prices, this should see inflation finally rising back to 2% by the end of this year.
Markets had been flirting with the possibility of a cut from the RBNZ in recent weeks. However, the firming in core inflation has poured cold water on that idea. We continue to expect that the next move in the OCR will be a hike, but don't expect this to occur until the final quarter of 2019. The RBNZ will be mindful that at least some of the current rise in inflation is related to fuel prices, so will likely be temporary. Furthermore, it looks unlikely that inflation will threaten the upper bound of the RBNZ's target band any time soon, particularly given the lingering softness in many retail prices. That means that there's no urgency to adjust rates at this stage.
Data Previews
Aus Q2 CPI
- Jul 25, Last: 0.4%, 1.9%yr, WBC f/c: 0.4%, 2.1%yr
- Mkt f/c: 0.5%, Range: 0.3% to 0.8%
The Consumer Price index for Q1 was 0.4%qtr, 1.9%yr. For Q2, we anticipate another 0.4% print, lifting the annual figure to 2.1%. The average of the RBA core measures was 0.5%qtr, 2.0%yr in Q1. We anticipate 0.5%qtr, 1.9%yr for Q2.
In short, inflation is at the bottom of the RBA's target band at a time of weak wages growth, intense competition across retail and supermarkets, as well as a housing slowdown.
In Q2, petrol prices jumped 6%, adding 0.2ppts to the CPI. Against that, the CPI (which is not seasonally adjusted, unlike the RBA core measures) will be dampened by seasonally soft reads on education and pharmaceuticals.
Electricity bills, up sharply in 2017, are expected to moderate in Q2 as capacity in renewable energy expands.
For more detail, see our CPI preview bulletin.
Aus Q2 import price index
- Jul 26, Last: 2.1%, WBC f/c: 2.5%
- Mkt f/c: 1.9%, Range: 0.5% to 3.5%
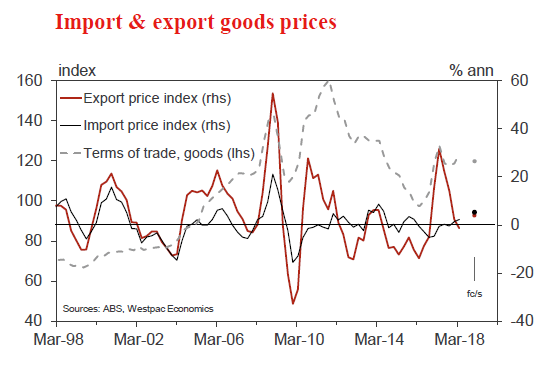
Prices for imported goods increased by 2.1 in the March quarter to be 2.3% above the level a year earlier - moving higher on rising global energy prices and with the Australian dollar pulling back of late.
For the June quarter, we expect import prices to rise by a further 2.5% to be 5.0% higher than in mid - 2017.
The currency weakened in Q2, making imports more expensive. In the quarter, the dollar fell by 2.6% on a TWI basis to be down by 3.2% over the year.
The cost of imported fuel increased yet again as oil prices continued their climb.
Aus Q1 export price index
- Jul 26, Last: 4.9%, WBC f/c: - 0.8%
- Mkt f/c: - 1.3%, Range: - 3.0% to 0.0%
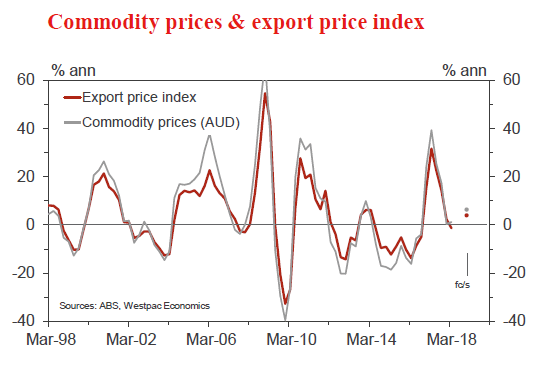
Export prices have been volatile over the past year as global commodity prices fluctuate.
The March quarter saw an upward movement in commodity prices, contributing to a near 5% bounce in the export goods price index - but that still left the index 1.4% below the level of a year earlier.
In the June quarter, commodity prices reversed. We expect the export price index to decline by 0.8% in Q2 despite the lower dollar boosting export earnings.
The terms of trade for goods, on these estimates, retreated by a little in excess of 3% in the June quarter.
As to prices for services, an update will be available with the release of the Balance of Payments on September 4.
ECB July policy meeting
- Jul 26, last - 0.40%, WBC - 0.40%
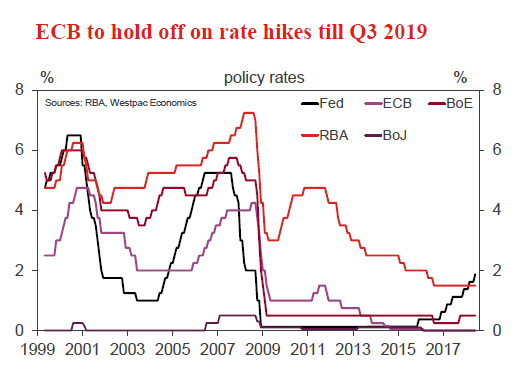
With such clear and purposeful guidance on policy delivered in June, the July ECB meeting feels like a non - event.
We know that asset purchases will be tapered again from October before ending completely in December, and that interest rates are on hold until the end of next summer.
What then is the point of closely scrutinising the July post - meeting communications? In short, the Governing Council's assessment of global risks.
Of greatest significance will be their view on the effect mounting trade tensions are having on Europe's economy, both businesses and households. Also crucial to the outlook is global financial stability and market liquidity. Finally, we expect another clear warning on the threat that European politics pose to the region's long - term productivity and prosperity.
US Q2 GDP, % annualised
- Jul 27, last 2.0%, WBC 4.2%
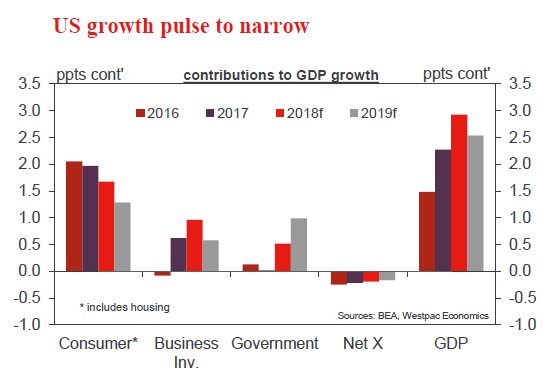
A very strong Q2 outcome has long been expected by the market. Following a modest gain of 2.0% in Q1, in part because of particularly poor weather, US GDP is set to bounce over 4.0%. There are a number of risks, primarily around deflators for trade and consumption, that could see the final number come out anywhere between 3.5% and 4.5% annualised. But to us the most likely outcome is circa 4.2%.
In terms of the components, trade and government spending are expected to be strong positives, with business investment and consumption also set to provide material support.
Following this release, attention will quickly turn to the second half of 2018. Here, expectations are also very high, but to us so are the risks. In recent business investment partial data, there has been signs of a softening, and anecdotes on the effect from tariffs are rising. Real income growth for the consumer is also a looming constraint.
Japan PM Abe: Trade restrictions will not benefit anyone
Japan Prime Minister Shinzo Abe said today that "imports of our nation's automobiles and auto parts have never damaged U.S. national security and will not do so in the future."
And, he added "trade restrictions will not benefit anyone, and we will keep explaining that to the U.S. and work closely with them to ensure those tariffs are not imposed."
It seems like Abe only refer to the threat of auto tariffs. The already-in-effect steel and aluminum tariffs are forgotten? Or, are Japanese steel products security threat to the US?
EU Barnier: Brexit cannot be justification for creating more bureaucracy
EU chief Brexit negotiator Michel Barnier said after meeting other EU ministers that there are "several elements" in UK Prime Minister Theresa May's Brexit white paper that "open the way to a constructive discussion regarding the political declaration on our future relationship".
However, he also noted that he had put many questions back to the US for clarity on whether the proposals are workable. And he warned that "Brexit cannot be and will not be a justification for creating more bureaucracy."
At this point, there is still no agreement on how to avoid a hard Irish border. Barnier said "this requires a legally operative backstop, an all weather insurance policy, to address the issues of Ireland and Northern Ireland. All 27 member states insist on this."
Trump blasts EU, China and Fed again
Trump continues to blast the EU, China and even Fed (well of course not Russia, nor North Korea) with his tweets today
https://twitter.com/realDonaldTrump/status/1020290163933630464
https://twitter.com/realDonaldTrump/status/1020287981020729344
For those who're new to the markets, the 2007-2008 global financial crisis started with the bursting of the subprime mortgage bubbles in the US. Fed cut policy rate to 0-0.25% in December 2008. And in late November that year, Fed started QE1. In 2011, Fed started QE2. And in 2012, Fed started QE3.
ECB cut the main policy rate to 0.25% much later in 2013 and then subsequently to 0.00% in 2016. While ECB used the Securities Markets Programme since 2010, QE is seen as formally started in 2015.
The current situation of US rasing interest rate is a result of the US leading the way in loosening monetary policy to counter the problem of theirs.
And, would Kudlow or Navarro or give him a lesson that Fed's rate hikes are still not tightening, but policy normalization, or removal of accommodations. The US economy has been enjoying the privileges of ultra loose monetary policy and it's time to treat it as it should be treated.
And if the Fed doesn't normalize its policies during a time when the economy is doing so well, what is left for Fed is save the economy when the next crisis comes?
The above are some common sense indeed. But for those who choose to ignore, our response is like someone who said this week -- "where do we start?"
Canadian Retail Sales Bounced Back Solidly in May
Highlights:
- Retail sales rose 2.0% both in nominal and volume terms to reverse a big 0.9% drop (-1.1% volumes) in April.
- Retail sale volumes are tracking a solid rebound in Q2 as a whole after a soft start to the year in Q1
- We are tracking a 0.2%-0.3% increase in overall May GDP. That would mark the fourth straight month of increases and would seemingly confirm that the slowing to a 0.1% increase in April was more tied to transitory factors than a fundamental slowdown in growth.
Our Take:
The rebound in May retail sales seemingly confirmed that a big drop in April was more a result of bad weather in parts of the country than fundamental weakness. A big 3.7% rebound in motor vehicle sales after a 3.8% April drop accounted for much of the overall increase. Sales were also up 1.4% excluding motor vehicles and parts, though, with gains posted in 8 of 11 subsectors.
Excluding the impact of prices, sale volumes also rose 2.0%. That combined with a solid increase in manufacturing sales reported earlier this week adds to the evidence that overall GDP increased for a fourth straight month in May — and likely at a faster pace than the 0.1% increase in April. Overall growth in the economy increasingly looks to have bounced back to an ’above-trend’ rate in Q2 after slowing to 1.3% in Q1. Data to-date is tracking somewhat stronger than our call for a 2.2% Q2 GDP increase. Uncertainty around the outlook remains, not least tied to concerns about a possible escalation in trade disruptions with the U.S. For now, though, the current economic backdrop continues to look solid.
Canadian Inflation Jumped to a Six-Year High in June, Core at 2% Again
Highlights:
- After May’s CPI fell short of expectations, inflation surprised to the upside in June with the headline rate jumping to 2.5% from 2.2%.
- The pickup in inflation relative to this time last year (when headline was at 1.0%) reflects higher energy prices, a reversal of food price deflation, and firmer underlying price growth.
- The BoC’s core measures averaged 2.0%. Ex food and energy inflation is slightly slower at 1.8%.
Our Take:
Today’s jump in headline inflation was a bit firmer than markets expected. Ditto for the Bank of Canada with the Q2 average coming in 0.1 ppt higher than their latest forecast (an admittedly small miss, but they already had two months of data). The increase in June was largely an energy story as gasoline prices were up 25% from a year ago, the fastest pace since 2011. The central bank is expecting a modest, energy-driven overshoot of their 2% inflation target—that actuals are coming in a touch higher won’t be too alarming. The BoC’s core measures were little changed, averaging 2% as they have for much of the year. In recent communications Governor Poloz has said, front and centre, “inflation is on target and the economy is operating close to capacity.” Today’s data is consistent with that. So the bank’s new mantra that a gradual approach to tightening is warranted remains, well, warranted.
June’s CPI reading is the last before Canada’s retaliatory tariffs on $16.6 billion of US imports took effect July 1. The BoC has estimated a fairly modest 0.1 ppt upward impact on CPI from those countermeasures. They’ll likely just add that to the list of factors temporarily boosting inflation—alongside energy prices, exchange rates pass through, and higher minimum wages. We doubt monetary policy will respond to those transitory factors. But some food for thought: the bank’s latest Business Outlook Survey showed inflation expectations are shifting toward the upper half of their 1-3% target band. In that context Governing Council might be a bit more concerned about higher inflation readings (transitory or not) feeding through into expectations.
Sunset Market Commentary
Markets
The Bund performed well in the first trading hour as BTP’s sold off following rumours that Lega leader Salvini and 5SM Di Maio opted to cut loose one of the moderate voices inside their populist government, FM Tria. The uptick in the Bund was erased by noon when US President Trump suggested to impose tariffs on all Chinese goods, worth $500 bn. Again, the uptick in core bonds was rapidly erased, but it didn’t turn out to be the end of the story. The US president decided to take a second shot at the Fed, saying that rate increases hurt the US when the country is about to issue more debt. He also took another swing at dollar strength, calling China and the EU currency manipulators!! The dollar and stock markets took a dive, but core bonds hold a very tight range. The US Note future gradually faces some selling pressure. The numerous outbursts and policy errors of US President slowly weigh on the country’s credibility. St. Louis Fed Bullard, arch dove, warned that an inverse yield curve would be a bearish signal to the US economy and argued in favour of slowing the tightening process. His stance is well known and currently a minority inside the FOMC. The US yield curve steepens at the time of writing with yield changes ranging between -0.6 bps (2-yr) and +3.3 bps (30-yr). German yields increase by 0.7 bps (2-yr) to 1.7 bps (10-yr). 10-yr yield spread changes vs Germany are virtually unchanged with Italy underperforming (+4 bps).
Yesterday, a constructive USD momentum was overthrown as US president Trump said that he was unhappy with the Fed raising interest rates. He also saw the strong dollar resulting from the Fed policy as a disadvantage for the US economy. Trump’s quotes triggered some modest losses. Initially the post-Trump setback of the dollar remained a one-off. The dollar basically stabilised this morning. However, later today US president Trump stepped up its trade war rhetoric. In an interview he said to be ready to impose tariffs on all Chinese imports. On twitter, he also accused China and the EU of manipulating their currency. These ‘new’ trade war headlines caused some shivers on the equity markets and finally also filtered through into the FX market. EUR/USD jumped north of 1.17. Initially, the decline of USD/JPY also developed in a gradual way, but the move accelerated after the new batch of Trump headlines. The pair tumbled below the 112 handle.
This morning sterling traded within reach of recent lows against the euro with EUR/GBP holding in the 0.8950 area. In a speech in North-Ireland, UK PM May called the EU to change its position on the backstop solution regarding the Irish boarder as it is unacceptable for the UK. The call illustrates that the issue is far from being resolved. However, this time it caused no additional sterling losses. Later, sterling even regained a few ticks as BoE’s Tenreyro said that soft Q1 growth was probably temporary. Markets saw this as an indication that she could vote in favour of an August rate hike. EUR/GBP lost slightly ground, but the move was hampered by the EUR/USD rebound. EUR/GBP trades in the 0.8935/40 area. Some sterling relief combined with USD softness helped cable to regain more than one big figure. The pair tries to regain the 1.31 barrier.
News Headlines
Reports on Di Maio (5-Star Movement) and Salvini (League) seeking Italy’s finance minister Tria’s resignation if he did not back government nominees for heading the state owned bank CDP rattled Italian bond and equity markets. Di Maio later denied.
US President Trump doubled down on trade rhetoric, saying he is “ready” to impose tariffs on all Chinese imports (totaling up to $500bn in 2017). Trump previously imposed tariffs on $34bn of Chinese imports, planned another $16bn and threatened to target $200bn.
Canadian inflation increased stronger than anticipated from 2.2% to 2.5% in June (vs. 2.3% expected), as did headline and core retail sales (up to 2% m/m and 1.4% respectively). The Canadian dollar jumped versus his US counterpart. USD/CAD declined more than a full big figure (currently 1.3130 area).