Sample Category Title
AUD/USD Weekly Outlook
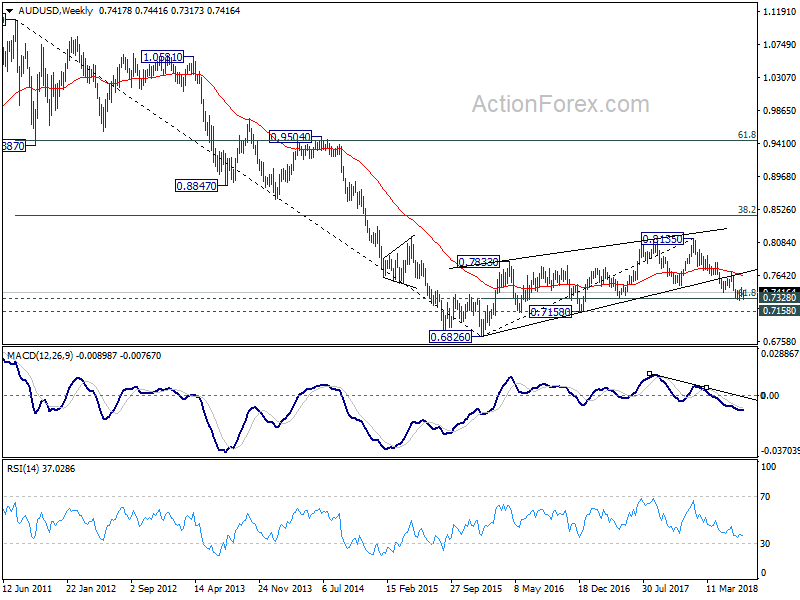
AUD/USD was supported above 0.7309 last week and staged a strong rebound after initial fall. The development suggests that consolidation from 0.7309 is still in progress. Initial bias remains neutral this week first. On the upside, break of 0.7483 resistance will bring stronger rebound. But upside should below 0.7676 resistance to bring larger fall resumption. On the downside, break of 0.7309 and sustained trading below 0.7328 cluster support (61.8% retracement of 0.6826 to 0.8135 at 0.7326) will extend the fall from 0.8135 to 0.7158 support next.
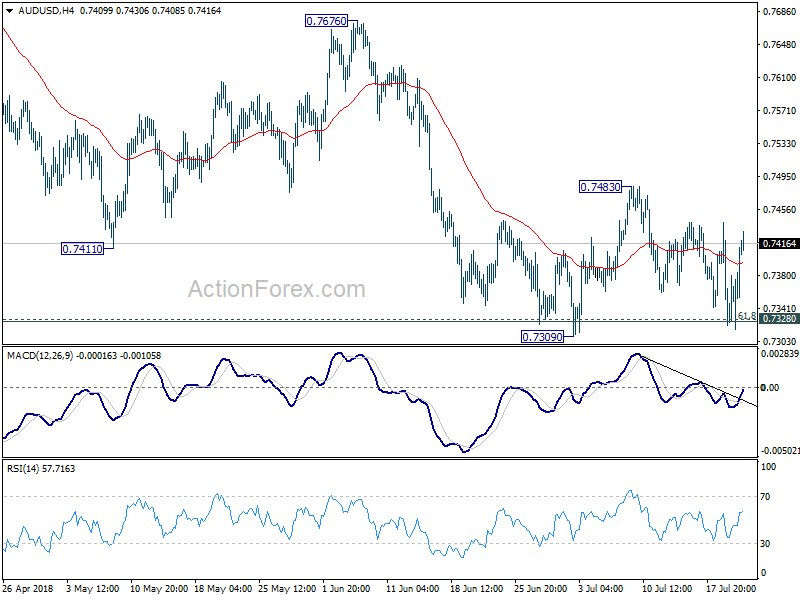
In the bigger picture, medium term rebound from 0.6826 is seen as a corrective move that should be completed at 0.8135. Deeper decline would be seen back to retest 0.6826 low. This will now remain the favored case as long as 0.7676 resistance holds.
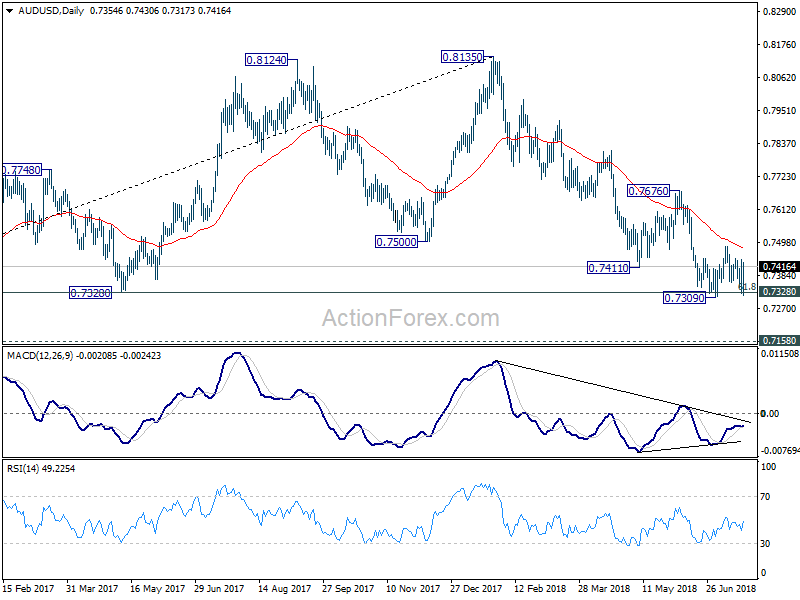
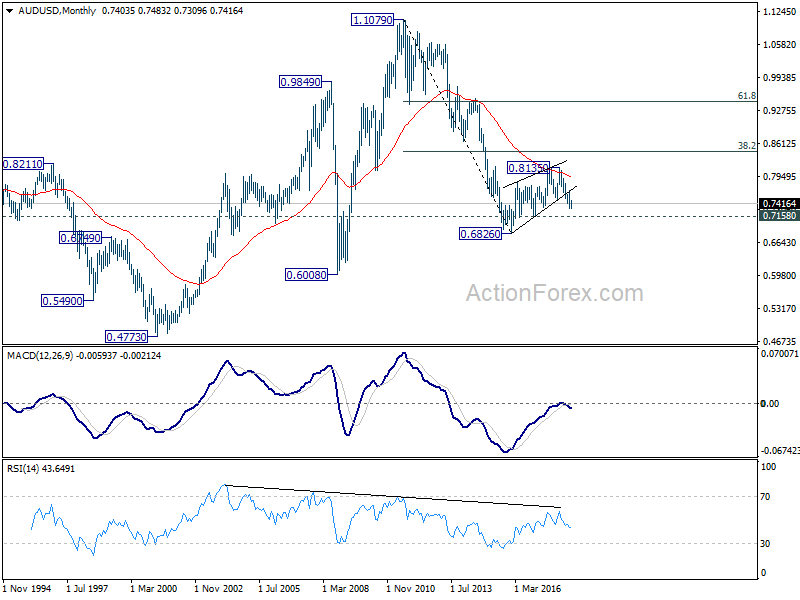
In the longer term picture, 0.6826 is seen as a long term bottom. Rise from there could either reverse the down trend from 1.1079, or just develop into a corrective pattern. At this point, we're favoring the latter. And, as long as 38.2% retracement of 1.1079 to 0.6826 at 0.8451 holds, we'd anticipate another decline through 0.6826 at a later stage. But strong support should be seen between 0.4773 (2001 low) and 0.6008 (2008 low).
USD/CAD Weekly Outlook
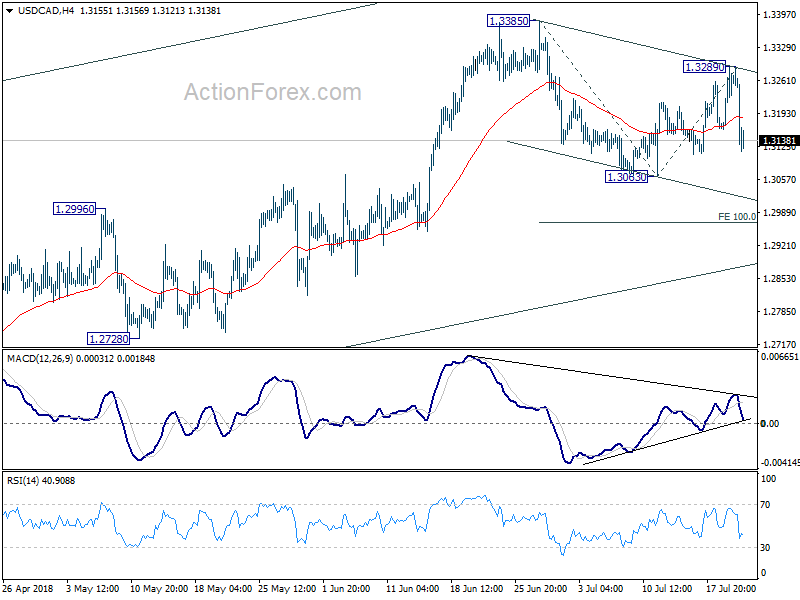
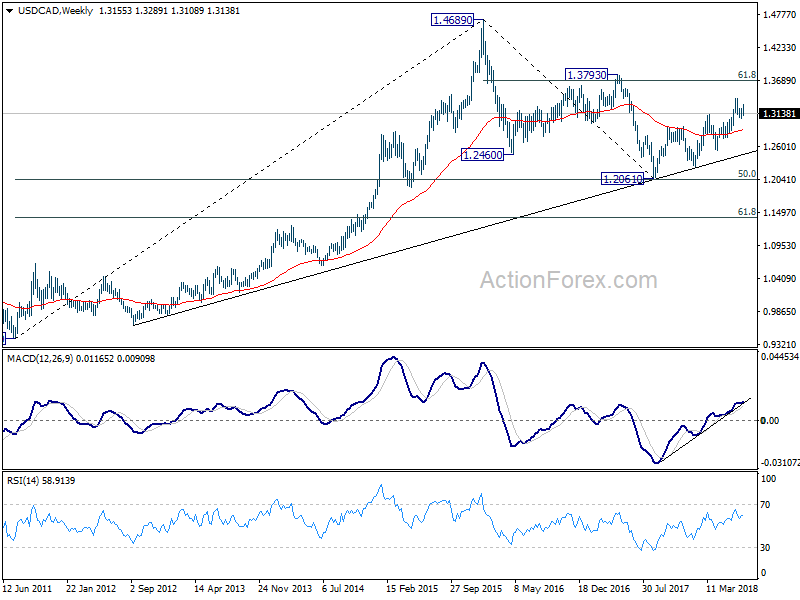
USD/CAD gyrated higher to 1.3289 last week but fell sharply since then. The corrective structure of the rebound argues that decline from 1.3385 isn't completed yet. Initial bias is mildly on the downside for 1.3063 support first. Break will target 100% projection of 1.3385 to 1.3063 from 1.3289 at 1.2967. But we'd expect strong support from rising channel line (now at 1.2878) to contain downside and bring rebound.
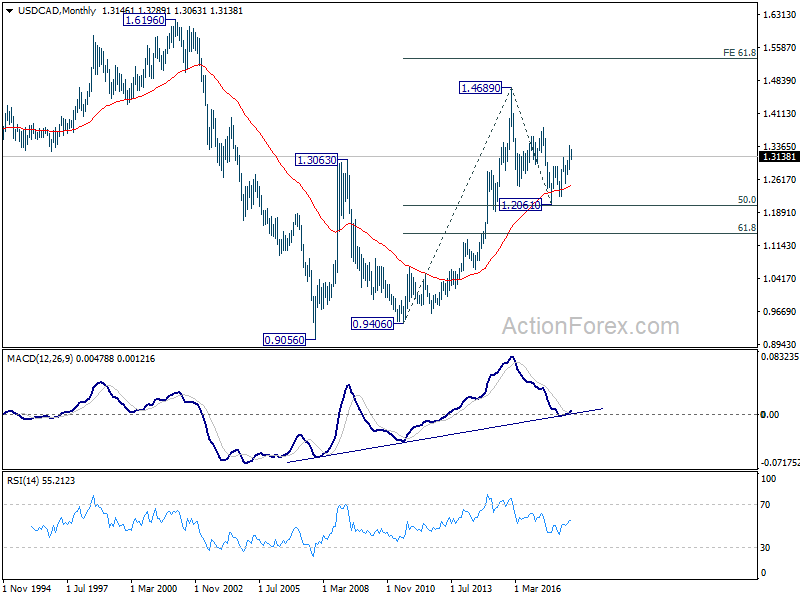
In the bigger picture, as long as channel support (now at 1.2878) holds, we're holding to the bullish view. That is, fall from 1.4689 (2015 high) has completed at 1.2061, ahead of 50% retracement of 0.9406 (2011 low) to 1.4689 (2015 high) at 1.2048. Further rally should be seen for 61.8% retracement of 1.4689 to 1.2061 at 1.3685 and above. However, sustained break of the channel support will argue that rise from 1.2061 has completed and will bring deeper fall to 1.2526 support to confirm.
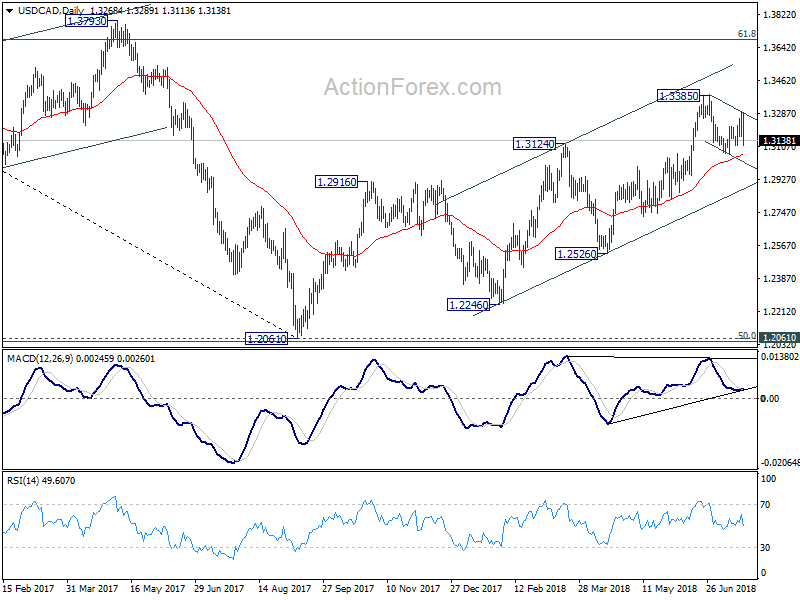
In the longer term picture, corrective fall from 1.4689 (2015 high) should have completed with three waves down to 1.2061, just ahead of 50% retracement of 0.9406 (2011 low) to 1.4689 (2015 high). The development keeps long term up trend from 0.9406) and that from 0.9056 (2007 low) intact. It's early to tell, but there is now prospect of extending the long term up trend to 61.8% projection of 0.9406 to 1.4689 from 1.2061 at 1.5326 in medium to long term.
GBP/JPY Weekly Outlook
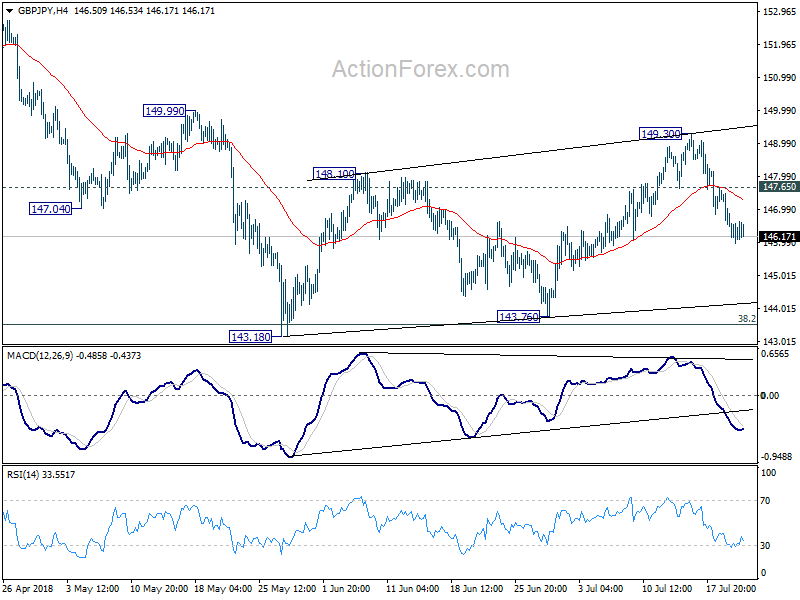
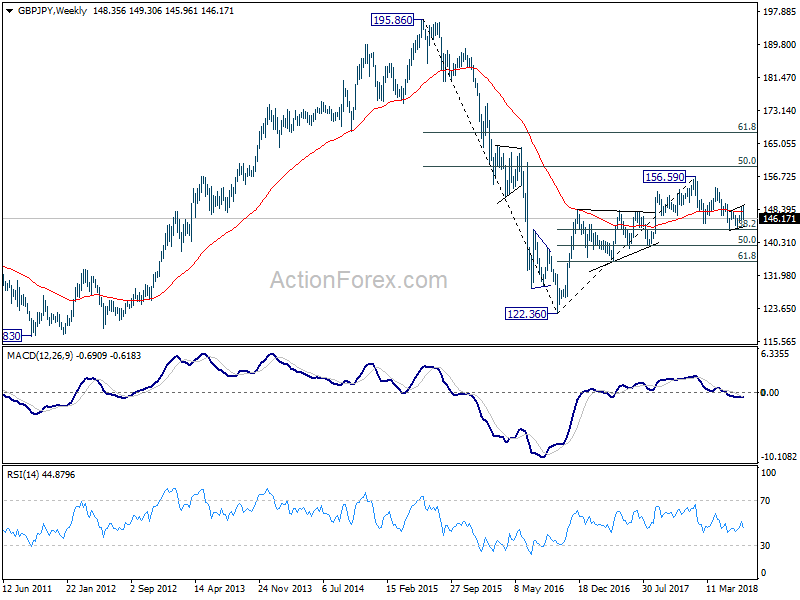
GBP/JPY's sharp decline last week argues that the consolidation pattern from 143.18 has completed with three waves up to 149.30 already. Initial bias remains on the downside this week for 143.18/76 support zone. On the upside, above 147.65 minor resistance will turn bias back to the upside for 149.30/99 resistance zone instead.
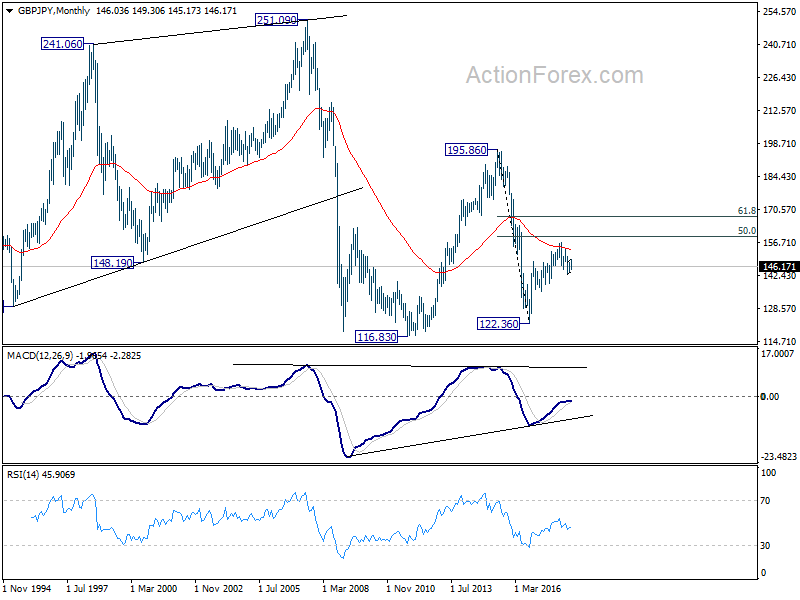
In the bigger picture, no change in the view that decline from 156.59 is a corrective move. In case of another fall, strong support should be seen above 139.29 cluster support (50% retracement of 122.36 to 156.59 at 139.47) to contain downside and bring rebound. Meanwhile, break of 153.84 should confirm that the correction is completed and target 156.59 and above to resume the medium term up trend.
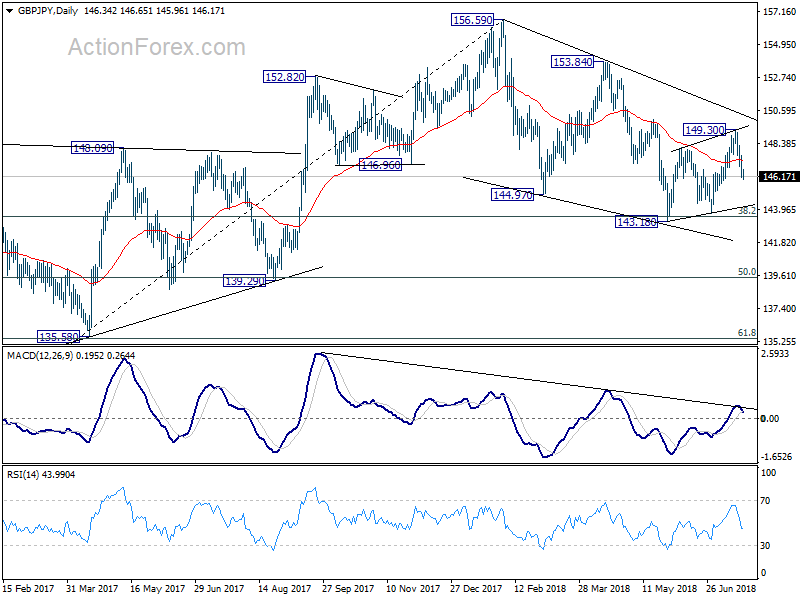
In the longer term picture, the failure to sustain above 55 month EMA (now at 153.36) is mixing up the outlook. Nonetheless, as long as 139.29 holds, rise from 122.26 is in favor to extend to 50% retracement of 195.86 (2015high) to 122.36 (2016 low) at 159.11, and possibly further to 61.8% retracement at 167.78 before completion. However, firm break of 139.29 will turn focus back to 116.83/122.36 support zone instead.
EUR/JPY Weekly Outlook
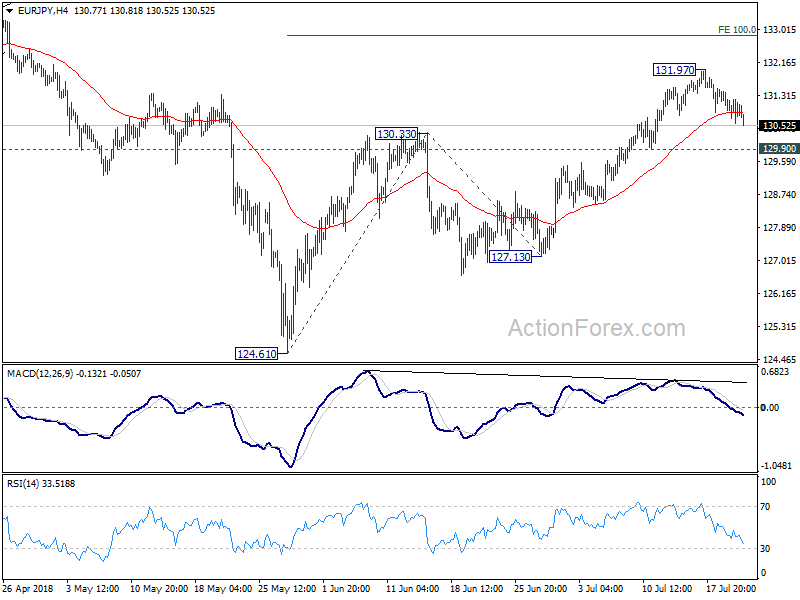
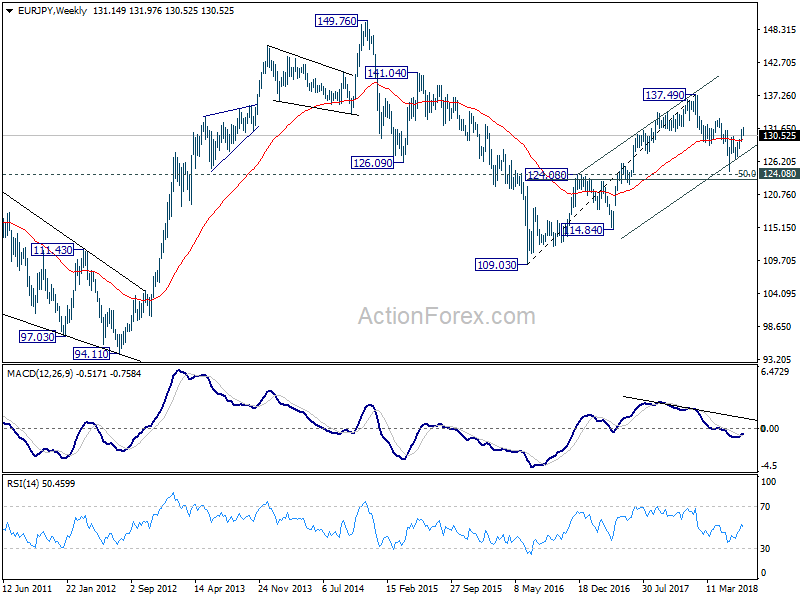
EUR/JPY edged higher to 131.97 last week but retreated since then. Initial bias is neutral this week for some consolidations first. But as long as 129.90 minor support holds, near term outlook stays bullish for another rally. On the upside, above 131.97 will target 100% projection of 124.61 to 130.33 from 127.13 at 132.85 next. However, considering bearish divergent condition in 4 hour MACD, break of 129.90 will indicate short term reversal, and turn bias back to the downside for 127.13 support.
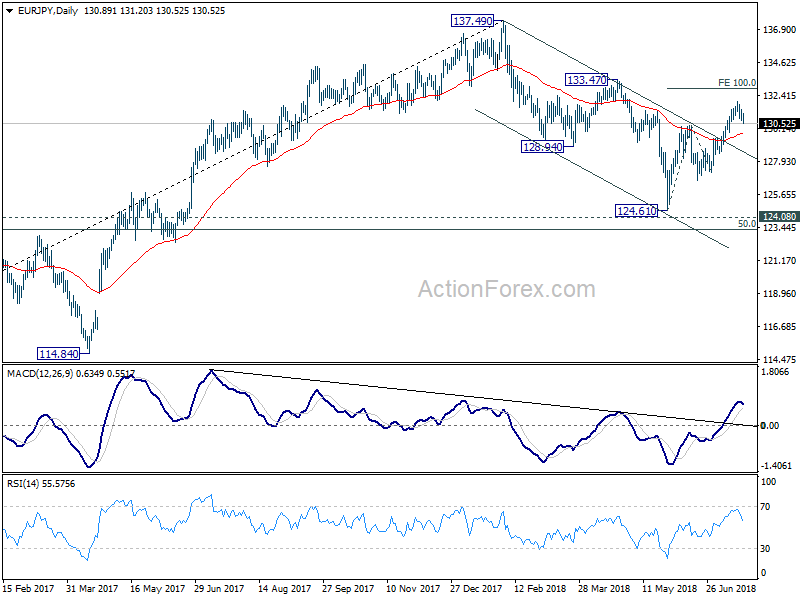
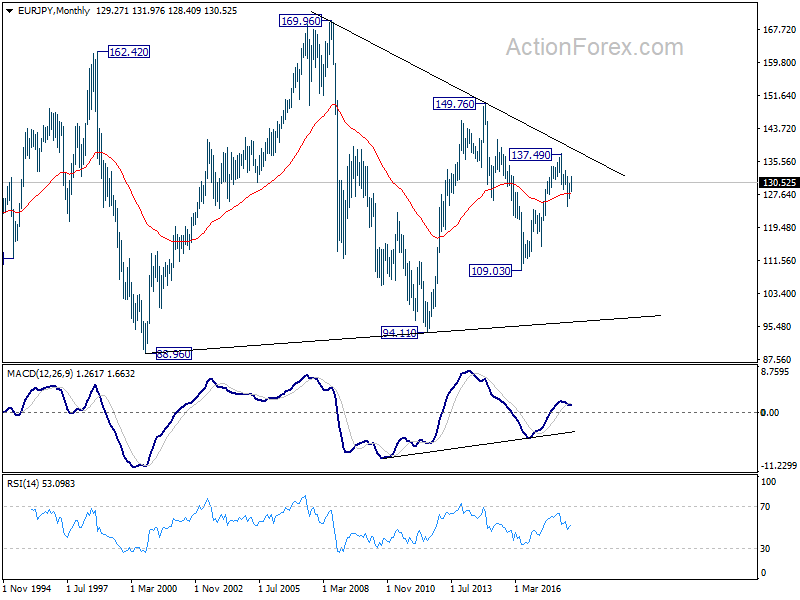
In the bigger picture, the strong break of channel resistance from 137.49 suggests that the decline from there has completed. The three wave structure suggests that it's a correction. With 124.08 key resistance turned support intact, medium term bullishness is also retained. Break of 133.47 will affirm this bullish case and target 137.49 and above. This will now be the favored case as long as 127.13 support holds.
In the long term picture, at this point, EUR/JPY is staying in long term sideway pattern, established since 2000. Rise from 109.03 is seen as a leg inside the pattern. As long as 124.08 support holds, further rally is in favor in medium to long term through 149.76 high. However, break of 124.08 could extend the fall through 109.03 low instead.
EUR/GBP Weekly Outlook
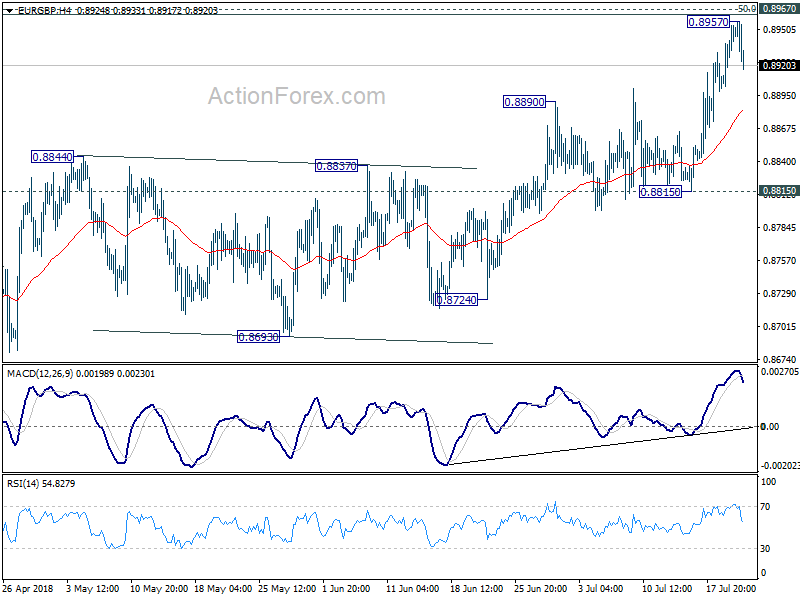
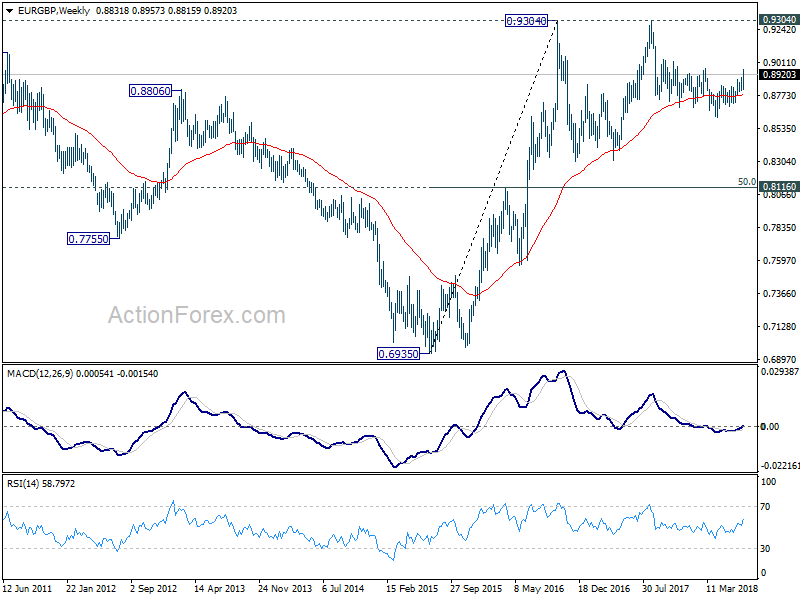
EUR/GBP rose further to as high as 0.8957 last week despite some hesitations. Nonetheless, it lost momentum ahead of 0.8967 cluster resistance (50% retracement of 0.9305 to 0.8620 at 0.8963) and retreated. Initial bias is neutral this week for some consolidations first. For now, as long as 0.8815 support holds, further rally is expected in the cross. Sustained break of 0.8967 cluster resistance should confirm completion of whole decline from 0.9305. EUR/GBP should then target 61.8% retracement at 0.9043 next.
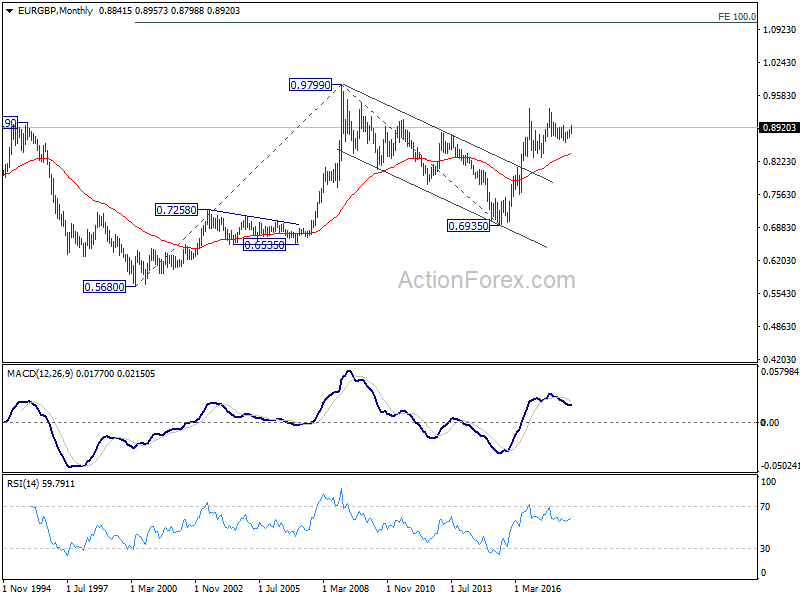
In the bigger picture, EUR/GBP is staying in long term range pattern from 0.9304 (2016 high). The corrective structure of the fall from 0.9305 to 0.8620 is raising the chance that rise from 0.8312 to 0.9305 is an impulsive move. But we're not too confident on it yet. In any case, we'd stay cautious on strong resistance from 0.9304/5 to limit upside in case of further rally. Meanwhile, if there is another medium term decline, strong support will likely be seen from 0.8303 to contain downside.
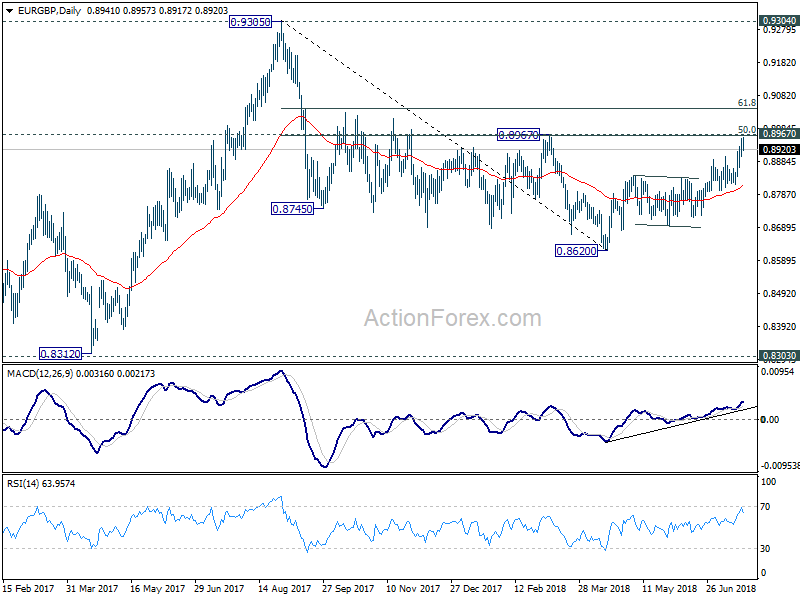
In the long term picture, we're holding on to the view that rise from 0.6935 (2015 low) is resuming the up trend from 0.5680 (2000 low). Hence, after the consolidation from 0.9304 completes, we'd expect another medium term up trend through 0.9799 to 100% projection of 0.5680 to 0.9799 from 0.6935 at 1.1054.
EUR/AUD Weekly Outlook
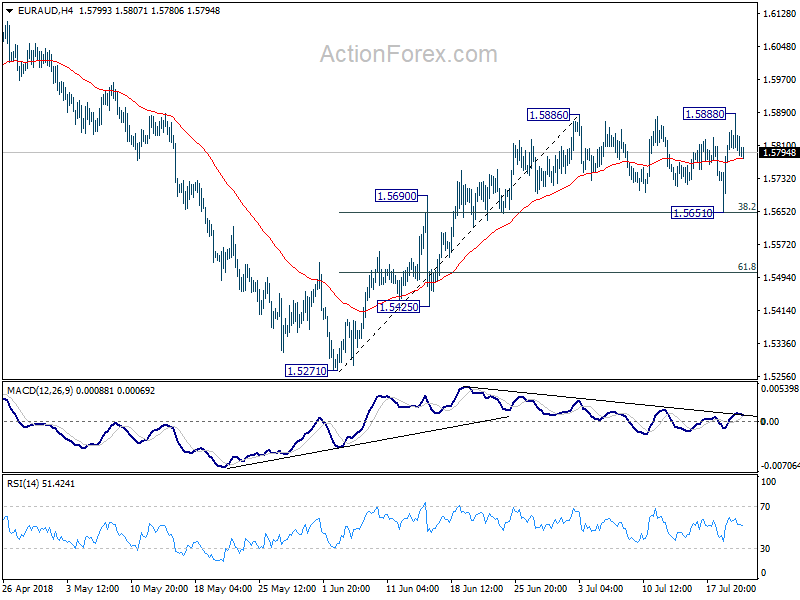
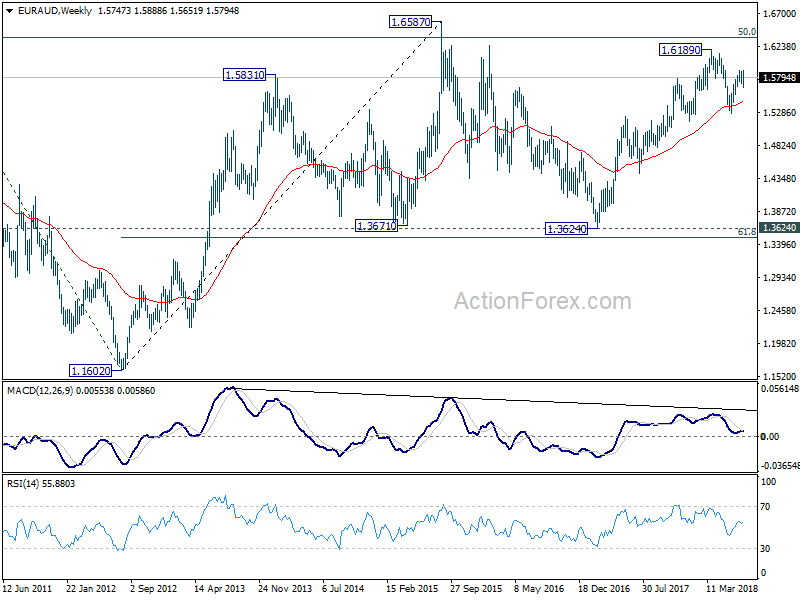
EUR/AUD dropped sharply to 1.5651 last week but drew immediate support from 38.2% retracement of 1.5271 to 1.5886 at 1.5651 and rebounded. The development suggests that rise from 1.5271 is not completed yet. Initial bias is neutral this week first for some more consolidative sideway trading. On the upside, break of 1.5888 will resume the rise from 1.5271 and target 1.6139/89 resistance zone.
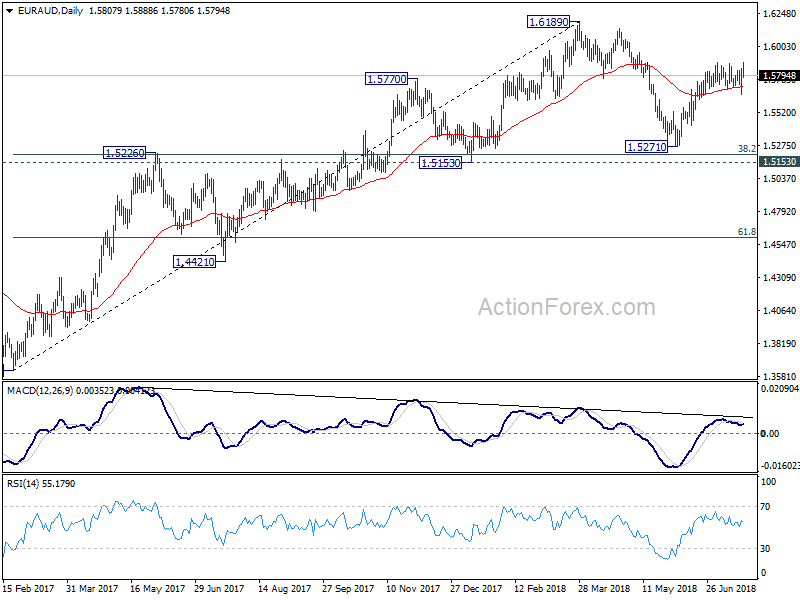
In the bigger picture, current development suggests that fall from 1.6189 is a corrective move and has completed at 1.5271 already. Key support levels of 1.5153 and 38.2% retracement of 1.3624 to 1.6189 at 1.5209 were defended. And medium term rise from 1.3624 (2017 low) is still in progress. Break of 1.6189 will target 1.6587 key resistance (2015 high).
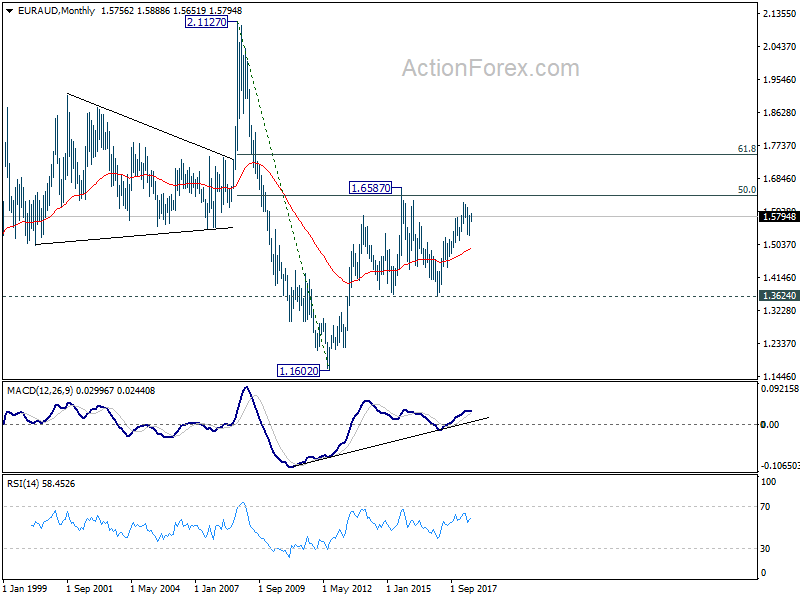
In the longer term picture, the rise from 1.1602 long term bottom (2012 low) isn't over yet. We'll keep monitoring the development but there is prospect of extending the rise to 61.8% retracement of 2.1127 to 1.1602 at 1.7488 and above. However, sustained trading below 1.3624 key support should indicate long term reversal and target 1.1602 long term bottom again.
EUR/CHF Weekly Outlook
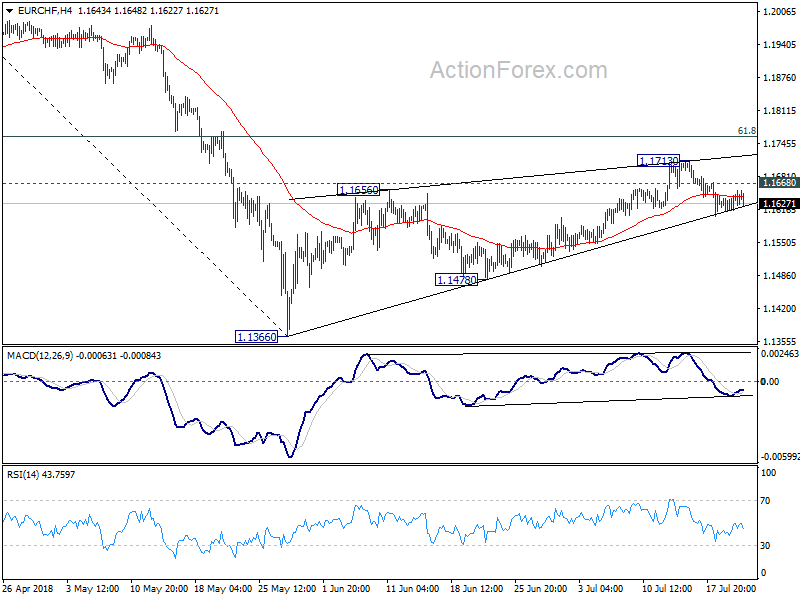
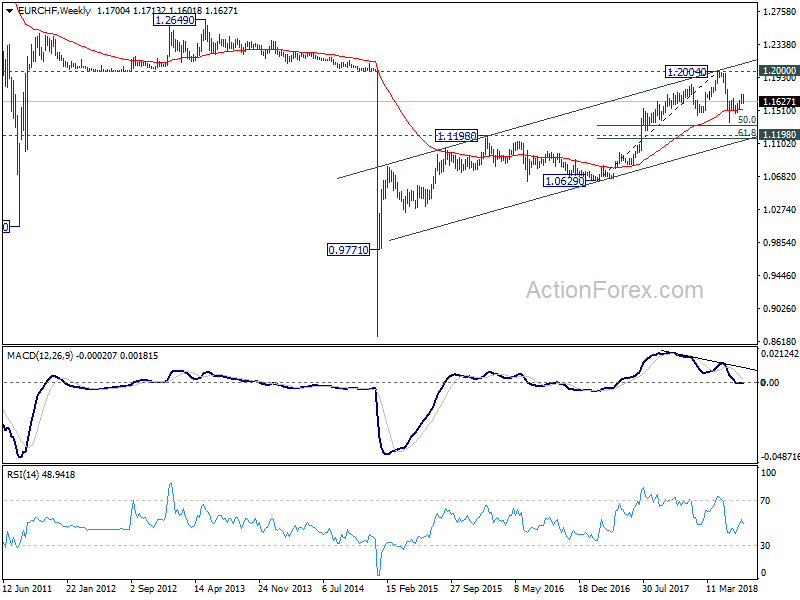
EUR/CHF edged higher to 1.1713 last week but dropped notably since then. The development argues that corrective rise from 1.1366 could have completed with three waves up to 1.1713 already. Further decline is expected this week as long as 1.1668 minor resistance holds, to 1.1478 support first. Break there will likely resume the whole corrective fall from 1.2004 through 1.1366 low. On the upside, above 1.1668 will bring another rise. But in the case, we'd continue to expect strong resistance from 61.8% retracement of 1.2004 to 1.1366 at 1.1760 to bring near term reversal.
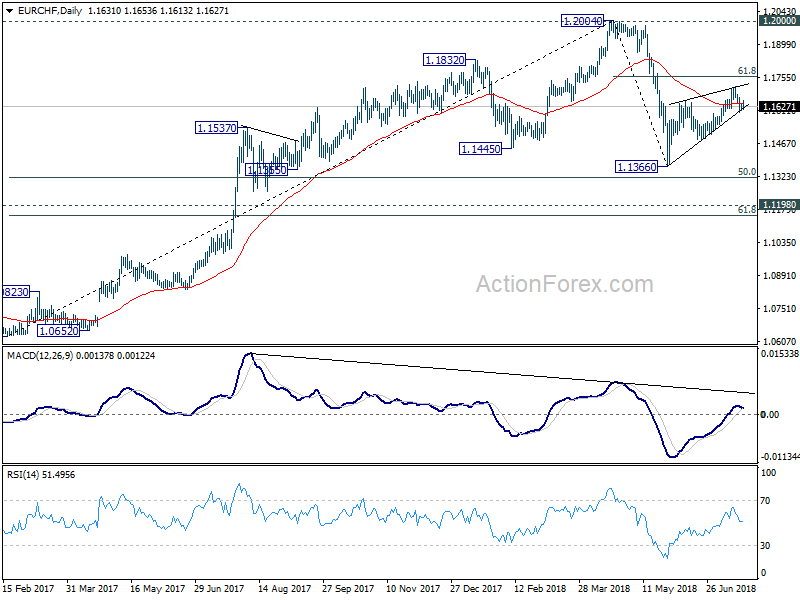
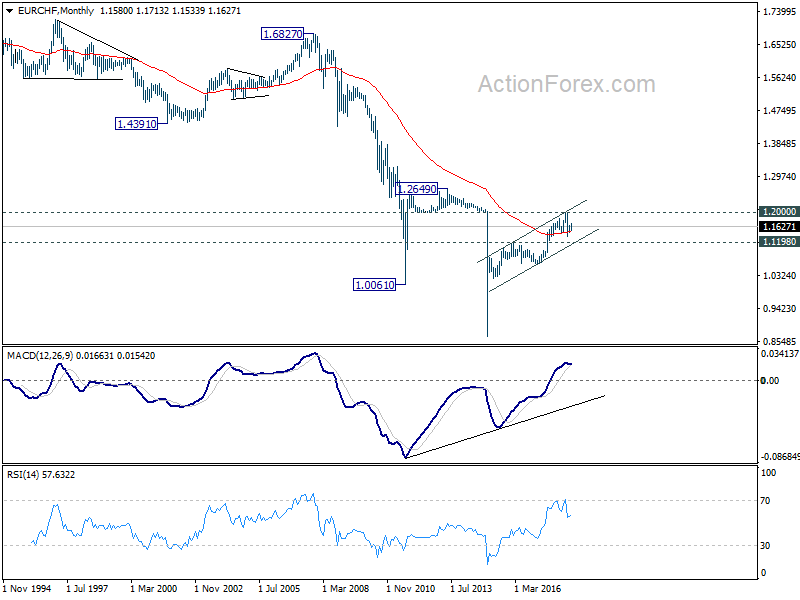
In the bigger picture, 1.2004 is seen as a medium term top with bearish divergence condition in daily and weekly MACD. 1.2000 is also an important resistance level. Hence, the corrective pattern from 1.2004 is expected to extend for a while before completion. We're not anticipating a break of 1.2004 in near term. Another decline cannot be ruled out yet. But in that case, strong support should be seen at 1.1198 (2016 high), 61.8% retracement of 1.0629 to 1.2004 at 1.1154 to contain downside.
How Did Stocks, Bonds and Dollar React to Trump’s Attack on Fed?
Dollar was sold off sharply on Friday but, after all, it ended the week only as the third weakest. Sterling was the worst performing one after triple data disappointment, most notably CPI. The once done-deal BoE August rate hike is now back on the table. Australia Dollar ended as the second weakest one and that was a surprise given the stellar June Australian employment data. Swiss Franc and Yen were the strongest ones. But that was not due to risk aversion nor falling treasury yields.
Trump occupied a lot of headlines with his summit with Russian President Vladimir Putin in Helsinki, for the earlier part of the week. But it was an oddly-timed CNBC interview at the White House that caught the most attentions of market traders. There Trump doubled down on trade war rhetorics with China again, threatened to impose tariffs on up to USD 500B in Chinese imports, that is, all of them. Trump also attacked Fed on its policy normalization which is seen by some as verbal intervention. Later on Friday, he went further to call China and EU as manipulating their currencies and tweeted that Fed's "tightening now hurts all we have done".
Some attributed Trump's attack on Fed as the trigger for the Dollar selloff. But we find that theory difficult to agree to.
Market's price on Fed's rate path firmed up last week.
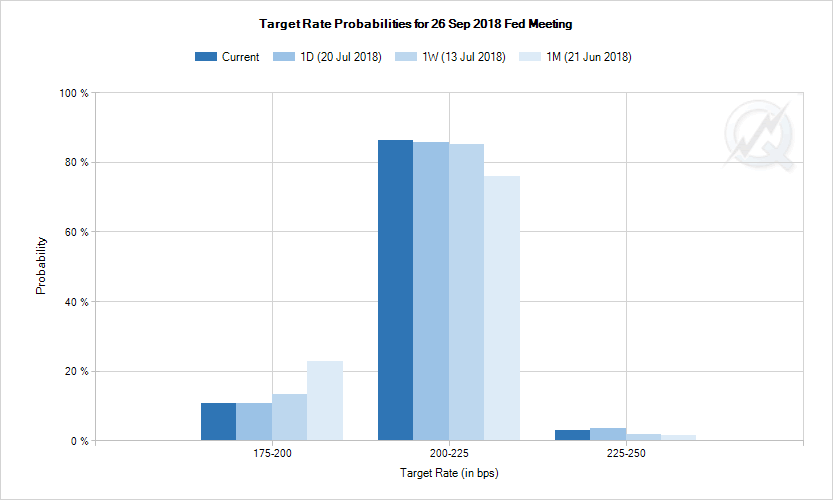
First, let's look at market pricing of Fed's rate path. For September FOMC meeting, Fed fund futures are now pricing in 89.2% change of a 25bps hike to 2.00-2.25% and above. That compares to 89.2% a day ago, 86.7% a week ago and 77.3% a month ago.
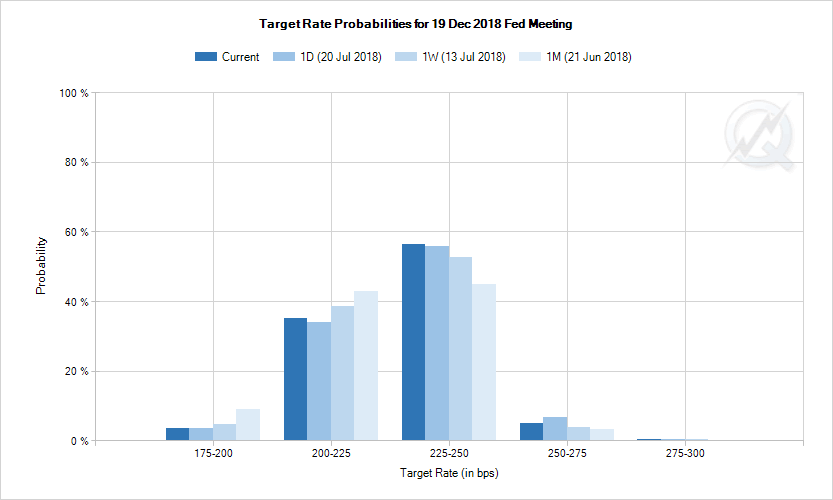
For December meeting, Fed fund futures are pricing in 61.3% chance of another hike to 2.25-2.50% and above. That compares to 62.32% a day ago, 56.5% a week ago and 48.2% a month ago. That is, market expectations on Fed's rate path this year hasn't changed much on Friday. And the expectation has indeed firmed up comparing to a week and a month ago.
Stocks didn't cheer an easier Fed, bounded in tight range
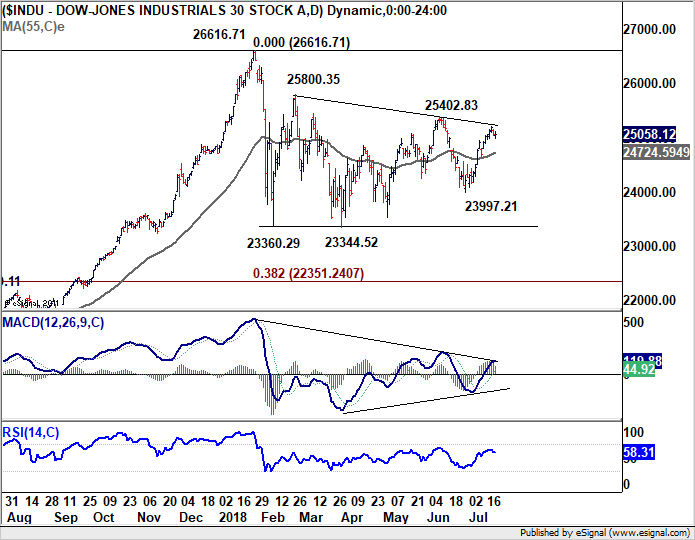
DOW closed Friday down just -0.03% at 25058.12. Over the week, DOW edged higher to 25215.32 before closed up just 0.15%. It's week of rather subdued trading with only 235 pts range. S&P 500 closed the week up 0.02% at 2801.83, with a weekly range of 27.5 pts range. NASDAQ hit record high at of 7867.15 but pared gains to close the week down -0.07% at 7820.20. It doesn't look like there was any investor cheering that Fed will slow down monetary policy normalization.
Yield curve steepened sharply as 30 year yield surged
30 year yield closed Friday up strongly by 0.064 at 3.031, much more than enough to regain the 3% handle. Some analysts explained the rise as speculations that Trump would eventually make (one way or the other) Fed slow down the pace of policy normalization. And with the massive fiscal stimulus in place, the economy is ready to heat up with surge inflation expectation.
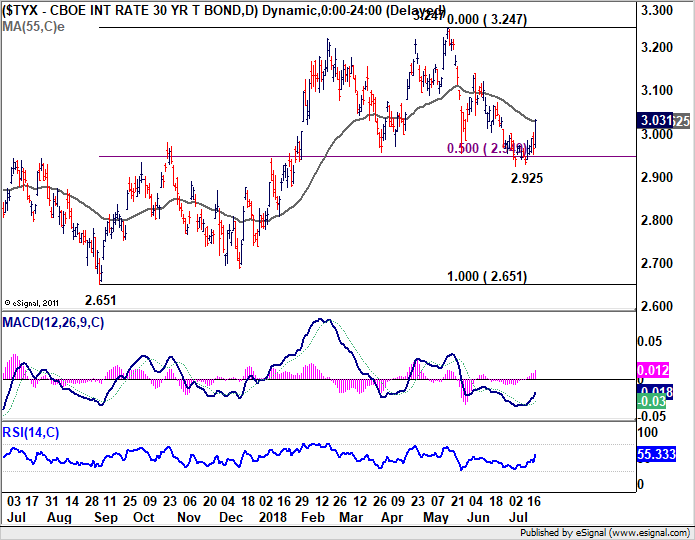
However, it should be noted that firstly, some Fed officials have repeatedly expressed their concerns on flattening yield curve, and warned of further hikes that could invert it. Now, with relatively much larger jump in 30 year yield, the yield curve has indeed steepened, which gives Fed more room to continue with rate hike.
Secondly, as Fed chair Powell noted in his testimony, yield at the long end gives an indication on where the neutral rate is. That is, rising 30 year yield could indicate a higher neutral rate, and give Fed more numbers of hikes before interest rates hits restrictive region. Thus, it should be Dollar positive, but we saw dollar dropped sharply instead. So, we're "not too happy" with such explanation.
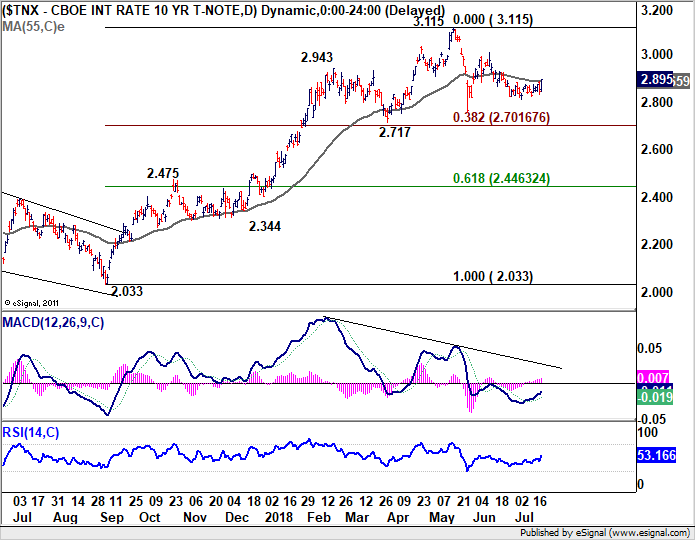
10 year yield did close up 0.048 on Friday to 2.895. But percentage-wise and structure-wise, the rise in TNX is not in proportion to that of TYX. So, that adds further to our doubt it's driven by expectation of surging inflation. If the surge in TYX is due to expectation that heating up trade war will eventually leads to higher inflation, it's not reflected equally in 10 year yield.
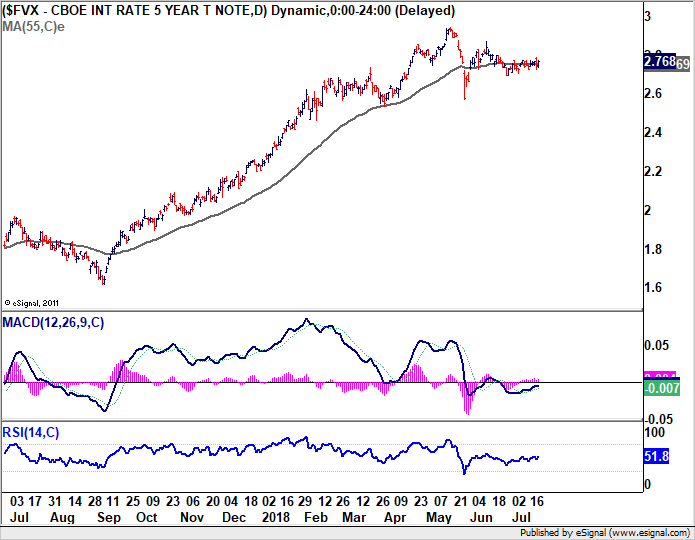
At the same time, we're not seeing any movement in 5 year note yield at all. It closed Friday up 0.028 to 2.768. But that's part of recent gyration around the 55 day EMA. 2 year note yield closed up 0.04 to 2.599, which doesn't suggest any one paring expectation of slower Fed normalization neither.
The above observations just don't, and cannot, add up to the story that "Trump's attack on Fed drove down Dollar". To us, it's as simplistic as Trump's scapegoating of other people like Trudeau, the EU, and possibly Fed Powell in the future, if we simply claim he talked down the Dollar.
China has possibly intervened to halt Yuan's decline
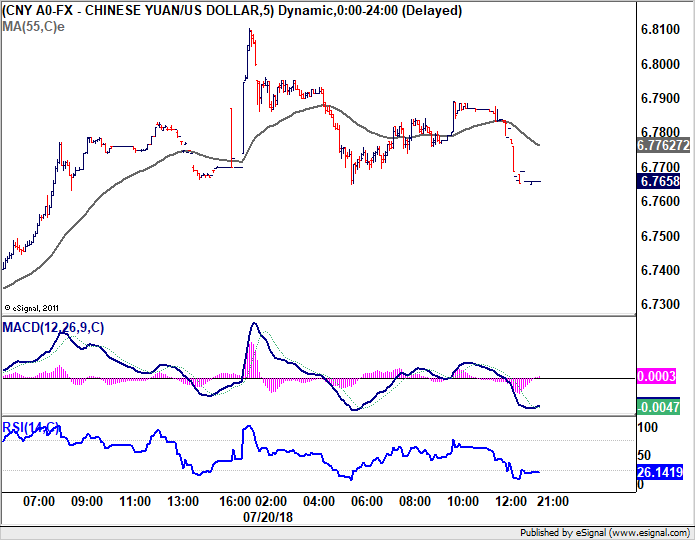
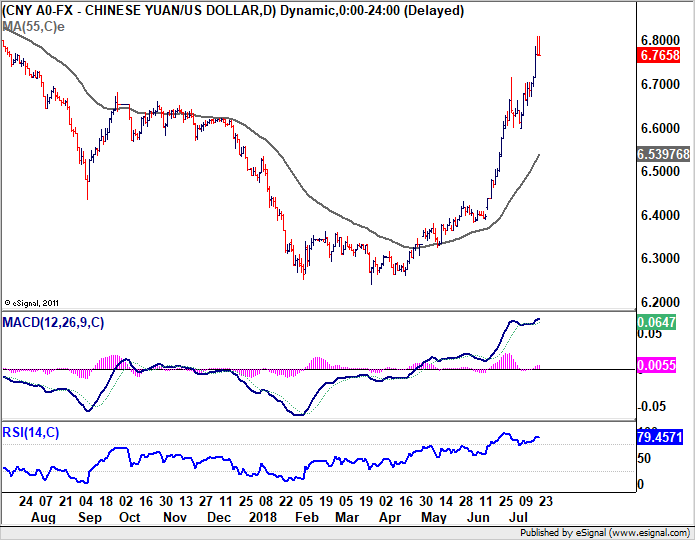
On Friday, there was another piece of news that's worth a mention. It's reported that just as USD/CNY (onshore Chines Yuan) hit 6.81, a state-owned bank has stepped in selling Dollar to buy Yuan to support the currency. 6.8 is seen by some as the "red line" for intervention by the Chinese government. USD/CNY then dipped to as low as 6.764 before recovering to 6.789 and then dived again after hours to 6.765.
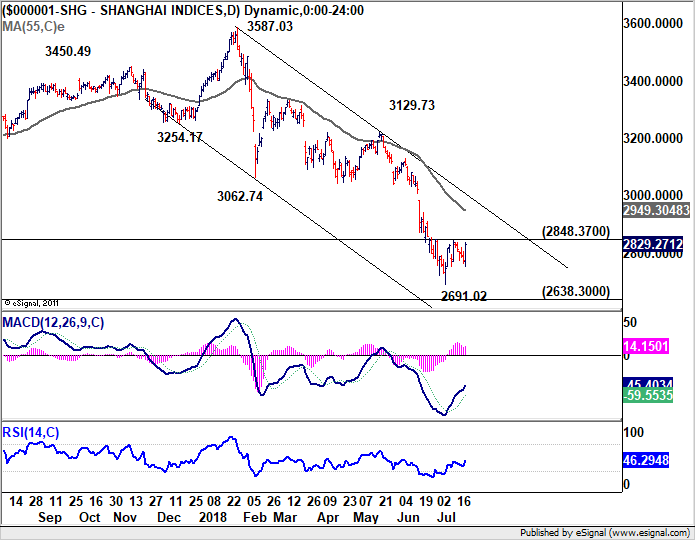
The "intervention" helped lift China Shanghai SSE composite up 2.05% on Friday to close at 2829.27, regaining 2800 handle. Hong Kong HSI also closed up 0.76%. For those who've been observing the Asian markets closely, it's known that the free fall in Yuan since March was one of the key factors that hammered Chinese stocks. And we've mentioned numerous times that the the zone between 2016 low of 2638.30 and 2700 in SSE is somewhere that could prompt government intervention. There are enough reasons to believe that the Chinese government did step in to halt the Yuan's slide to help support the stock markets. And try to give SSE a little push to make the rebound from 2691 self-sustainable.
Will Mnuchin ask China not to manipulate Yuan to stop its free fall?
US Treasury Secretary Steven Mnuchin said on Friday that the US is going to "very carefully review whether they have manipulated the currency", referring to China. Now it's getting more apparent that China is manipulating its currency to halt its slide, Mnuchin should come out and ask them not to do it again. (Or he actually wants to see it happen?)
Linking up the observations
Anyway, let us first repeat here again that we do not believe Trump's attack on Fed has triggered any realistic change in market expectations on Fed's rate path. Then, the movements in treasury yields were rather uneven that prompted us to suspect if there was any targeted selling in 30 year bond. Chinese Yuan is believed to have fallen to the red line that could have triggered government intervention already. Trump's threat of tariffs of USD 500B of product is something that China cannot match tit-for-tat.
So, is a large US treasury holder starting to sell its holdings and switch the fund out of Dollar to other assets, say, Swiss Franc? If it's what happened, it could have been reflected in the surge in 30 year yields and dive in Dollar.
Well, up to this point, it's just ungrounded conspiracy only. Nonetheless, the above story could make some good alternative entertainment if you're tired of political reality shows.
Dollar index to have more consolidation ahead, but stays bullish
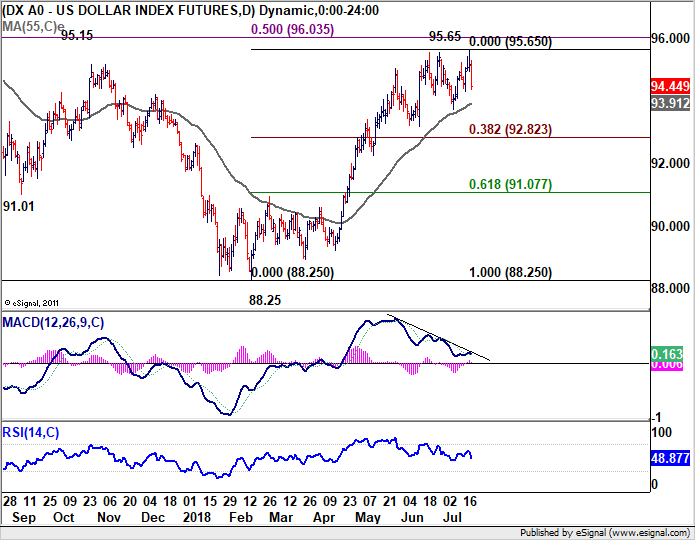
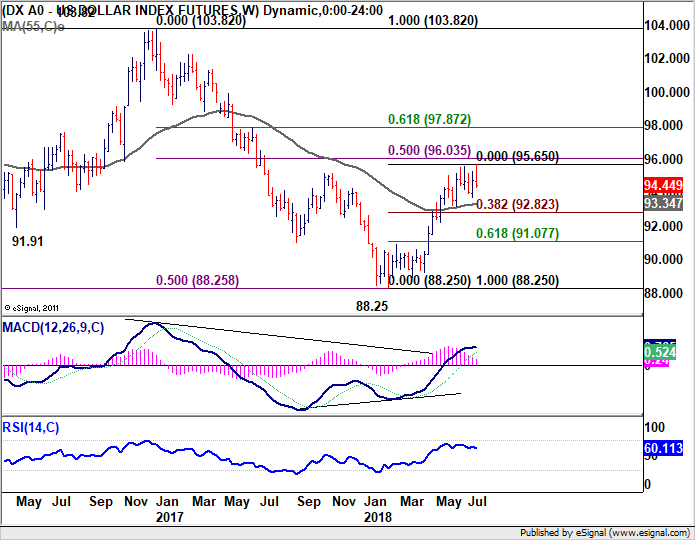
Now, back to business. Despite edging higher to 95.65, Dollar index dropped sharply since then. Together with bearish divergence condition in daily MACD, dollar index should have formed a short term top already. More consolidative trading would be seen in near term, with risk of pull back to 55 day EMA (now at 93.91) and below. But, we'd expect strong support from 38.2% retracement of 88.25 to 95.65 at 92.82 to contain downside to bring rebound. Rise from 88.2 is expected to resume at a later stage, after the correction completes.
Position trading strategy
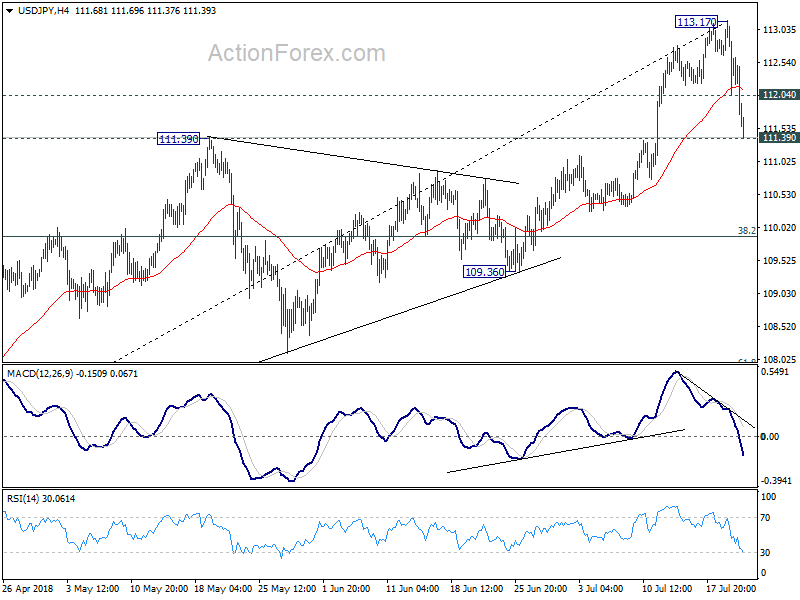
In last weekly report, we had a strategy of buying USD/JPY of a pull back. But that was cancelled on Friday as the order was not filled before USD/JPY rose to 113.17 and form a short term top there. It's updated in the quick comments here during Friday morning.
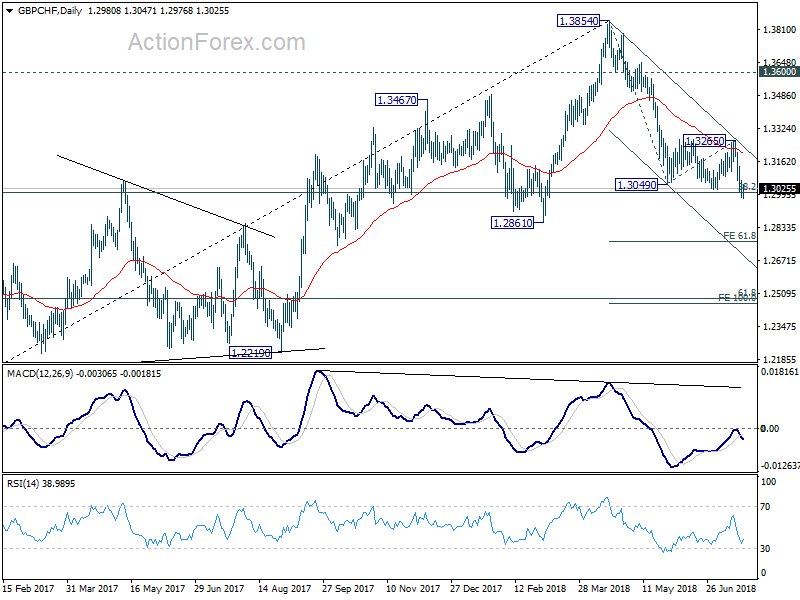
During the week, after UK CPI miss, we called for selling GBP/CHF in a quick comment. And it's sold at 1.3060. GBP/CHF then edged lower to 1.2976 but there was no follow through selling seen. We're staying bearish in the cross. But as it's close to 38.2% retracement of 1.1638 to 1.3854 at 1.3007, we'd prefer to hold the short position but tighten up the stop and lower it to 1.3060 (breakeven ) to guard against a rebound. Still, we're expecting the fall from 1.3854 to extend to 61.8% projection of 1.3854 to 1.3049 from 1.3265 at 1.2768 as first target. And there is prospect of extending to 100% projection at 1.2460 in medium term.
USD/JPY Weekly Outlook
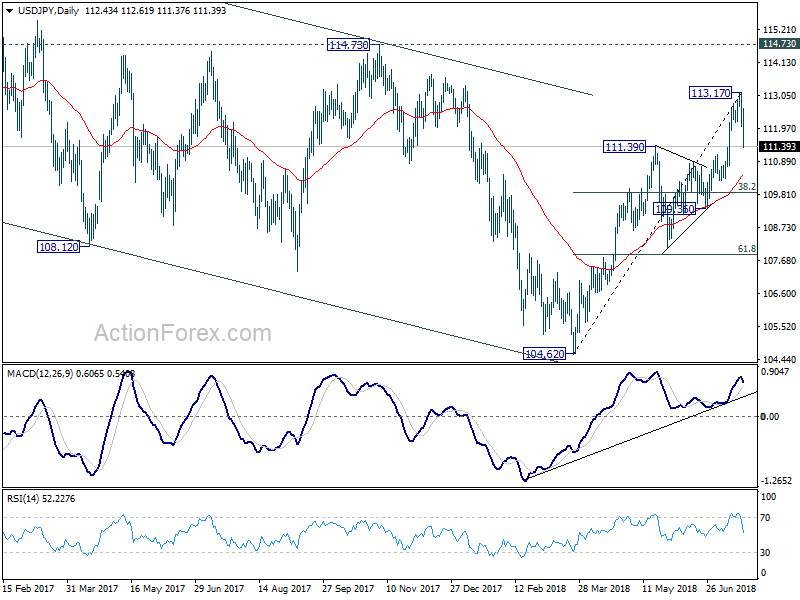
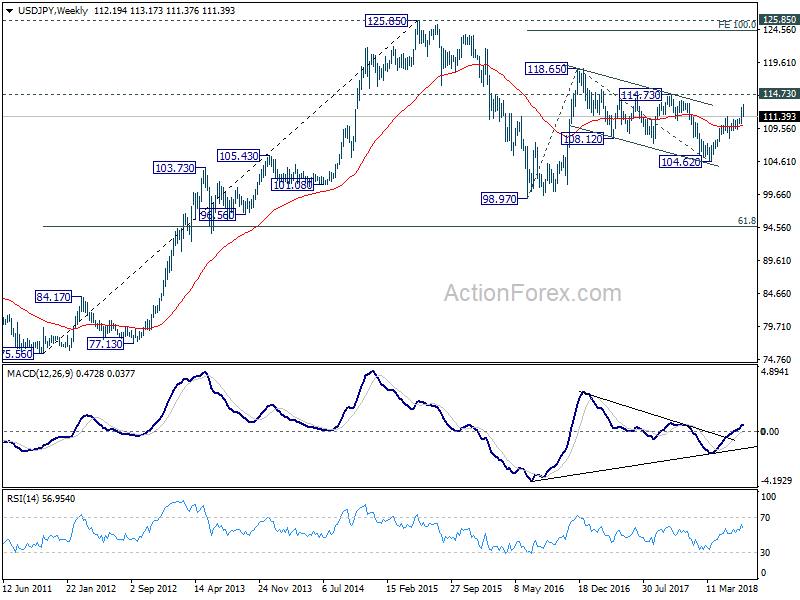
USD/JPY edged higher to 113.17 last week but subsequent sharp fall indicates short term topping. Breach of 111.39 resistance turn support argues that it's now corrective whole rise fro 104.62. Initial bias remains on the downside this week for 55 day EMA (now at 110.39). We'd expect strong support from 38.2% retracement of 104.62 to 113.17 at 109..90 to contain downside and bring rebound. On the upside, above 112.04 minor resistance will turn intraday bias neutral first. But break of 113.17 is needed to confirm up trend resumption. Otherwise, more condition would be seen with risk of another fall.
In the bigger picture, corrective fall from 118.65 (2016 high) should have completed with three waves down to 104.62. Decisive break of 114.73 resistance will likely resume whole rally from 98.97 (2016 low) to 100% projection of 98.97 to 118.65 from 104.62 at 124.30, which is reasonably close to 125.85 (2015 high). This will now be the preferred case as long as 119.36 support holds.
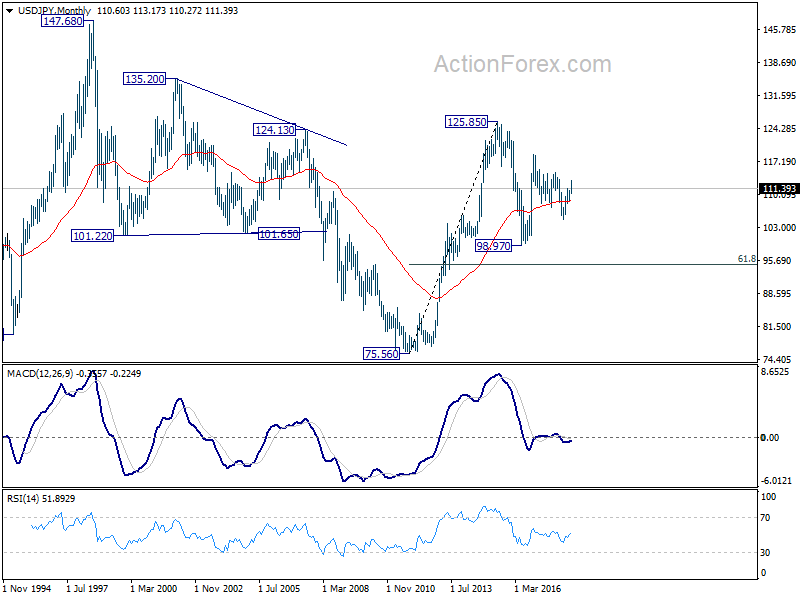
In the long term picture, the rise from 75.56 (2011 low) long term bottom to 125.85 top is viewed as an impulsive move, no change in this view. Price actions from 125.85 are seen as a corrective move which could still extend. In case of deeper fall, downside should be contained by 61.8% retracement of 75.56 to 125.85 at 94.77. Up trend from 75.56 is expected to resume at a later stage for above 135.20/147.68 resistance zone.
Summary 7/23 – 7/27
Monday, Jul 23, 2018
[php_everywhere instance="1"]
Tuesday, Jul 24, 2018
[php_everywhere instance="2"]
Wednesday, Jul 25 2018
[php_everywhere instance="3"]
Thursday, Jul 26, 2018
[php_everywhere instance="4"]
Friday, Jul 27, 2018
[php_everywhere instance="5"]
Weekly Economic and Financial Commentary: Slack Remains in the Economy, but Signs of Tightening
U.S. Review
Slack Remains in the Economy, but Signs of Tightening
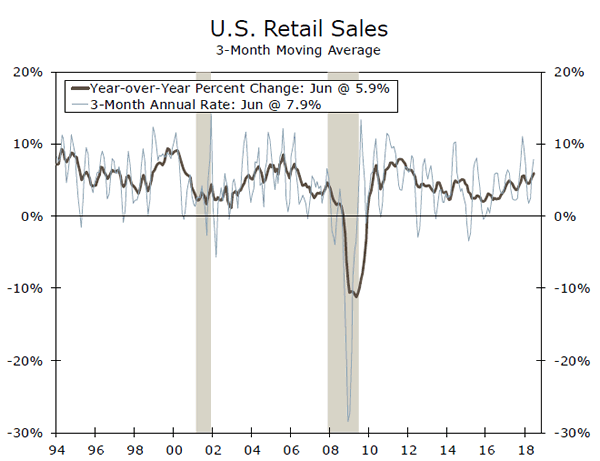
- Retail sales rose 0.5 percent in June, while May's gain was revised up from 0.8 percent to a robust 1.3 percent. The overall strong pace of retail sales growth puts the consumer on track to drive real GDP growth in Q2, after a weak Q1.
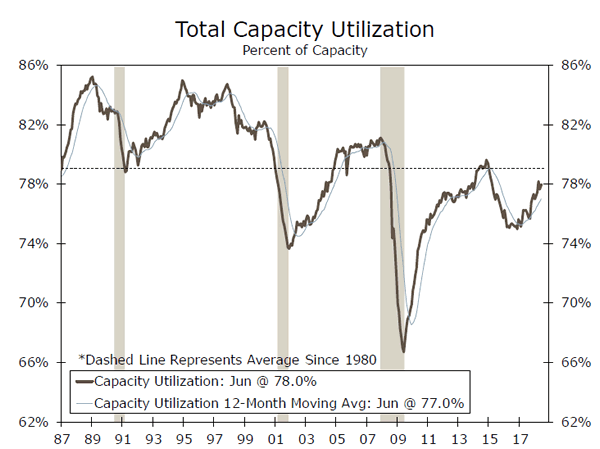
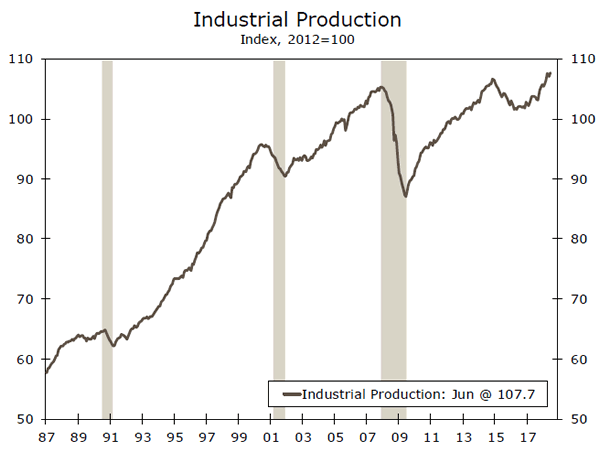
- Industrial production grew 0.6 percent in June to reach a new high. Capacity utilization rose but is still below its historic average, suggesting that slack remains.
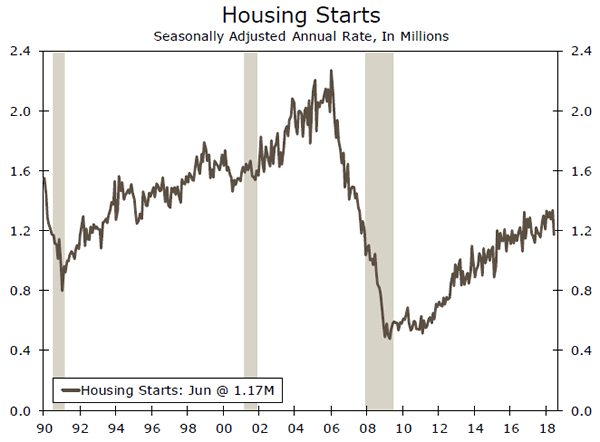
- Housing starts fell 12.3 percent in June, as builders face rising materials costs and increasing labor shortages as barriers to starting construction.
Slack Remains in the Economy, but Signs of Tightening
Retail sales rose 0.5 percent in June, while May's gain was revised up from 0.8 percent to a robust 1.3 percent. Contributing to the strong pace of headline growth were big gains in sales at car dealerships and gasoline stations. Higher prices at the pump have helped to boost gasoline sales, which are up 21.6 percent year-overyear. Core "control" group retail sales were flat in June, however, as sales declined at general merchandise and clothing stores. The overall strong pace of retail sales growth puts the consumer on track to drive real GDP growth in Q2, after a weak Q1.
Industrial production also looked strong in June, with the index growing 0.6 percent to reach a new high. The June improvement had much to do with a recovery in manufacturing output, coming after a fire at a motor vehicle and parts manufacturing plant disrupted production in May. Output from the manufacturing sector rose 0.8 percent in June, while mining output rose 1.2 percent. Utilities output was the drag, falling 1.5 percent.
Despite tariffs on steel and aluminum imposed in March and expanded to all major trading partners in June, primary metal manufacturing was essentially flat in June. Output of iron and steel products fell 0.8 percent, while aluminum and production and processing declined 3.0 percent. We expect production to expand at least somewhat in the months ahead. Capacity utilization is still below its historic average in the manufacturing sector, at 75.5 percent in June, suggesting that slack remains, and can be deployed to increase production if demand warrants. This contrasts with the mining sector, where an energy-driven rebound has pushed capacity utilization up to a very tight 92.7 percent.
In the housing sector, lack of supply continues to limit sales despite healthy demand for homes. Housing starts came in well below expectations in June, falling 12.3 percent on the back of declines in single-family and multifamily starts. Builders continue to cite rising materials costs as a challenge. Higher prices for steel and softwood lumber, key inputs, likely mean that fewer construction projects are viable. Labor is also becoming scarcer as the economy tightens, another limiting factor. Without a significant pickup in housing starts, the supply of homes available for sale is likely to remain low, and prevent home sales from taking off.
Construction was the only component that weighed on the leading economic index (LEI) in June. The index advanced 0.5 percent, with building permits shaving off 0.6 percentage points. The largest positive contributor was ISM new orders.
Strength in the LEI, which is a composite of ten indicators covering a broad swathe of the economy, is consistent with our generally positive outlook for the United States economy. We expect real GDP growth of 3.1 percent in full-year 2018, which is the highest growth rate since 2005. However, expanding demand will eventually put constraints on supply of labor and resources, as we are seeing play out in the housing sector. We are watching wages and prices in other sectors for signs of growing capacity constraints, and sources of potential risk to our outlook.
U.S. Outlook
New Home Sales • Wednesday
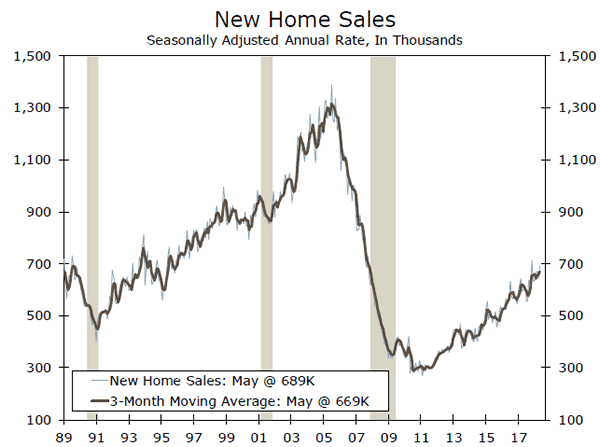
After falling 3.7 percent in April, new home sales rose 6.7 percent in May to a 689,000-unit pace. The housing market continues to be restrained by tight inventories of existing single-family homes, which is likely supporting a more rapid pace of new home sales. Although new home inventories are also low, builders remain relatively optimistic even as they continue to face rising materials costs amid recently-imposed tariffs.
The South remained a standout in May, with new home sales rising 17.9 percent to a new cycle high, while sales fell in the West and Northeast. Development in the South remains solid, where housing starts are up more than 13 percent in June from a year ago, and the region looks poised for further expansion. The average price of a home fell 2.6 percent from a year ago to $369,000 in May, likely due in part to increased sales in the South, where homes tend to be relatively more affordable.
Previous: 689K Wells Fargo: 665K Consensus: 670K
Durable Goods • Thursday
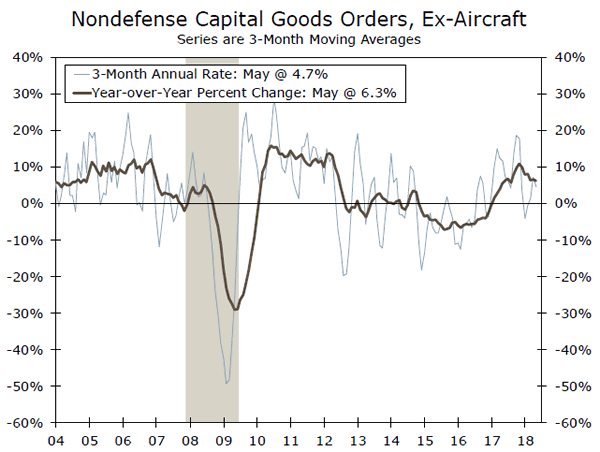
Durable goods orders fell 0.4 percent in May. This drop was a bit smaller than expected, due to the 15.5 percent surge in defense orders. Core capital goods orders were also upwardly revised to a 0.3 percent gain in May, coming on the heels of April's standout 2.0 percent increase. Shipments remained solid, rising 0.6 percent in the month. The June rebound in industrial production also suggests that durable goods orders are poised for a pickup in June. Unfilled orders continue to rise amid slower inventory growth, as businesses continue to face supply-chain constraints in meeting rising customer demand.
The recent pace of capex spending still represents a slowdown from the record pickup in spending registered in the second half of 2017. However, we look for durable goods orders to rise 3.2 percent in June, signaling a solid pace of equipment spending in the remainder of the year.
Previous: 0.4% Wells Fargo: 3.2% Consensus: 2.8% (Month-over-Month)
GDP • Friday
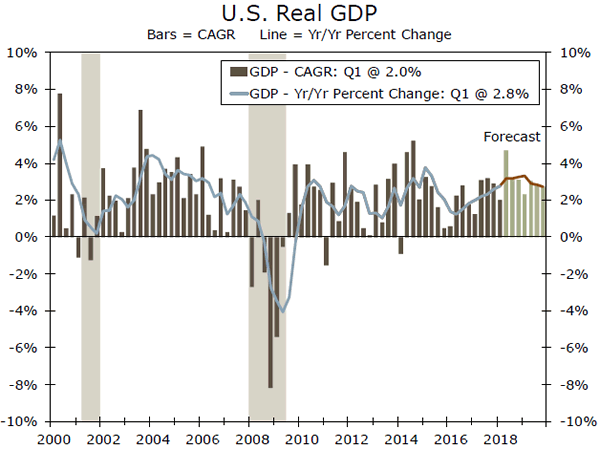
After rising a tepid 2.0 percent annualized in Q1, GDP growth is expected to rebound strongly in Q2. We look for GDP to rise to a 4.7 percent annualized pace amid a sharp narrowing in the trade deficit and pickup in consumer and business spending. Solid retail sales, rising wages and strong job gains support our forecast for consumer spending to rise to a 3.3 percent annualized clip. Business spending also likely remained solid, albeit growing at a slower rate than the run up seen in Q1. The pickup in durable goods orders and shipments noted above signals that equipment spending likely rose at a roughly 5 percent annualized pace. Q2 GDP also likely got a boost from stronger exports as businesses tried to get ahead of retaliatory tariffs, and we look for the narrowing in the trade deficit to add 1.2 percentage points to topline growth. The trends behind the likely Q2 rebound should support solid growth in H2-2018, although trade tensions present a possible downside risk to our outlook.
Previous: 2.0% Wells Fargo: 4.7% Consensus: 4.0% (Quarter-over-Quarter, Annualized)
Global Review
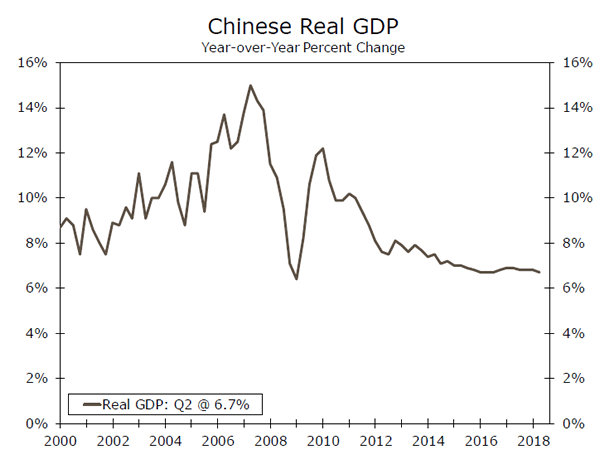
Chinese GDP Growth Slowed Marginally in Q2
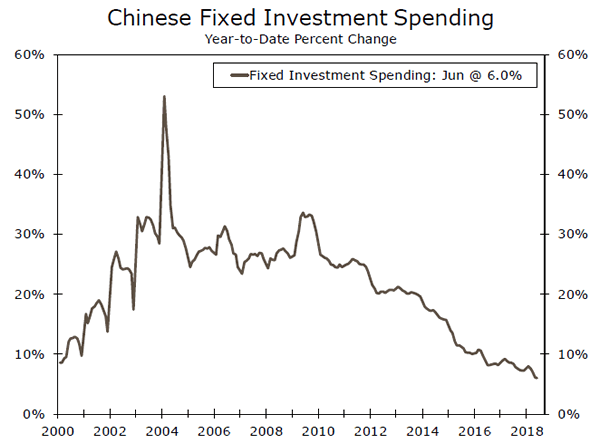
- Real GDP growth in China ticked lower in Q2 due, at least in part, to further deceleration in investment spending. We look for Chinese GDP growth to trend gradually lower in coming quarters.
Will the MPC Raise Rates Next Month?
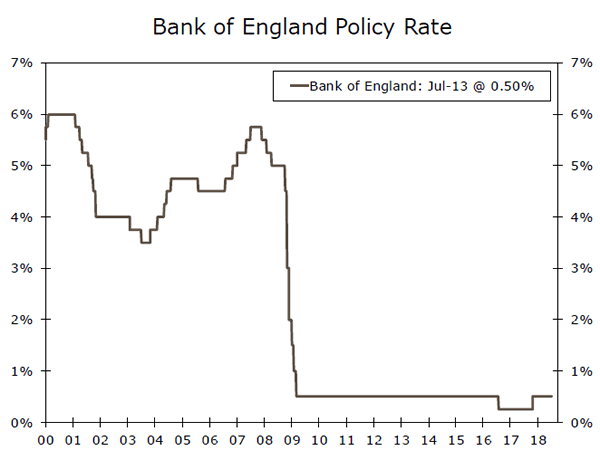
- Some high-profile data releases in the United Kingdom were weaker than expected this week. However, the British economy is hardly falling apart, and we still look for the Monetary Policy Committee to hike rates at its next policy meeting on August 2.
Chinese GDP Growth Slowed Marginally in Q2
Data released this week showed that the year-over-year rate of real GDP growth in China slowed marginally to 6.7 percent in the second quarter, from 6.8 percent in Q1-2018 (see chart on front page). A full breakdown of the GDP data into its underlying demand components is not readily available, but monthly economic indicators show that growth in investment spending, which has been behind the deceleration that has occurred in the Chinese economy over the past few years, slowed further in Q2 (top chart). We forecast that Chinese GDP growth will tick lower in coming quarters, but we do not look for the economy to experience a sharp downturn anytime soon. (For further reading see "China Mid-Year Economic Outlook" which is posted on our website.)
Will the MPC Raise Rates Next Month?
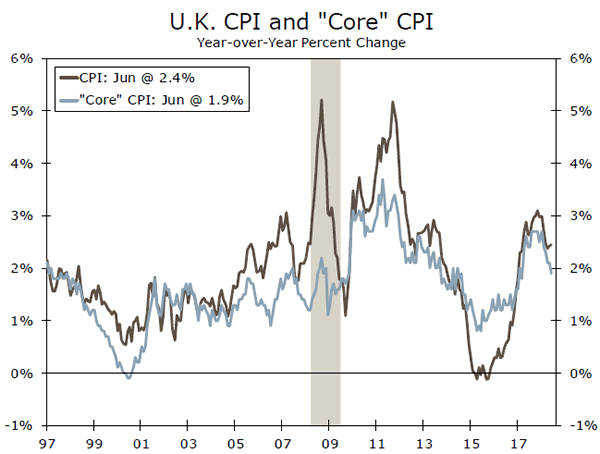
British economic data that were released this week cast some doubt on the widely-held expectation that the Monetary Policy Committee (MPC) of the Bank of England (BoE) will hike rates at its next policy meeting on August 2nd. For starters, inflation data for June were weaker than most analysts had expected. To wit, the overall rate of CPI inflation held steady at 2.4 percent, rather than ticking up as most analysts had expected, and the core rate of inflation dropped to 1.9 percent from the 2.1 percent rate that had been registered in May (middle chart). Furthermore, real retail sales slipped 0.5 percent in June relative to the previous month, significantly weaker than the modest increase that the consensus forecast had anticipated. If inflation is receding back toward the BoE's target of 2 percent and spending data are weaker than expected, why should the MPC be in a hurry to hike rates?
Although some of the data this week were modestly disappointing, the British economy is hardly falling apart. Even with the drop in retail sales in June, real retail spending was still up 2.1 percent (8.5 percent at an annualized rate) in the second quarter relative to Q1. Employment was up 137,000 workers in the March-May period relative to the preceding three-month period, and the unemployment rate held steady at its 43-year low of 4.2 percent. The U.K. Office for National Statistics estimates that real GDP rose 0.2 percent in April (not annualized) and another 0.3 percent in May.
At its most recent policy meeting on June 21, the MPC stated that "were the economy to develop broadly in line with the May Inflation Report projections, an ongoing tightening of monetary policy over the forecast period would be appropriate to return inflation sustainably to its target." The MPC currently forecasts that real GDP will grow roughly 1-¾ percent per annum over the next few years. The wiggles in recent data notwithstanding, U.K. GDP appears to be on track to grow more or less at this modest pace, which the MPC estimates is slightly higher than the long-run potential rate of growth. Moreover, three members of the ninemember MPC voted to raise ratesat the last policy meeting. With the policy rate at historically low levels (bottom chart), we believe that at least two more voters will join those three members, which will lead to a rate hike on August 2nd. Stay tuned.
Global Outlook
Eurozone PMIs • Tuesday
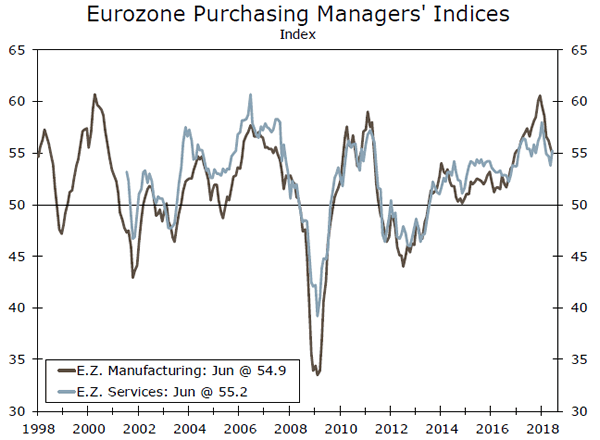
Some of the early Q3 readings on the Eurozone economy will print next week with Markit's Purchasing Manager Indices. As illustrated in the chart to the right, economic activity in Europe cooled somewhat in the first half of the year relative to H2-2017. That said, the June readings near 55 for the manufacturing and service sectors are consistent with a healthy expansion and economic growth that remains a bit above potential growth. So long as growth holds around current levels, it should be enough to gradually diminish remaining slack in the labor market and slowly push up core inflation.
The European Central Bank will also meet next week (Thursday). Any major policy move from the ECB is unlikely, but this will be the first meeting since June when the ECB laid out its tapering and rate hike paths. As a result, the ECB may take the opportunity to clarify anything that policymakers believe financial markets interpreted as too hawkish or dovish.
Previous: 54.9 (Services); 55.2 (Manufacturing) Consensus: 55.2 (Services); 54.8 (Manufacturing)
South Korea GDP • Wednesday
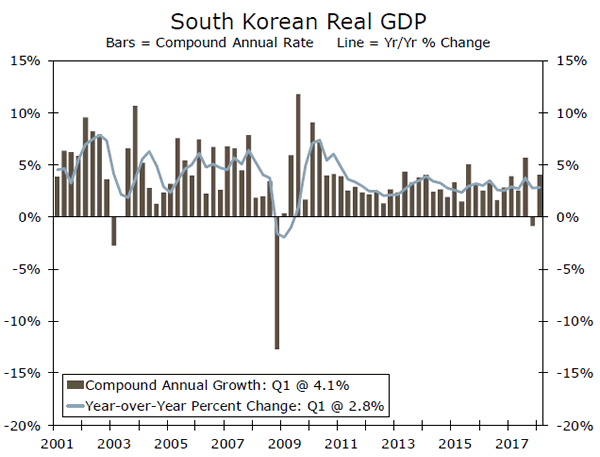
Economic growth in South Korea has been remarkably stable over the past few years. A weak Q4-2017 was sandwiched between two quarters of annualized real GDP growth above 4 percent. A soft print for personal consumption in Q1 was offset by strong growth in investment spending and robust export growth.
At its most recent policy meeting in July, the Bank of Korea held its policy rate steady and downgraded its 2018 growth projection to 2.9 percent from 3.0 percent previously, citing corporate earnings and trade tensions as causes for the adjustment. Trade tensions are a major source of uncertainty for the BoK, as total exports as a share of GDP are more than 50 percent. With inflation in check and unemployment still somewhat high for structural reasons, economic conditions are not yet completely supportive of less policy accommodation. Next week's GDP print will give policymakers a better sense of how far off the next rate hike remains.
Previous: 1.0% Wells Fargo: 1.0% Consensus: 0.7% (Quarter-over-Quarter)
Central Bank of Russia • Friday
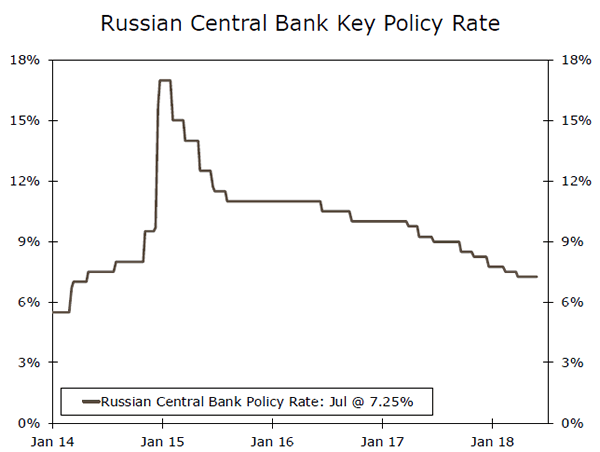
The Central Bank of Russia began cutting its main policy rate in 2017 as inflation finally receded from its double digit pace and the ruble found firmer footing. At its past couple meetings, however, monetary policy has held steady amid a mix of conflicting economic signals. Economic growth was up just 1.3 percent year over year in Q1-2018, a bit weaker than expected and suggesting more monetary policy easing might be in the cards.
However, inflation appears to be hitting a trough, as the central bank stated at its last meeting that the "balance of risks up to the end of 2019 have shifted towards proinflationary." In addition, the ruble has remained under some pressure since additional U.S. sanctions were announced in April; the ruble is down about 11 percent for the year against the dollar. With this combination of conflicting factors on policymakers' mind, the Bloomberg consensus looks for the central bank to remain on hold at its meeting next Friday.
Previous: 7.25% Consensus: 7.25%
Point of View
Interest Rate Watch
Questioning the Questions
Following Fed Chairman Jerome Powell's testimony this week, we were engaged by several questions (and answers) that appeared to be slightly at odds with how we view the state of economic affairs.
Wages, Inflation and Real Incomes
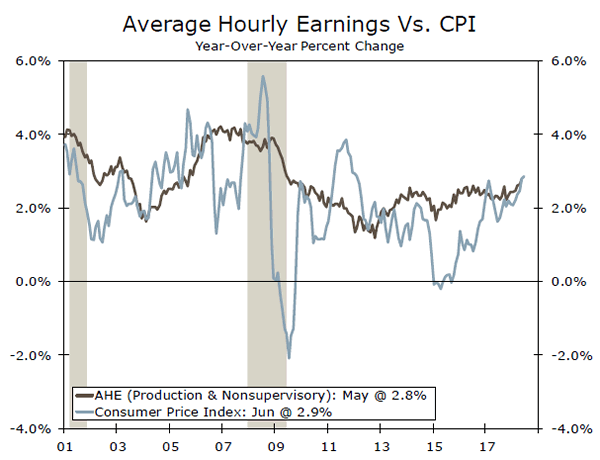
One assertion was that wages lag inflation, and that real wages have declined for many years. We find inflation has outpaced wages in only a handful of months since 2013 (top chart). Inflation evidences several spikes; but, over time, wages have exceeded inflation. Moreover, wages are only one form of compensation to workers—indeed, non-taxed health care benefits are an increasingly important part of labor compensation. To the point, real disposable income has grown 1.7 percent from a year ago, and at a 2.3 percent annualized rate over the past three months.
Loan Growth Has Slowed
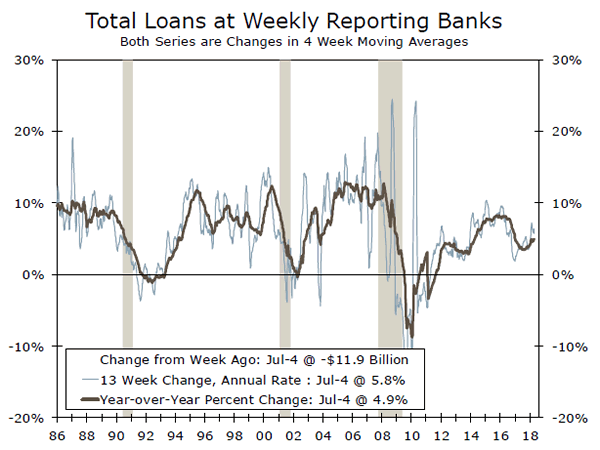
There was an additional assertion that loan growth has slowed to less than half of what it was during the last year of the Obama Administration. We find total loans at banks have continued to slow since their cycle high in late 2016 (middle chart). Over the past 13 weeks, loan growth has increased 5.8 percent, and is up 4.9 percent over the past year. However, loan growth was at no time double these numbers in the Obama Administration. Growth has not hit the 10 percent mark in this cycle.
Moreover, the character of credit in the economy has become far more broad-based over time. Credit is available in many forms and from many sources. According to the NFIB small business survey, the difference between firms reporting credit is harder versus easier to get is far below the peaks of 2009-2014 and consistent with past easy credit periods.
Inflation as Leading Inflation?
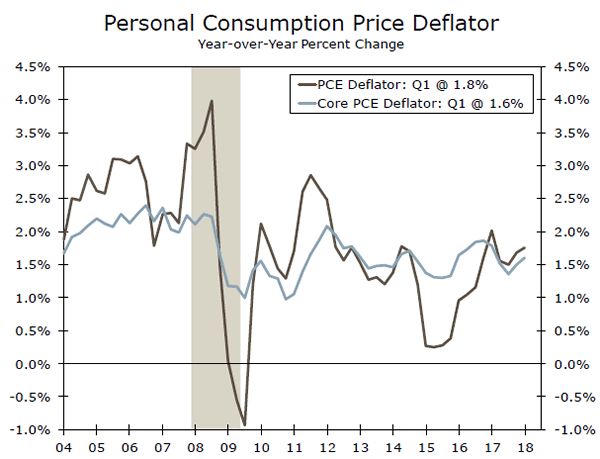
An additional assertion was that core inflation is a better indicator of future inflation than overall inflation. We find two way causality between core inflation and overall inflation (bottom chart). Both series come from the same source, the BLS, and core is part of overall inflation.
Credit Market Insights
Shifts in Mortgage Market
While presenting the Fed's semi-annual Monetary Policy Report to Congress this week, Fed Chair Powell stroke an optimistic tone on the economy. However, the report noted that "activity in the housing market has leveled off this year."
In his testimony, Powell expanded on some of the factors that are holding back activity in the housing market, stating that "there are probably significant numbers of credit worthy borrowers who are not getting access to mortgage credit." Mortgage lending standards at banks became much stricter after the recession, and have yet to return to historic norms, as banks remain cautious on lending. The Urban Institute's housing credit availability index, which measures default risk taken by the mortgage market, is still more than 50 percent below its average in the 2001-2003 period.
Mortgage rates are also moving up as the Fed tightens monetary policy. The average 30-year rate mortgage rate has increased 52 bps since the start of the year. At the same time, homes are becoming more expensive, with the Case-Shiller National Home Price Index up 6.4 percent on the year. The combination of rising home prices and higher mortgage rates stands to put further barriers in front of households looking to take out a mortgage.
However, strong employment gains and faster income growth should help mitigate the barriers facing prospective homebuyers. On balance, we expect modest gains in housing market activity over the next year.
Topic of the Week
Tallying Up Tariffs: The Effect on Inflation
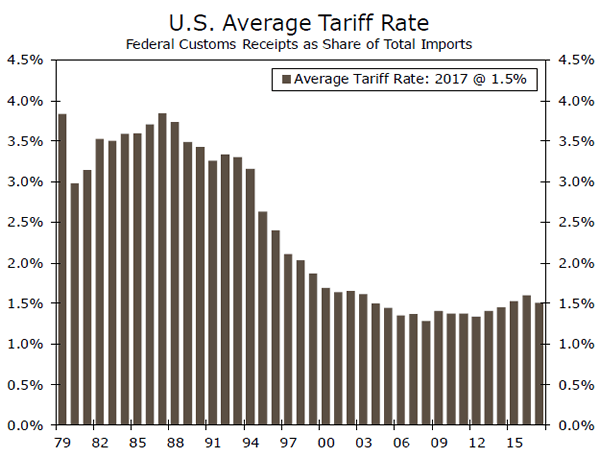
Trade tensions have been escalating since the spring, when President Trump announced tariffs on steel and aluminum imports. While effective tariffs on U.S. imports have fallen substantially since the mid-1980s (top chart), it is clear that rates are no longer declining.
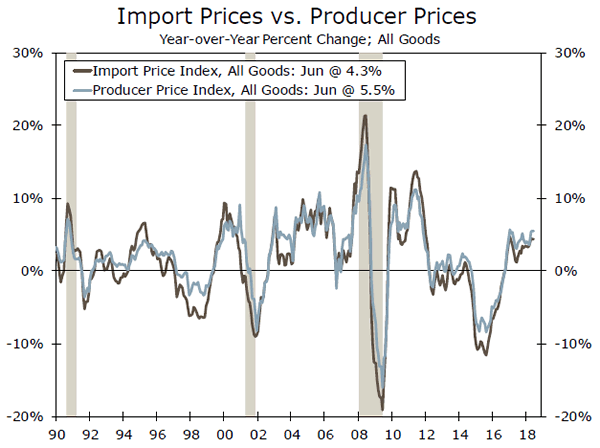
In total, the Trump administration's major tariff changes apply to $90 billion of U.S. imports, with an average rate of 22 percent. However, the value of proposed tariffs are materially higher. If enacted, they would add $485 billion to goods affected. One possible effect of tariffs is changes in the consumer price level. We expect the tariffs already imposed to increase headline CPI, which is currently at 2.8 percent, by 0.1 percentage point, keeping all other factors constant. Taking into account the additional tariffs being floated, the change in headline CPI would rise 0.5 percentage point.
Why is the change to headline CPI relatively small? Spending on consumer goods accounts for only about one-third of consumer outlays, so this limits the effect of higher goods prices on average consumer prices. Also, the majority of tariffs enacted are focused on intermediate goods. Relatively high profit margins mean that companies have the ability to absorb some increases in the cost of production without pushing price increases onto the consumer. Firms are also likely to re-adjust supply chains to avoid tariffs over time. A stronger U.S. dollar in the face of trade tensions and retaliatory tariffs, which can lead to increased domestic supply if fewer goods are exported, provide further offsetting effects.
Overall, effects of tariffs that have already been enacted should be small enough to where the Fed does not need to alter its current course of policy on the basis of inflation. The FOMC has stressed its willingness to accept a modest overshoot for a time given the symmetric nature of its inflation target. The additional proposed measures, however, stand to push inflation noticeably higher and weigh more meaningfully on real consumer spending.
For more on this topic, see our recent report "Tallying Up Tariffs: The Effect on Inflation" (July 19, 2018)