Sample Category Title
Dollar Shrugs off Soft CPI, Pushes Yen to 6-Month Low
The Japanese yen continues to post losses this week. In Thursday’s North American session, USD/JPY is trading at 112.50, up 0.44% on the day. On the release front, the focus is on inflation reports. CPI edged down to 0.1%, shy of the forecast of 0.2%. Core CPI remained steady at 0.2%, matching the forecast. Unemployment claims dropped to 214 thousand, easily beating the estimate of 226 thousand. The indicator has not posted a gain since November. There are no Japanese events on the schedule. On Friday, the U.S releases the UoM Consumer Sentiment report.
Japanese manufacturing data was lukewarm this week. Earlier in the week, Preliminary Machine Tool Orders softened in June, with a gain of 11.4%. The indicator has now weakened for five consecutive months. This was followed by Core Machinery Orders, which declined 3.7% in May, but still beat the estimate of -5.2%. Still, the BoJ and government forecasts remain optimistic, as manufacturers are expected to increase capital expenditure this fiscal year, which is a vote of confidence in the economy.
Japanese policymakers are keeping a close eye on the nasty tariff battle between the U.S and China. Although the Trump administration hasn’t imposed tariffs on Japan, a full-blown global trade war could hamper the Japanese economy, which is heavily reliant on its export sector. After the U.S and China imposed tariffs on each other of some $30 billion, the Trump administration has raised the ante, threatening to hit China with further tariffs on $200 billion worth of Chinese goods. China cannot retaliate in kind since it does not import that amount of goods from the U.S. Still, the Chinese could take counter-steps such as lowering the value of the yuan.
Aussie Eyes Raft of Chinese Data as Trade Tensions Lurk in the Background
China will release its monthly trade balance data during the Asian session Friday, which will be followed by the nation’s quarterly GDP figures for Q2 early on Monday, alongside fixed asset investment, industrial production, and retail sales prints. The aussie – widely viewed as a liquid proxy for “China plays” – will be firmly in focus when these data are released, with the ongoing escalation in trade tensions between the US and China also a major consideration for its near-term direction.
Early on Friday, trade figures out of the world’s second largest economy will hit the markets. There’s no specific time for the release. Forecasts suggest China’s trade surplus is set to have widened in June (in dollar terms), with both exports and imports expected to have risen again, albeit at a slower pace. Specifically, exports and imports are projected to have risen by 10.0% and 20.8% respectively in June from a year earlier, down from the corresponding 12.6% and 26.0% readings in May, resulting in a widening of the nation’s trade surplus to $27.6bn, from $24.9bn previously.
In light of the escalation in US-China trade tensions lately, the financial community will likely look to the export numbers to gauge whether the rhetoric is catching up with the numbers. In other words, whether uncertainties around the trade outlook have already begun to show up as a drag on export growth.
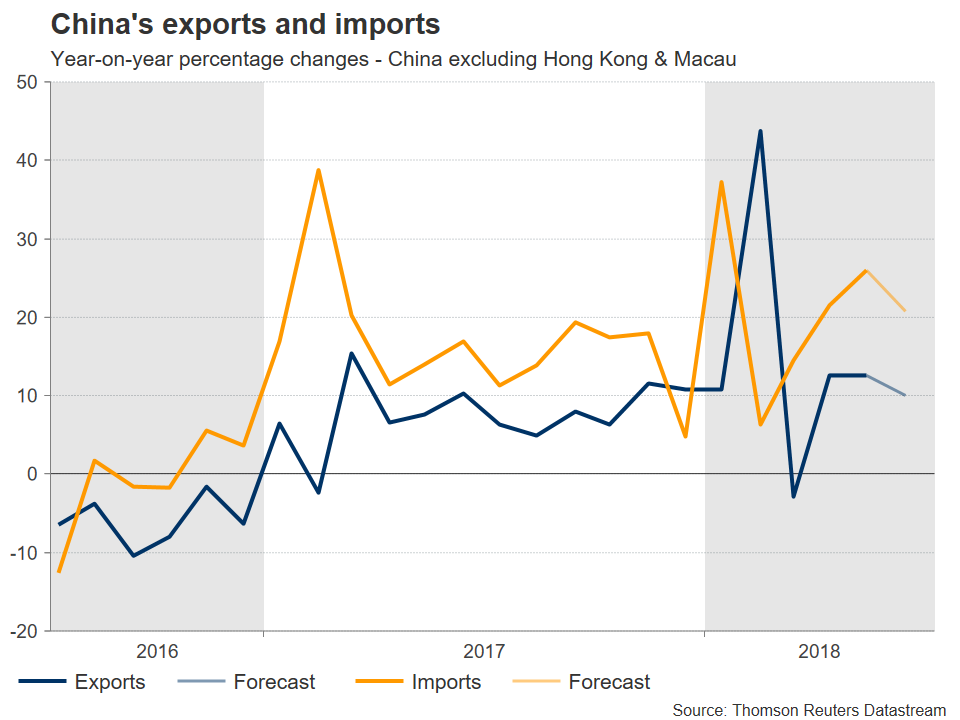
After the trade data, on Monday at 0200 GMT, China’s GDP for Q2 will be released, accompanied by updated figures on fixed asset investment, industrial production, and retail sales, all for June. GDP growth anticipated to have slowed slightly to 6.7% in yearly terms, from 6.8% in the previous quarter. Both fixed asset investment and industrial production are projected to have eased a little in the year to June, growing by 6.0% and 6.5% respectively, against May’s corresponding prints of 6.1% and 6.8%. Retail sales, meanwhile, expected to have accelerated to 9.0%, from 8.5% previously.
While a slowdown in economic growth may be perceived as a negative development at first glance, this may not necessarily hold true in China’s case. In recent years, Chinese growth was fueled in large part by a massive expansion of credit and bank lending. This process carries significant risks, such as generating financial imbalances and credit bubbles. Thus, Chinese authorities have pledged to clamp down on excessive lending, to limit such risks. While this could hinder growth in the short-run, it also makes the situation more sustainable over the longer-run, resulting in a regime of slower but higher-quality economic expansion. It’s also worth considering that China’s growth target is 6.5% annually and even accounting for the anticipated slowdown, the figure is still expected at 6.7%, safely above its mark.
Separately, note that the nation’s year-over-year (YoY) GDP print has displayed a tendency to overshoot forecasts in recent years, having surprised to the upside in four of the preceding six quarters, while it was in line with forecasts twice over that period. The last time the yearly figure surprised to the downside was back in 2014. While the same does not hold true for the quarter-over-quarter (QoQ) number, markets tend to focus more on the yearly print.
Turning to the FX market reaction, besides affecting the yuan, these data could also have an impact on the aussie – which is broadly considered a liquid proxy for China’s economy, given the close economic ties between Australia and China. Hence, stronger-than-anticipated figures could benefit the aussie, and vice-versa.
Beyond economic data, the aussie is likely to remain highly sensitive to any developments on the trade front, where the situation has escalated further lately, with the US announcing it is considering another round of tariffs on Chinese products. Australia is a large, open economy that relies heavily on commodity exports. Hence, the increasingly realistic prospect of a US-China trade war is casting a long shadow on the aussie, evident by its stark underperformance in recent months. Any signs of even further escalation in the coming weeks could keep the currency under pressure, whereas any hints that tensions may be subsiding may trigger a substantial relief rally.
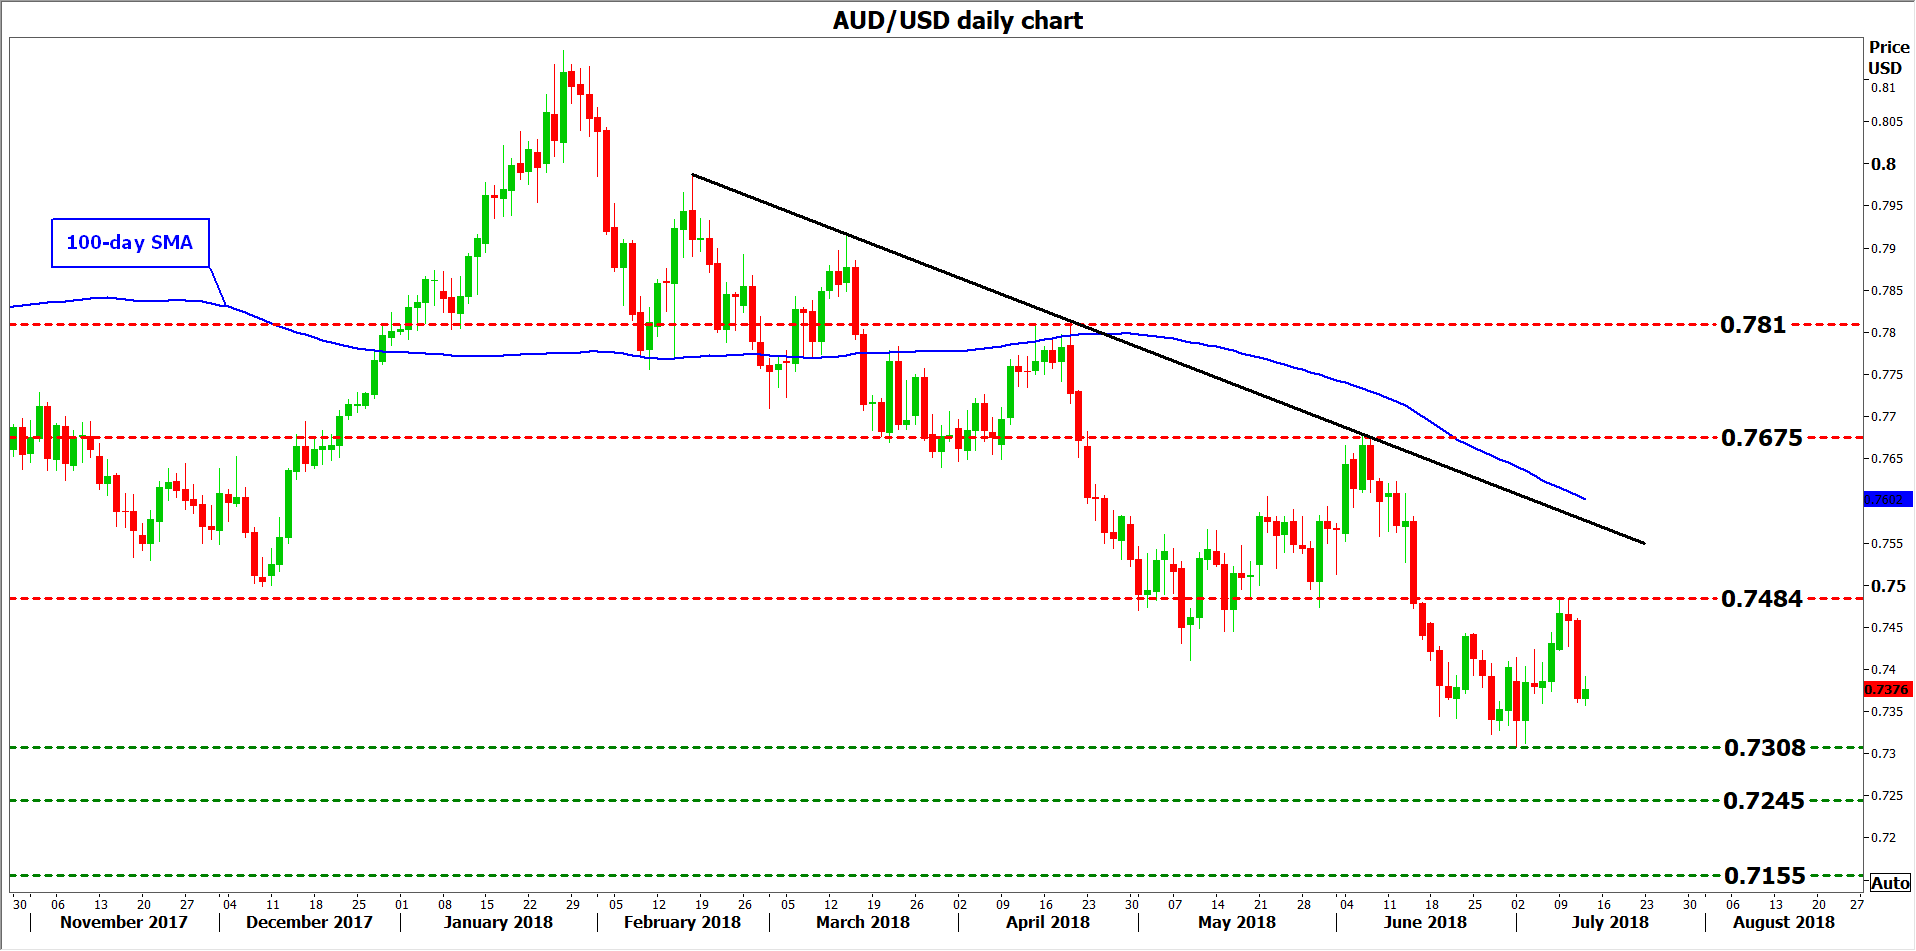
Technically, looking at aussie/dollar, further declines could encounter preliminary support near the 18-month low of 0.7308 posted on July 2. A downside break may open the way for 0.7245, defined by the inside swing high on 30 December 2016, before attention turns to 0.7155, the low from 23 December 2016.
On the upside, advances in the pair may meet initial resistance around 0.7484, the high of July 9. Even higher, the June 6 peak of 0.7675 would come into view, ahead of the 0.7810 zone, marked by the high of April 19.
US: Consumer Price Inflation Hits Six-Year High
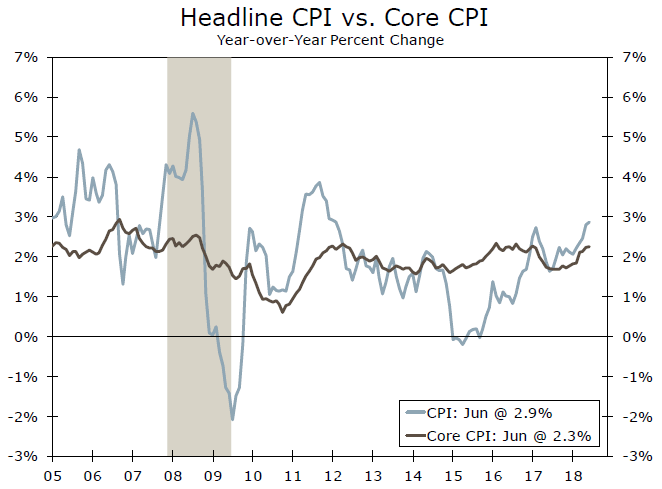
CPI rose 0.1 percent in June and is up 2.9 percent over the past year. While the lift to the year-ago rate from energy is expected to ease, inflation pressures continue to build and should keep the core at the Fed's target.
Moderate Gains in Headline and Core CPI in June
Consumer price inflation came in a touch lower than expected in June, with the headline index rising 0.1 percent. Nevertheless, the CPI is up 2.9 percent over the past year, which is the strongest pace in more than six years.
The multi-year high in the pace of headline inflation can be traced to the sizeable jump in fuel prices over the past year. Energy goods, which make up about 5 percent of the index, are up 24 percent from a year ago. Gasoline prices rose at a more modest rate in June, though, while declining costs for electricity and utility gasoline the past few months suggest energy's lift to the headline pace of inflation should ease in the coming months.
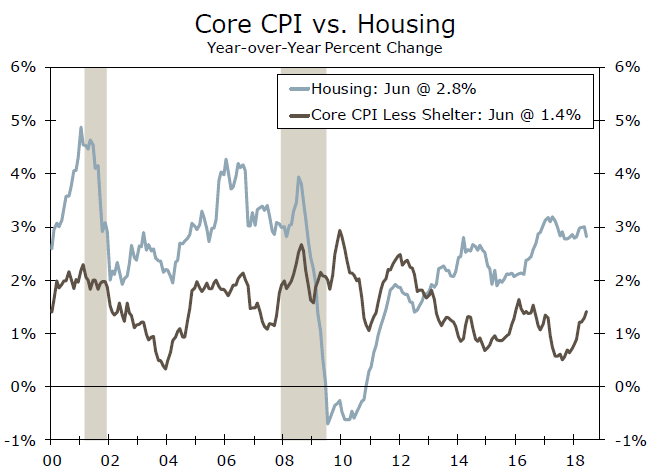
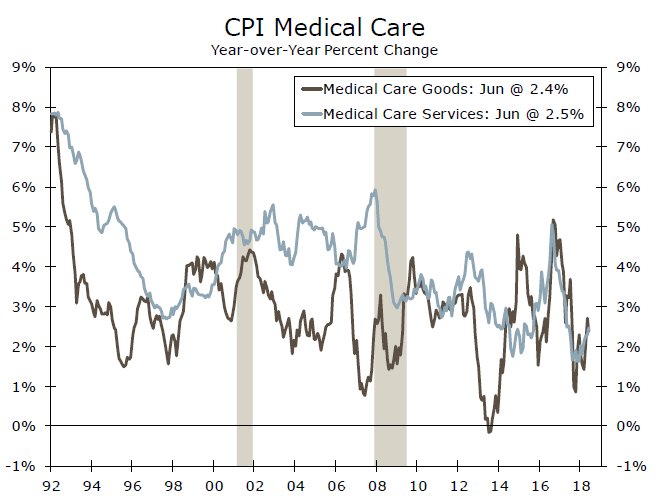
As we expected, the rise in the core index came in at a "low" 0.2 percent (0.16 before rounding). Core services inflation eased slightly, up 0.2 percent in June versus 0.3 percent in May. The smaller gain stemmed in large part from a sharp drop in lodging away from home, which reversed a three-month run of solid gains by falling 3.7 percent in June. Shelter costs for primary housing, however, continue to rise steadily and propel the core index higher. Excluding shelter, core CPI has still moved up over the past year and is back near the pace that prevailed in 2016. Further gains in medical care, including a 0.4 percent increase in June, have been a key contributor, while deflation among core goods continues to ease.
Back at the Fed's Target and Likely to Stay
While headline inflation has been boosted by the sharp rise in oil prices over the past year, the core has signaled that the underlying trend inflation has firmed. In May, the core PCE deflator hit 2.0 percent year-over-year for the first time since 2012, and, at 2.3 percent, the core CPI corroborates that inflation is running at the Fed's target.
Further improvement in the 12-month pace of the core index is expected to slow in the second half of the year since base comparisons are getting tougher now that the slowdown of last spring/early summer is a full year behind us. In addition, the recent pace of monthly gains has slowed from earlier this year, when lingering seasonality likely overstated the upward trend. The three-month annualized pace has eased to 1.7 percent after increasing just shy of 3 percent in March.
We expect to see core CPI, when measured on a 12-month basis, to remain near its current rate through the second half of the year before strengthening more in 2019. Solid consumer spending and minimal slack in the economy point to price pressures intensifying even though we do not anticipate much movement in the year-ago rate of core CPI over the next few months. Broadening tariffs, including the possibility of consumer goods getting hit directly, create some upside risk to our inflation forecast in the second half of the year, however.
Bulls Pushing USDJPY Higher; Be Aware of Temporary Pullbacks
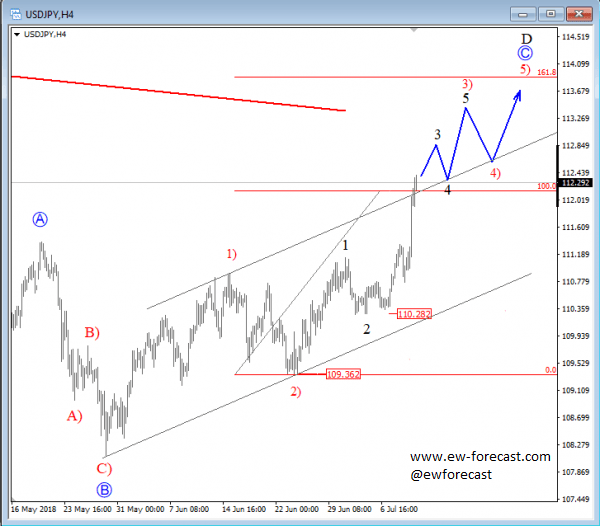
USDJPY can be trading in a bullish impulse since end of May when a corrective wave B of a higher degree found a low. Current price activity is clearly bullish with five minor waves within red wave 1), followed by a corrective leg 2) and now again a new three-wave recovery with latest sharp and steep rally from 110.28 resembling a wave 3 of a bigger cycle. Ideally price will continue even higher within a bigger impulse labeled as blue wave C which can in weeks ahead aim for the 113.5/114 area. That being said, be aware of temporary pullbacks which may pop up within the uptrend.
Sunset Market Commentary
Markets
Core bond markets oscillated near opening levels today with US Treasuries underperforming German Bunds. The small bear flattening of the US yield curve indicates that US inflation readings, at the highest level since 2012 and drifting further above the Fed’s 2% goal, were at play. US yields add up to 1.3 bps (2-yr). Stocks struggling to maintain their intraday upside momentum and drifting oil prices are on the other side of the balance. German yields decline by 0.9 bps (2-yr) to 1.8 bps (5-yr), with the belly of the curve outperforming. 10-yr yield spread changes vs Germany range between -2 bps (Italy) and +3 bps (Ireland). Today’s Italian BTP auction went well.
In line with recent price action, global markets quite easily recovered from the latest hiccup in the global trade war as the US announced preparing additional import tariffs on $200 bn of Chinese imports. Equities recovered part of yesterday’s losses, with US markets taking the lead. The link between equities on the hand and bonds and FX on the other hand was again modest. A risk-on context usually supports the euro more than the dollar, but today’s market reaction was more indecisive. EUR/USD initially hovered in a tight range in the 1.1670/95 area, but the dollar temporary gained a few ticks in the run-up to the publication of the US CPI data. Yesterday, PPI surprised on the upside of expectations. June CPI rose slightly from May (2.9% headline, 2.3% core), but the report was exactly in line with expectations. FX markets were apparently slightly positioned for a potential upward surprise. EUR/USD reversed the earlier decline. The pair trades again little changed in the 1.1675/80 area. USD/JPY remains an outperformer. The pair extended gains after yesterday’s technical break above 111.40 and trades currently in the 112.50 area.
The UK government published its Brexit ‘White Paper’ today confirming that it looks to maintain close ties with the EU regarding trade of goods. At the same time, the UK intends to maintain a bigger autonomy for (financial) services. The publication of the White Paper didn’t bring high profile new insights on the UK’s Brexit strategy. For now, it looks that PM May has succeeded a small victory on the hardline Brexit supporters in the government/conservative party. However, the next steps in the Brexit process (both in the UK and regarding the response from the EU) remain highly uncertain. At the time of writing, sterling gains a few ticks on a daily basis, both against the euro (EUR/GBP 0.8825 area) and the dollar (cable 1.3225 area). However, in a broader perspective there are no signs of a sustained sterling rebound yet.
News Headlines
The European Commission downgraded its growth forecasts for this year and next for the EMU (2.1% in 2018 and 2% in 2019). “The downward revision since May shows that an unfavorable external environment, such as growing trade tensions with the US, can dampen confidence and take a toll on economic expansion,” said VP Dombrovskis.
EMU industrial production rebounded in line with forecast in May (1.3% M/M & 2.4% Y/Y). National data published earlier showed that Germany contributed most to the increase which suggests GDP growth to pick-up after a disappointing Q1.
The International Energy Agency warned that global oil outages (Iran, Libya, Venezuela) may push spare production capacity to the limit. Brent crude failed to rebound after yesterday’s huge sell-off.
US eco data printed close to expectations. Weekly jobless claims dropped to 214k and remain near historically low levels. Headline and core CPI inflation rose further above the Fed’s 2% inflation target, respectively at 2.9% Y/Y and 2.3% Y/Y.
EU to agree on unified, strong position against US unilateralism
According to a draft text seen by Reuters, EU finance ministers are going to agree on Friday a unified, strong position against US unilateralism.
The text noted that the EU "promotes international cooperation to modernize the WTO," and "rejects WTO-inconsistent unilateral measures by others."
It added, "in this respect, we regret the recent U.S. decisions to impose import tariffs, which leave the EU no choice but to react in an adequate, proportionate and reasonable manner in full respect of WTO rules."
NZDUSD Creates Bullish Doji Candle But Risks Still on the Downside
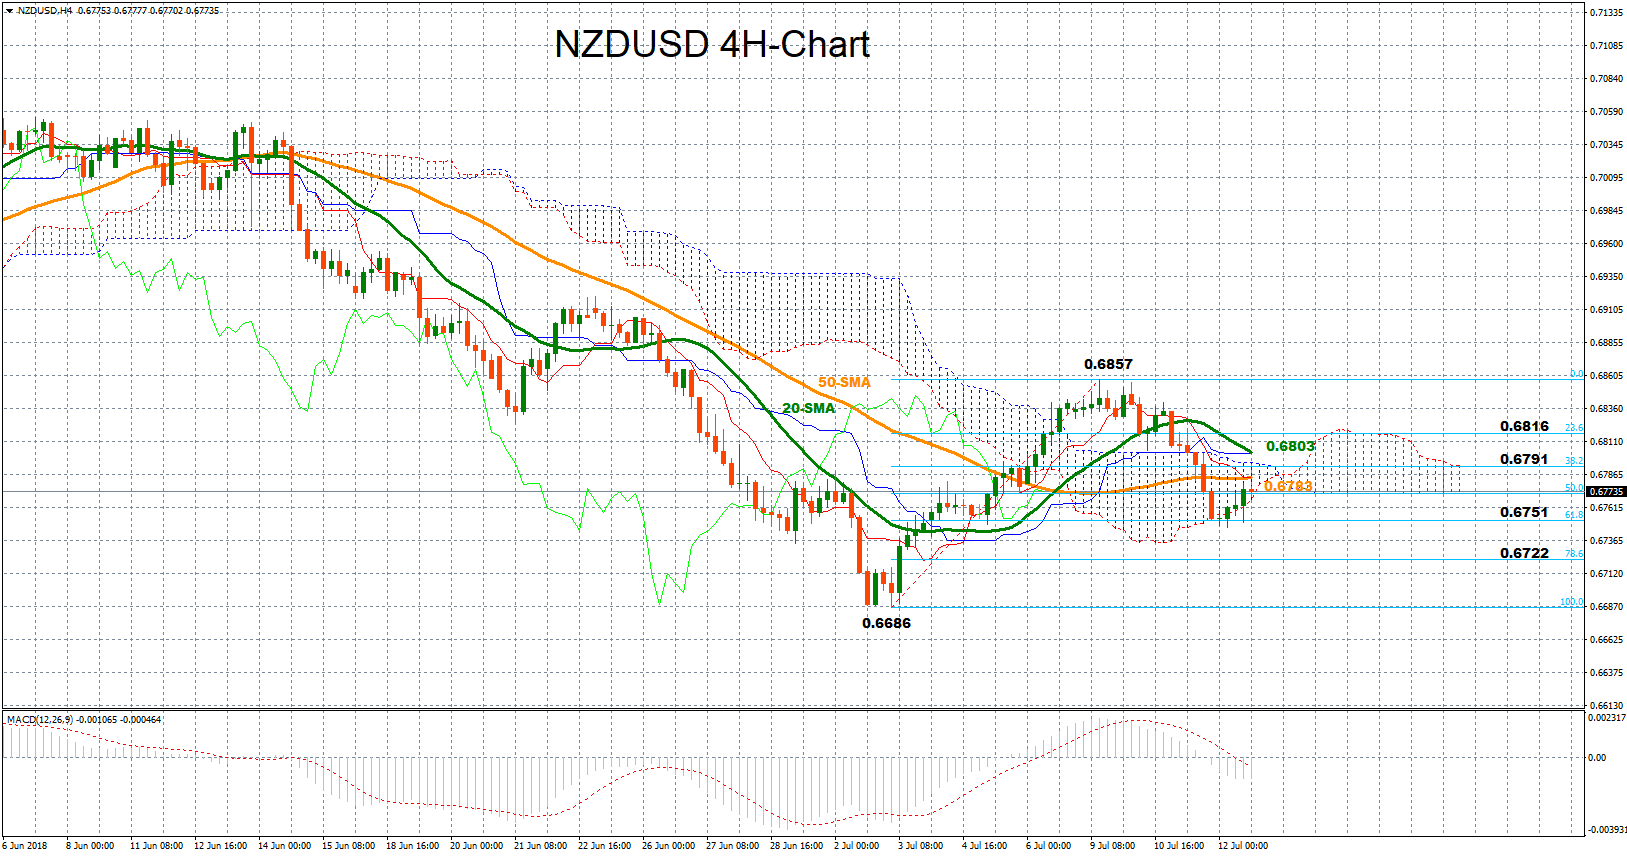
NZDUSD bounced higher once it printed a doji candle in the four-hour chart today, though the MACD points that risks remain to the downside as the indicator continues to expand in negative territory and below its red signal line. The red Tenkan-sen line sends bearish signals as well, distancing itself to the downside from the blue Kijun-sen line.
A leg up could immediately visit the area formed by the 50-period simple moving average at 0.6783 and the 38.2% Fibonacci retracement of 0.6791 of the upleg from 0.6686 to 0.6857. A little bit higher and above the 20-period MA (0.6803), the focus could turn to the 23.6% Fibonacci of 0.6816 before the bulls potentially take the market up to the 0.6857 peak. Should this be broken as well, then the bullish sentiment would be reinstated into the market.
Alternatively, a reversal to the downside could retest the 61.8% Fibonacci of 0.6751 which has provided some support during the past two weeks, while steeper declines could send the price well below the Ichimoku cloud, opening the door for a test of the 78.6% fibo of 0.6722.
US CPI Growth Ticked Higher Again in June
Highlights:
- All items CPI rose 0.1% month-over-month in June with the year-over-year rate ticking up to 2.9%. That was in line with market expectations ahead of the report.
- Gasoline prices rose another 0.5% in June and were up 24% from a year ago.
- Core (ex-food & energy) prices rose 0.2% from May to push the year-over-year rate up to 2.3% in June from 2.2% a month earlier.
Our Take:
U.S. CPI growth was in line with expectations in June. Headline growth ticked up to 2.9% on a year-over-year basis from 2.8% in May and marking the largest increase in more than 6 years. A big chunk of that growth is still due to energy prices which were up 12.0% from a year ago. Core (ex-food & energy) price growth has also been drifting slowly higher, though, with another tick higher to 2.3% in June from 2.2% in May. Commodity prices excluding food & energy products were still down slightly from a year ago in June — so little evidence that tariff-related hikes in producer costs for some products (eg. steel) are flowing in a significant way to consumer prices as yet. The less-tradeable services ex-energy component rose to 3.1% on a year-over-year basis, up from 3.0% in May and 2.5% at this time a year ago. The firming price growth backdrop should continue to confirm Fed policymakers’ suspicions that the economy is running close to capacity limits even as growth continues to be boosted by fiscal policy. The data remains fully consistent with the Fed continuing to hike rates at a gradual pace.
Italian PM Conte said no extra NATO spending
Italian Prime Minister Giuseppe Conte said today that "Italy inherited spending commitments to NATO, commitments that we did not change, so no increase in spending." He added that "as far as we're concerned, today we did not decide to offer extra contributions with respect to what was decided some time ago."
That came not long after Trump, in high profile way, declared in an unscheduled press conference that "everyone has agreed to substantially up their commitment" and he was "extremely happy".
Seems like by "everyone" Trump means everyone but Italy? Or either Conte or Trump lied?
Separately, French President Emmanuel Macron said he read Trump's 140-character messages" but the debate in NATO "took a different tone. They were frank but there was no finger-pointing or lack of respect."
When will Macron realize that only someone with integrity will deliver the messages with the same tone everywhere?
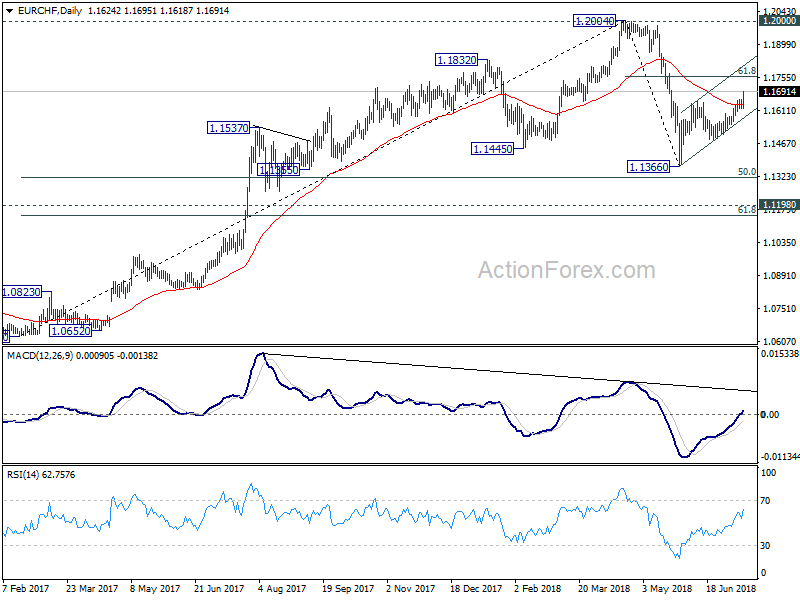
EUR/CHF Mid-Day Outlook
Daily Pivots: (S1) 1.1611; (P) 1.1636; (R1) 1.1652; More...
EUR/CHF finally breaks 1.1656 resistance with conviction. Intraday bias is now on the upside for further rise to 61.8% retracement of 1.2004 to 1.1366 at 1.1760. At this point, we're viewing the rebound from 1.1366 as the second leg of the corrective pattern from 1.2004. And another fall is expected before the correction from 1.2004 completes. Therefore, we'd expect strong resistance around 1.1760 to limit upside. On the downside, below 1.1618 will turn bias back to the downside for 1.1478 support and below. However, sustained trading above 1.1760 will pave the way to retest 1.2004 high next.
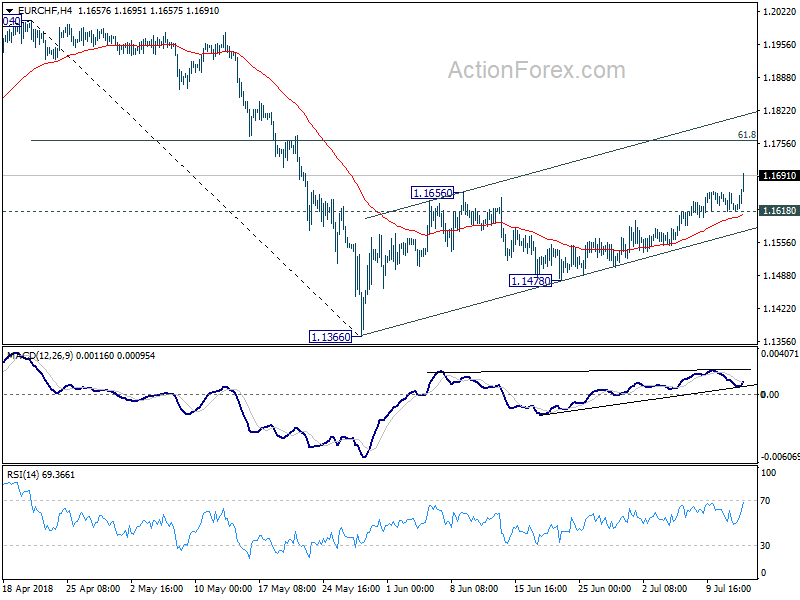
In the bigger picture, EUR/CHF was solidly rejected by prior SNB imposed floor at 1.2000. Considering bearish divergence condition in daily and weekly MACD, 1.2004 should be a medium term top. And price action from 1.2004 is correcting the up trend from 1.0629. Such correction is expected to extend for a while and therefore, we're not anticipating a break of 1.2004 in near term. Another decline cannot be ruled out yet. But in that case, strong support should be seen at 1.1198 (2016 high), 61.8% retracement of 1.0629 to 1.2004 at 1.1154 to contain downside.