Sample Category Title
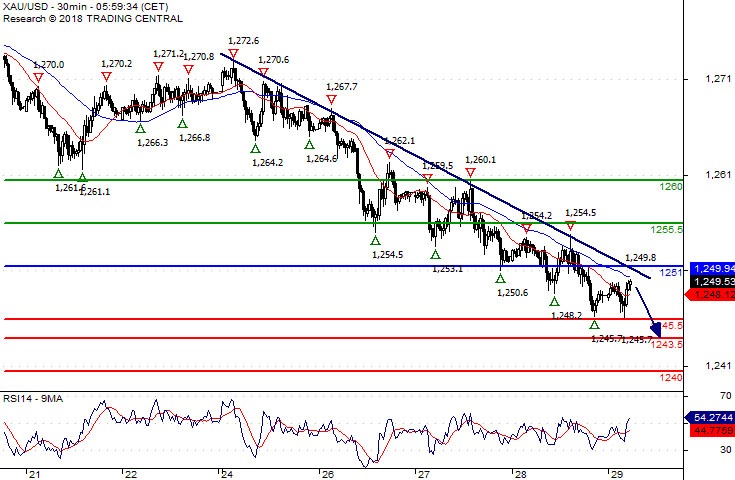
Gold Spot Key Resistance At 1251.00
Pivot (invalidation): 1251.00
Our preference Short positions below 1251.00 with targets at 1245.50 & 1243.50 in extension.
Alternative scenario Above 1251.00 look for further upside with 1255.50 & 1260.00 as targets.
Comment As Long as 1251.00 is resistance, likely decline to 1245.50.
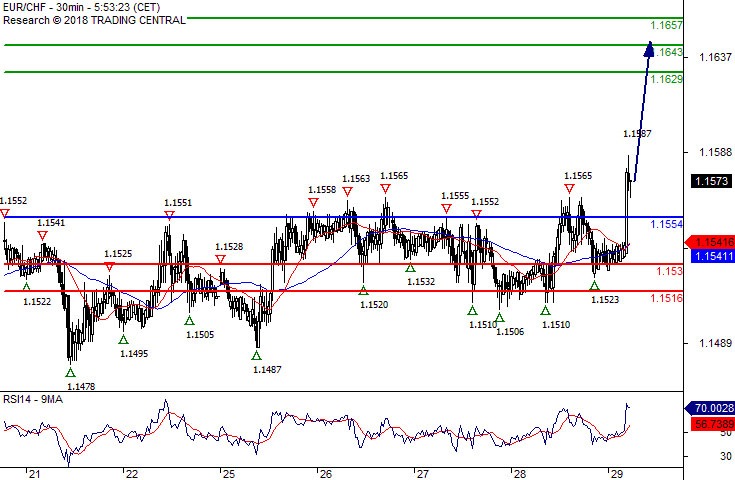
EUR/CHF Above its upper Bollinger band.
Our pivot (invalidation) point stands at 1.1554.
Our preference The upside prevails as Long as 1.1554 is support.
Alternative scenario Below 1.1554, expect 1.1530 and 1.1516.
Comment The RSI is above 70. It could mean either that the pair is in a lasting uptrend or just overbought and therefore bound to correct (look for bearish divergence in this case). The MACD is above its signal line and positive. The configuration is positive. Moreover, the pair is trading above both its 20 and 50 MAs (respectively at 1.1542 and 1.1541). Finally, the EUR/ CHF has crossed above its upper Bollinger band (1.1566).
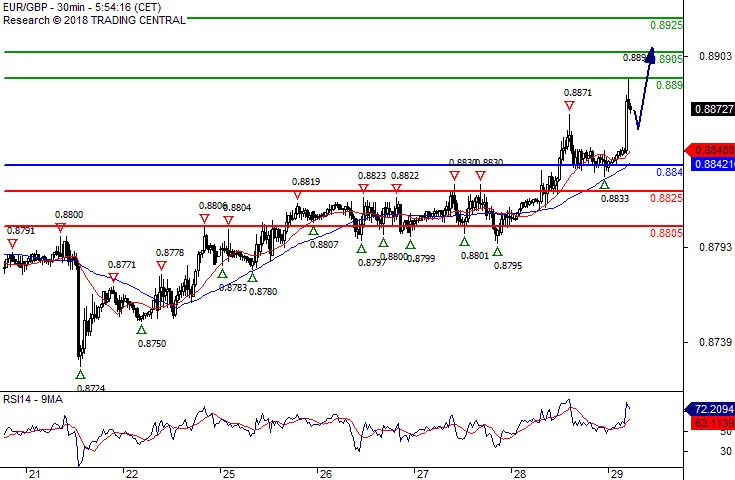
EUR/GBP Further Advance
Pivot (invalidation): 0.8840
Our preference Long positions above 0.8840 with targets at 0.8890 & 0.8905 in extension.
Alternative scenario Below 0.8840 look for further downside with 0.8825 & 0.8805 as targets.
Comment The RSI calls for a new upleg.
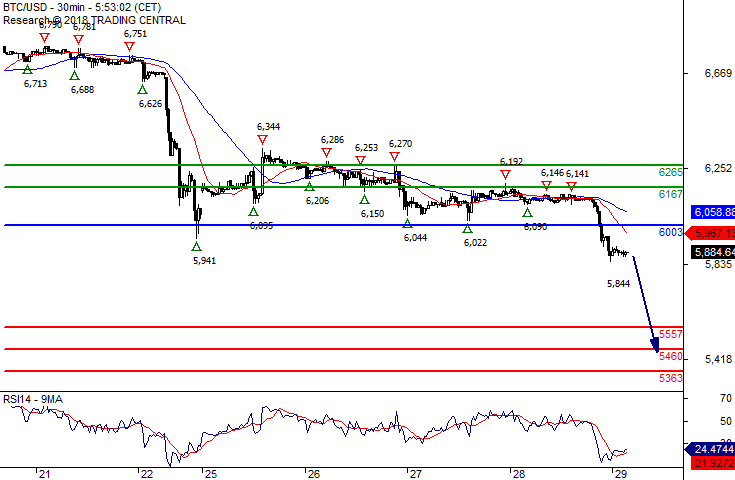
Bitcoin/Dollar The RSI Is Oversold
Our pivot (invalidation) point is at 6003.
Our preference The downside prevails as Long as 6003 is resistance.
Alternative scenario Above 6003, look for 6167 and 6265.
Comment The RSI is below 30. It could either mean that the pair is in a lasting downtrend or just oversold and therefore bound to retrace (look for bullish divergence in this case). The MACD is negative and below its signal line. The configuration is negative. Moreover, the pair stands below its 20 and 50 MAs (respectively at 5961 and 6047).
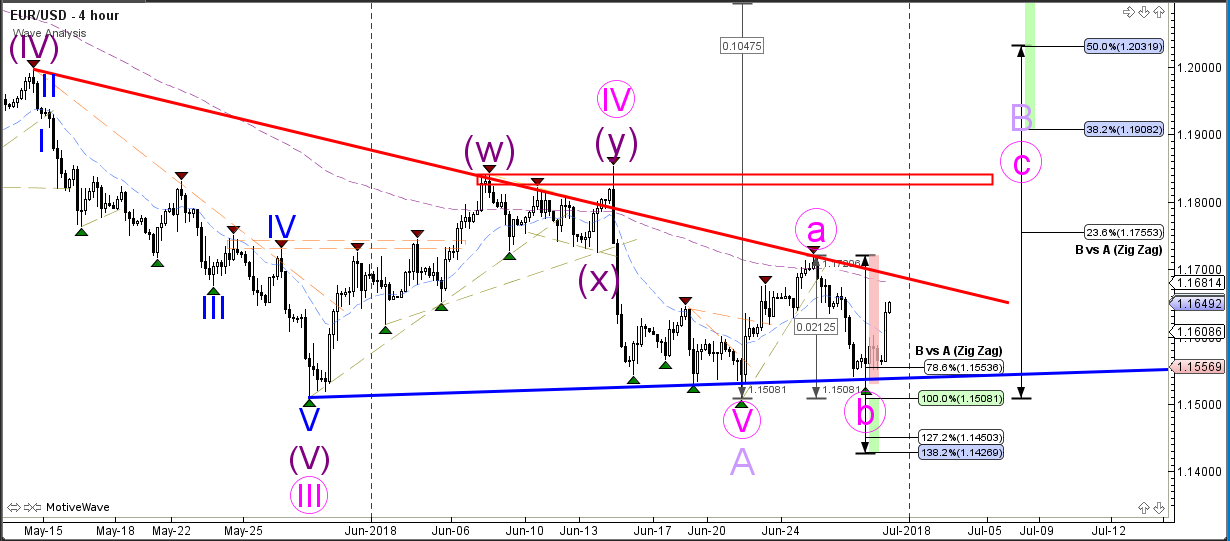
EUR/USD Bullish Reversal At 1.15 After Breaking Resistance Line
The EUR/USD bounced strongly at the 1.15 support zone, as indicated in the wave analysis yesterday. The bullish reversal could be part of a larger wave B (pink) correction and price could move up now for an impulsive wave C (pink) in wave B (purple). In any case it seems likely that price is building a lengthy consolidation zone at the moment.
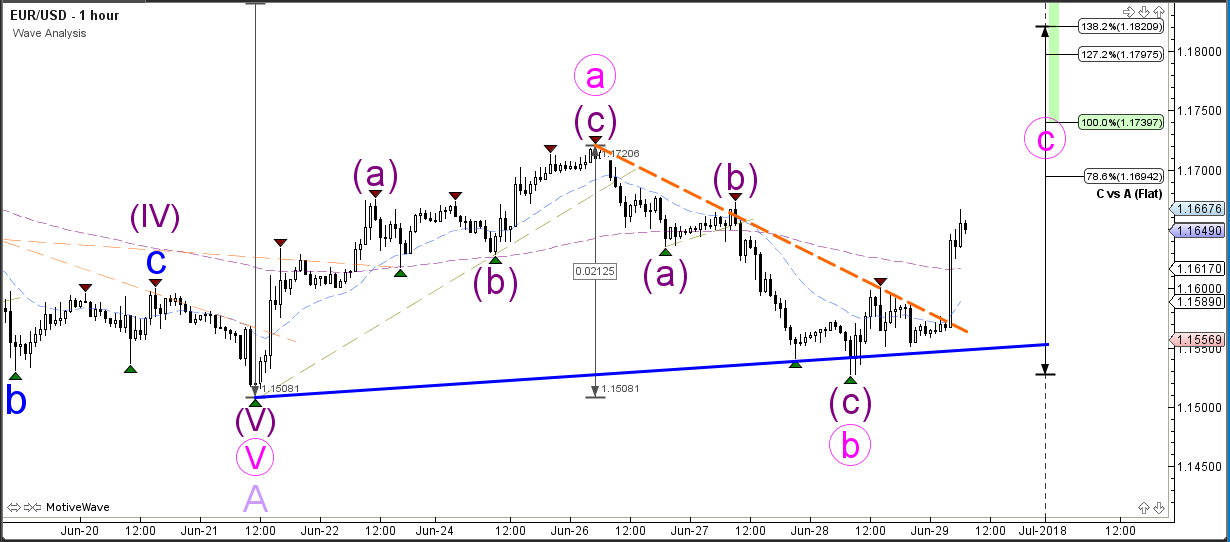
The EUR/USD indeed completed a bearish ABC pattern (purple). Price then broke above the resistance trend line (dotted orange) for a bullish breakout towards the wave C (pink) Fibonacci targets. The breakout itself could be a wave 3 if price manages to stay above 1.16.
GBP/USD Approaches Critical 38.2-50% Resistance Zone
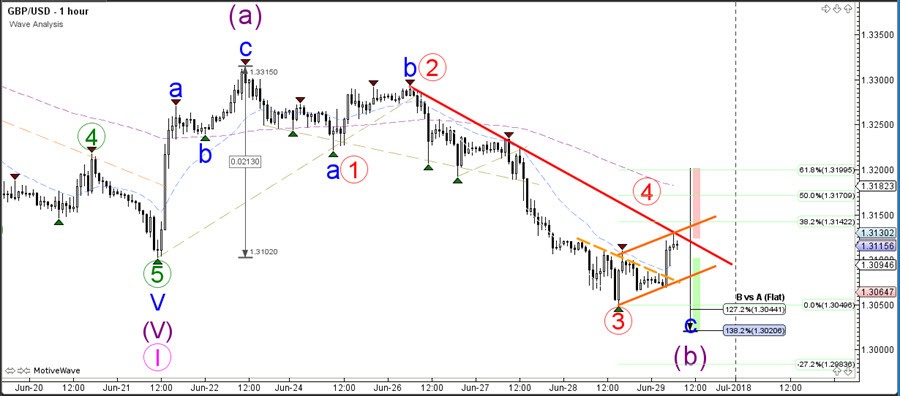
The GBP/USD showed stronger bearish momentum than the EUR/USD because price managed to break the previous bottom at 1.31 but price however did not manage to break the downtrend channel. Will GBP/USD reverse back up like the EUR/USD or continue with the downtrend?
Both versions are in fact possible and are represented on the 4-hour image. A bullish bounce via a wave B (purple) correction is still possible because price has stayed above the 138.2% Fibonacci level. The alternative is that price is building a 12345 (red) pattern. In that case, price would need to respect the Fibs on the 1 hr chart and turn back down and break below the flag.
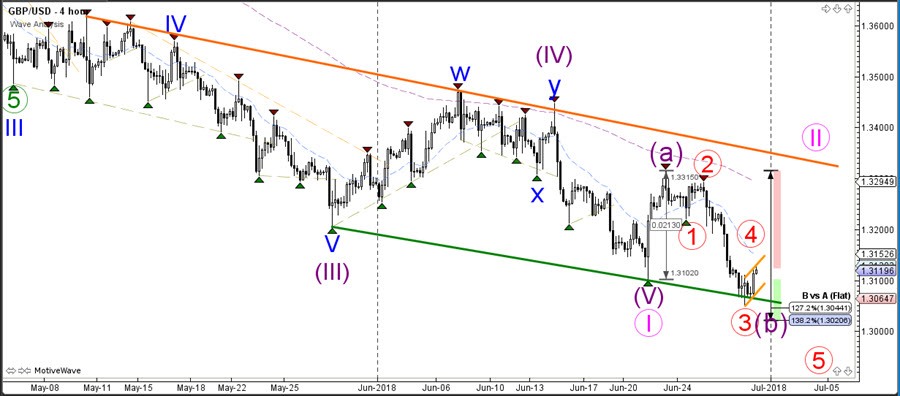
The GBP/USD needs to stay below the 38.2-50% Fibonacci zone otherwise a wave 4 (red) becomes unlikely. A bearish turn and break below the bear flag pattern channel (orange lines) could confirm a wave 4-5 (red) towards the -27.2% Fib target. A break above the 50% Fib makes an ABC (blue) within wave B (purple) more likely.
USDJPY Pullback To Fib Levels After Bullish Break?
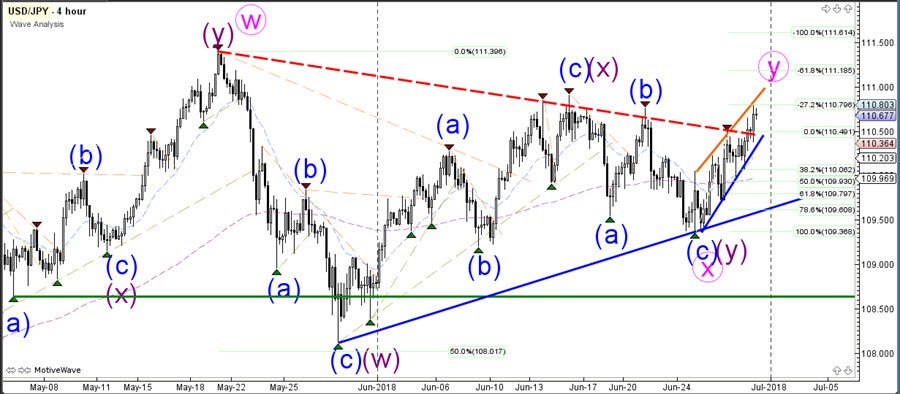
The USD/JPY is breaking above a key resistance trend line (dotted red) which could indicate a bullish breakout within wave Y (pink).
The USD/JPY remains corrective and choppy when reviewing recent price action but the bullish channel seems to be a serious challenge for resistance. A breakout could indicate and confirm the end of wave X (pink) and the bullish continuation within wave Y (pink).
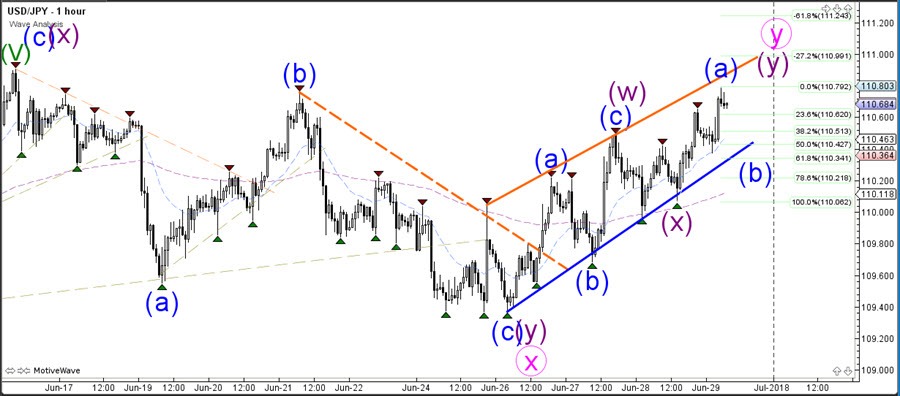
The USD/JPY seems to be building a potential double zigzag with two ABC patterns fitting in a larger WXY (purple) correction. A bearish retracement could bounce at the Fibonacci levels of wave B (blue).
GBPUSD More Downside Likely Below 1.3101 Level
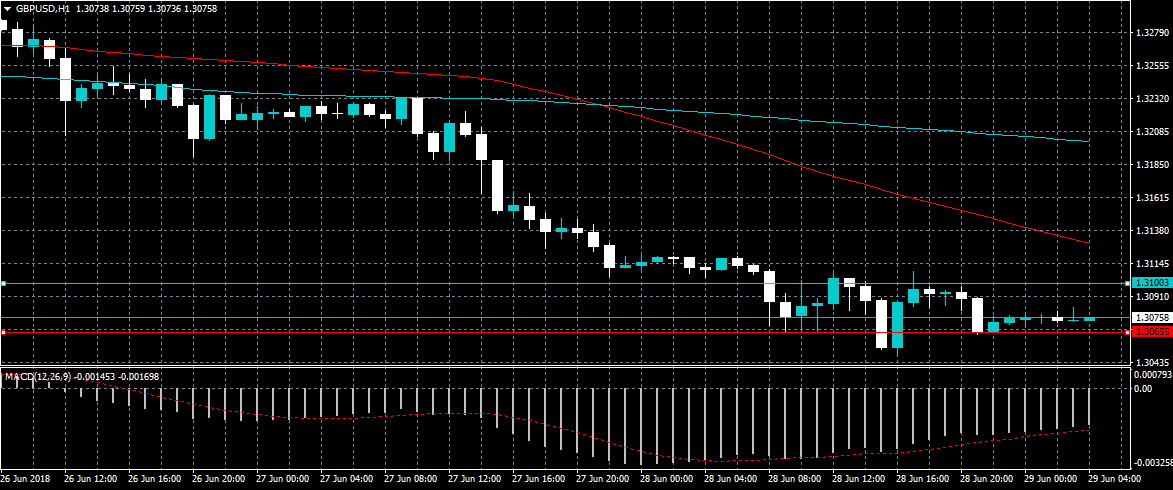
The British pound continues to trade to the downside against the US dollar on Friday, ahead of key GDP data from the United Kingdom economy. The GBPUSD pair has been rejected strongly from the 1.3101 level and trades close to its key 100-week moving average. Sterling sellers will look for further losses below the 1.3065 level, while buyers will try to once again move price above the key 1.3101 level.
The GBPUSD pair is strongly bearish while trading below the 1.3101 level, key support is currently found at the 1.3065 and 1.3000 levels.
If the GBPUSD pair trades above the 1.3101 level, key technical resistance is found at the 1.3115 and 1.3142 levels.
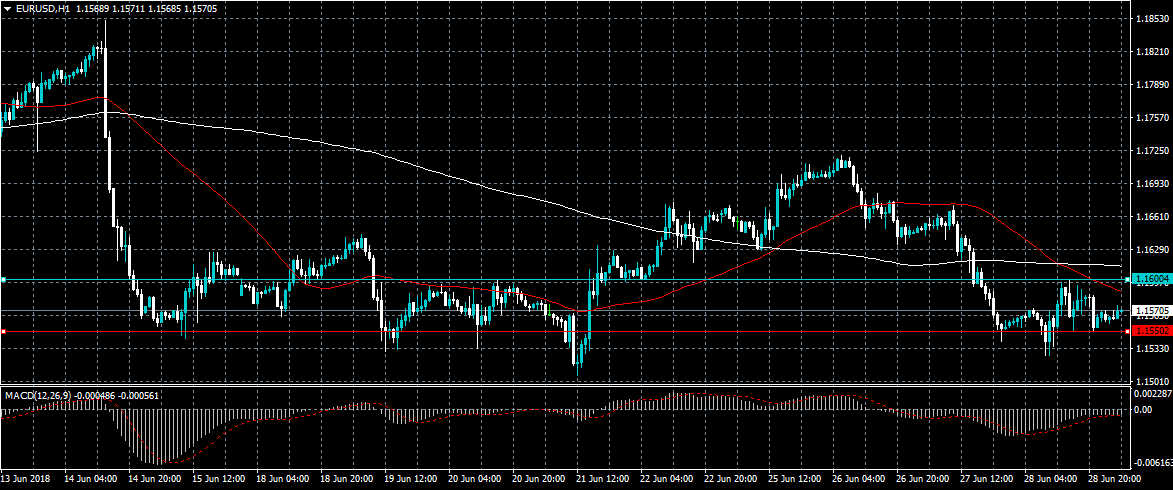
EURUSD Still Bearish Below 1.1600 Level
The euro currency remains under selling pressure against the US dollar on Friday, with the EURUSD pair still trading well below the key technical support. The EURUSD pair has performed numerous failed attempts towards the 1.1600 resistance level, and risks further declines towards the 1.1507 support level. Traders now look to key eurozone Inflation data and the next directional move around the 95.00 level on the US dollar index.
The EURUSD pair is strongly bearish while trading below the 1.1600 level, key intraday support is found at the 1.1550 and 1.1507 levels.
If EURUSD buyers move price back above the 1.1600 level, price could easily correct back towards the 1.1620 and 1.1644 levels.
Gear Up For A Super Friday
The final trading session of June is expected to be an eventful one, as a deluge of economic data from Europe and the United States floods the market. There's also no shortage of high-profile releases, which should give currency traders plenty of opportunities.
Action begins at 06:00 GMT when Germany unveils its latest retail sales figures. Receipts at retail stores are projected to fall 0.5% in May. Compared with May 2017, retail sales likely rose 1.8%.
The French government will report on inflation and consumer spending at 06:45 GMT. The headline consumer spending report is likely to show growth of 0.8% for May.
Germany is back in the headlines at 08:00 GMT with the monthly unemployment report. The jobless rate for Europe's largest economy is forecast to hold at 5.2% for June.
Shifting gears to the United Kingdom, the Office for National Statistics is scheduled to release revised first quarter GDP data at 08:30 GMT. Annualised GDP is projected to grow 1.2%, unchanged from the previous estimate.
Eurostat rounds out an active European session with a final reading of June CPI at 09:00 GMT. The Eurozone inflation rate is forecast to rise 2% annually.
The New York session begins with a high-profile report on personal income and outlays, which also includes the core personal consumption expenditure (PCE) index, which is the Federal Reserve's preferred measure of inflation. The core PCE index likely rose 1.9% in the 12 months through May, up slightly from the previous month.
Analysts are also forecasting a 0.4% rise both in personal spending and personal income.
At 13:45 GMT, the ISM-Chicago will release the latest Chicago purchasing managers' index (PMI), which is expected to convey a slowdown in growth during June.
Canada will also be in the headlines Friday when it posts April GDP figures at 12:30 GMT. The Canadian economy is projected to flatline at the start of Q2.
EUR/USD
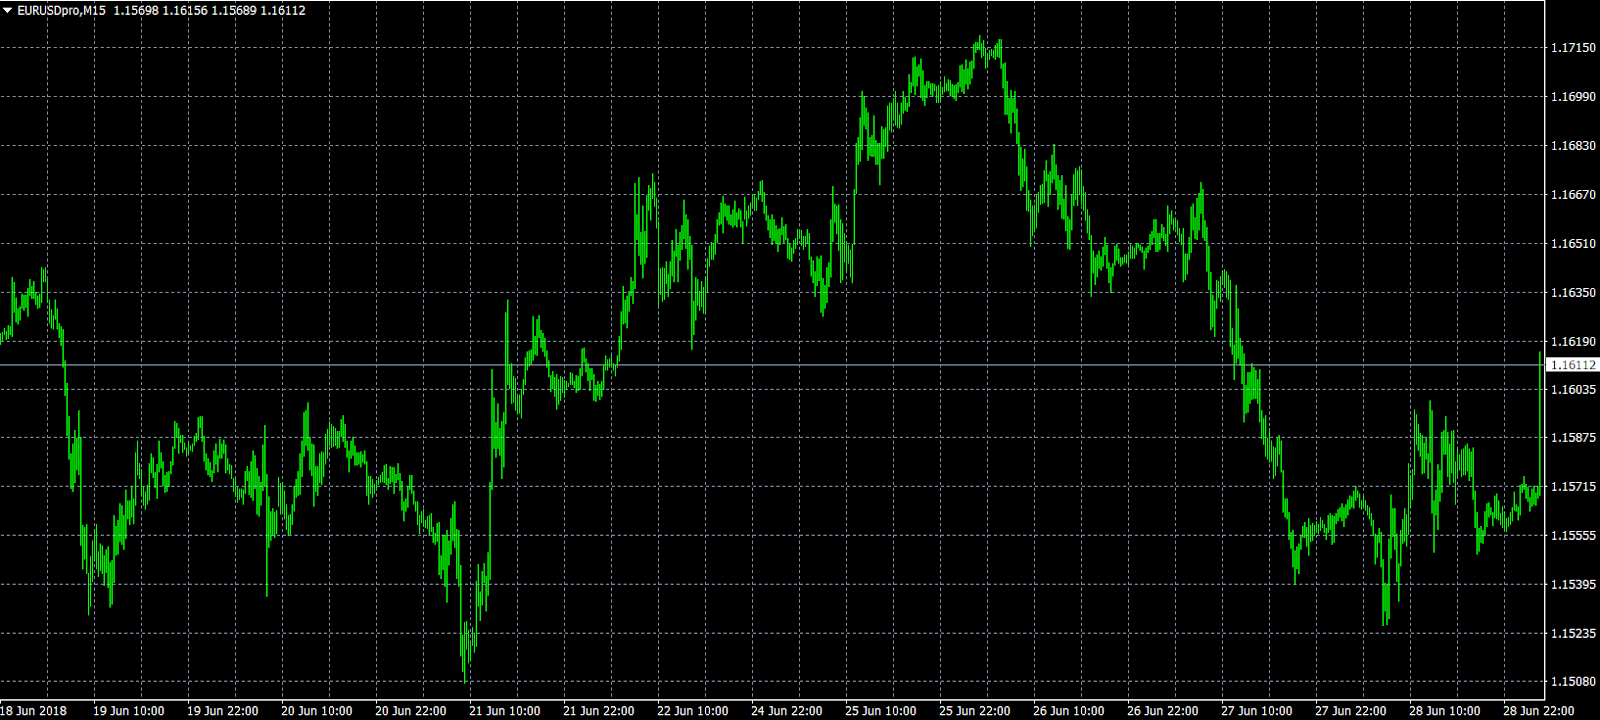
After undergoing a failed recovery on Tuesday, Europe's common currency has declined by more than 130 pips against the dollar. EUR/USD is now trading at 1.1573, with immediate support located at 1.1550. On the flipside, resistance is found at 1.1620.
GBP/USD
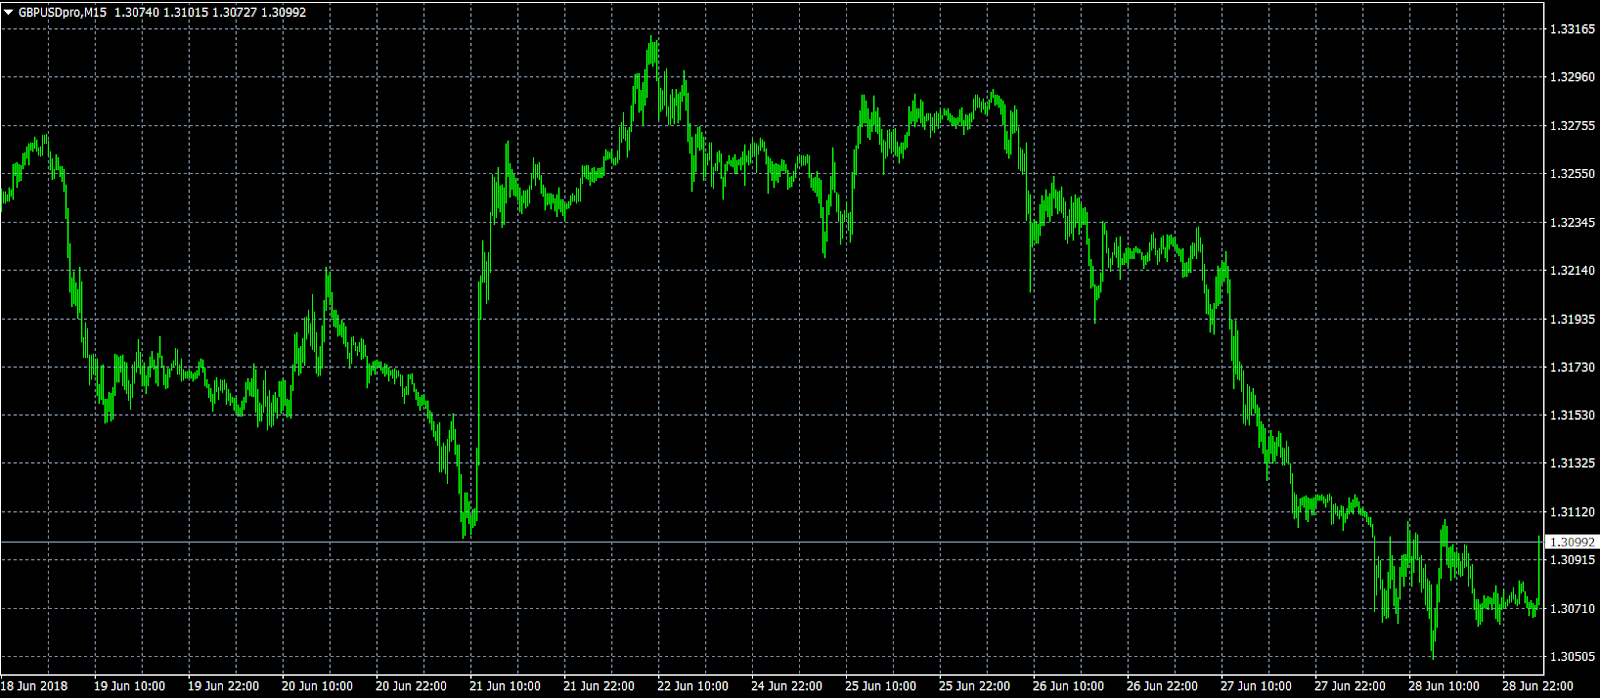
Cable's weeklong downtrend showed signs of moderation on Thursday, though the underlying trend remains firmly tilted to the downside. GBP/USD has found support away from the recent swing low of 1.3063, with prices now testing the 1.3100 level. Economic data could set the tone on Friday.
USD/CAD
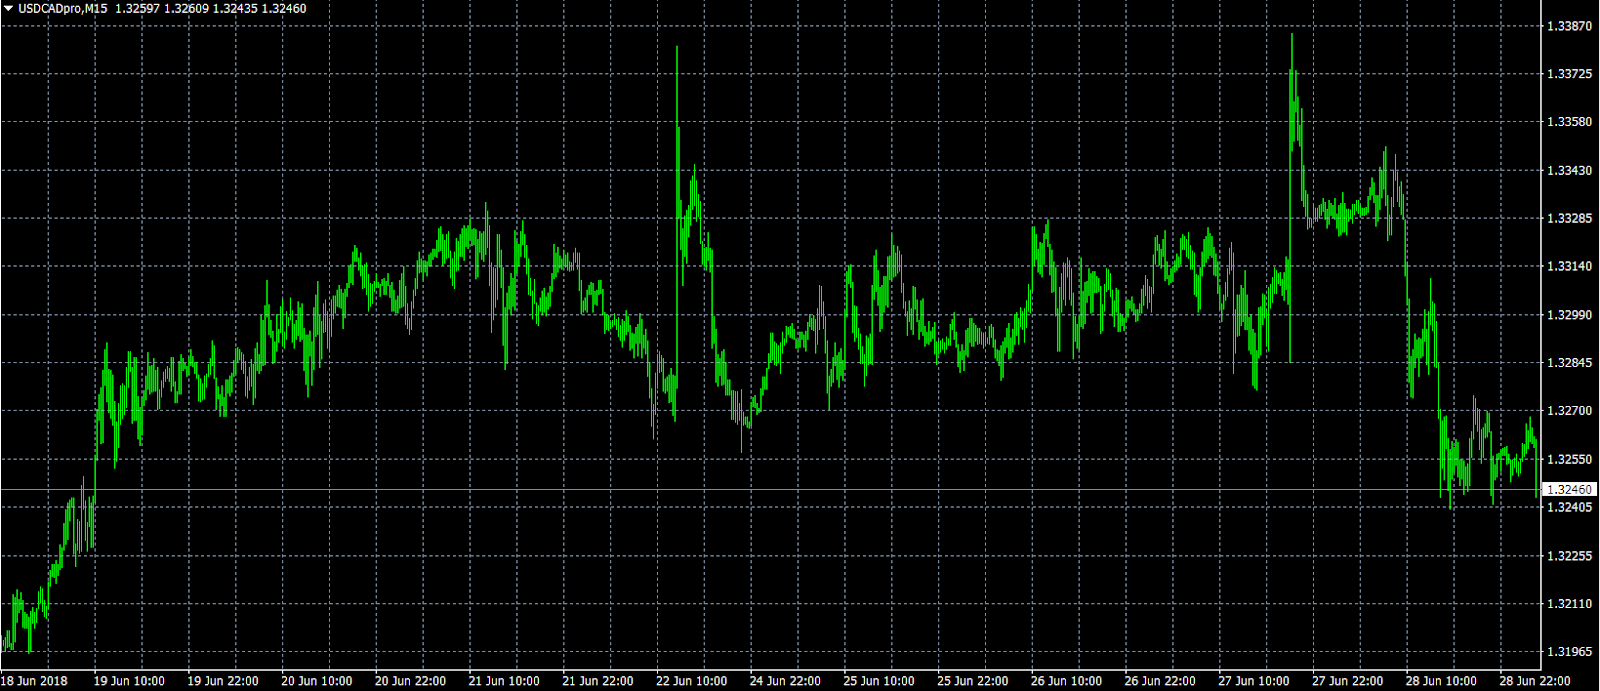
The Canadian dollar rebounded on Thursday after falling to its lowest level of the year mid-week. USD/CAD is currently trading around 1.3260, having declined more than 100 pips from its previous high. The short-term outlook is still pointed upward, as NAFTA talks continue to weigh on the loonie.