Sample Category Title
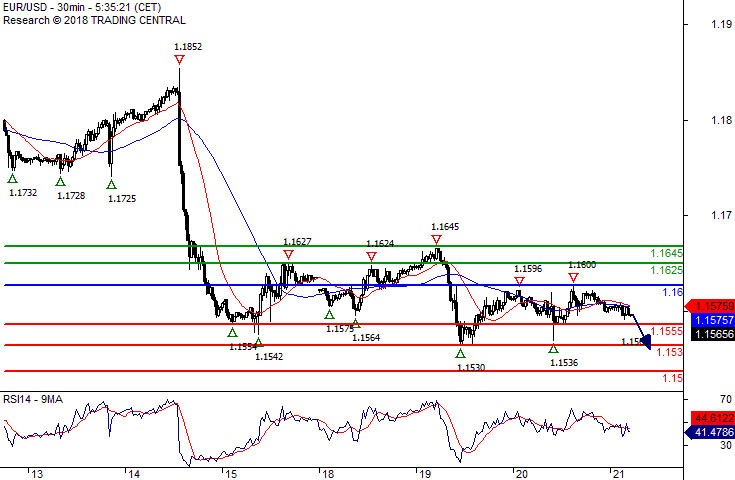
EUR/USD Towards 1.1555
Pivot (invalidation): 1.1600
Our preference Short positions below 1.1600 with targets at 1.1555 & 1.1530 in extension.
Alternative scenario Above 1.1600 look for further upside with 1.1625 & 1.1645 as targets.
Comment A break below 1.1555 would trigger a drop towards 1.1530.
Bitcoin/Dollar As Long As 6580 Is Support Look For 7214
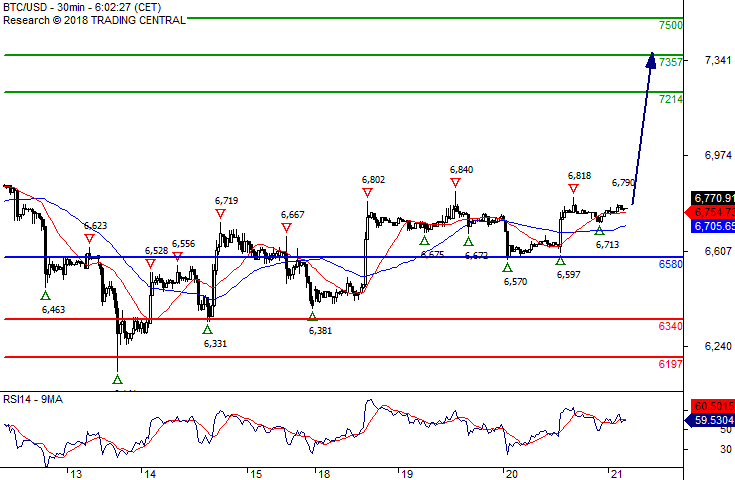
Our pivot (invalidation) point stands at 6580.
Our preference As Long as 6580 is support look for 7214.
Alternative scenario The downside breakout of 6580 would call for 6340 and 6197.
Comment The RSI is above its neutrality area at 50. The MACD is below its signal line and positive. The pair could retrace. Moreover, the pair is trading above both its 20 and 50 MAs (respectively at 6751 and 6696).
Forex Technical Analysis: EUR/USD, USD/JPY, GBP/USD
EUR/USD
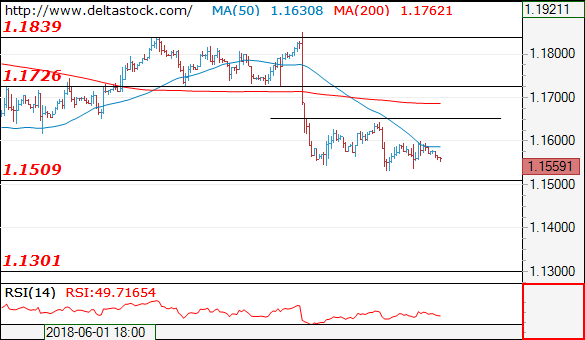
Current level - 1.1559
My outlook is bearish, for a break through 1.1510 lows, towards 1.1300 area. Initial minor resistance lies at 1.1600, followed by 1.1650.
| Resistance | Support | ||
| intraday | intraweek | intraday | intraweek |
| 1.1600 | 1.1720 | 1.1510 | 1.1480 |
| 1.1720 | 1.1830 | 1.1480 | 1.1300 |
USD/JPY
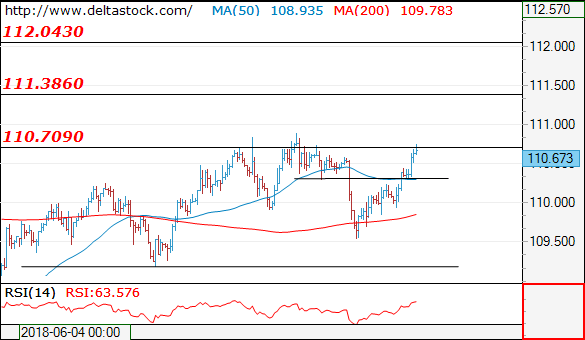
Current level - 110.67
The violation of 110.30 signals, that the whole slide after 110.90 peak is over and due the fact, that this was the third leg of the major consolidation below 111.40 I am tempted to think, that a new major upmove is on its way, towards 114.50. The intraday bias is positive above 110.30, for a rise towards 111.40 peak.
| Resistance | Support | ||
| intraday | intraweek | intraday | intraweek |
| 110.90 | 111.40 | 110.30 | 107.80 |
| 111.40 | 114.40 | 109.20 | 106.70 |
GBP/USD
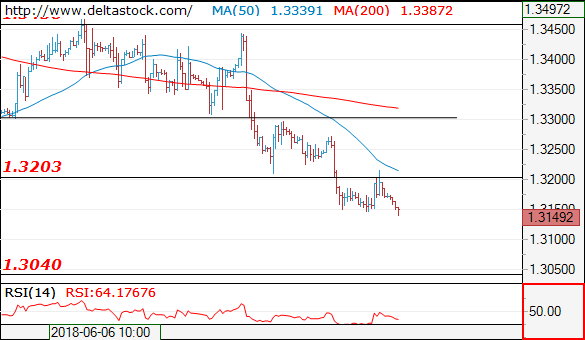
Current level - 1.3149
The downtrend remains intact, heading for a test of 1.3040 zone. Crucial on the upside is yesterday's high at 1.3215.
| Resistance | Support | ||
| intraday | intraweek | intraday | intraweek |
| 1.3200 | 1.3618 | 1.3110 | 1.3040 |
| 1.3300 | 1.3990 | 1.3040 | 1.3040 |
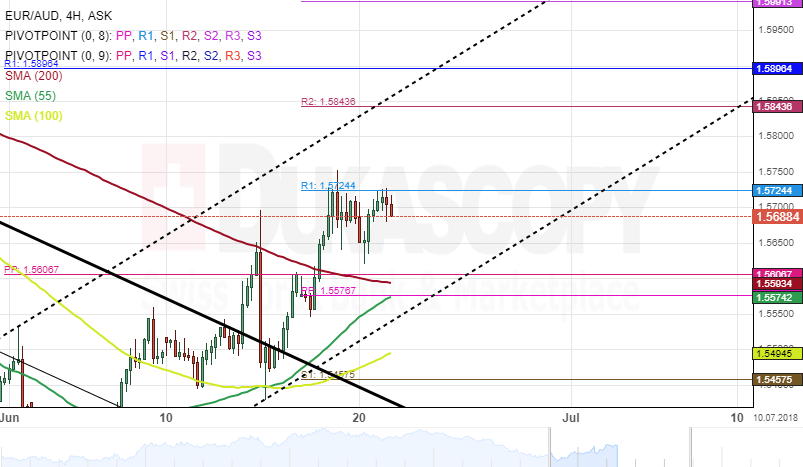
EUR/AUD 4H Chart: Breakout Occurs
The movement of the EUR/AUD currency pair has been guided by a junior ascending channel. The exchange rate made a U-turn from the lower boundary of the junior pattern on June 6 and has since strengthened.
By Thursday's morning, the pair encountered a resistance level at 1.5724 which is the weekly pivot point.
In regards to future trading, the currency exchange rate is expected to make a brief retracement south towards the 200– hour simple moving average within the following trading sessions. If the 200-hour SMA support holds, the rate could dash through the aforementioned resistance level during the following days.
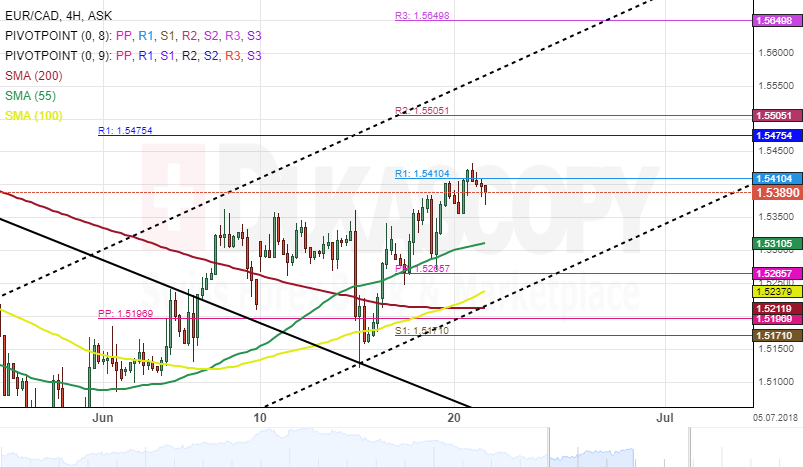
EUR/CAD 4H Chart: Continues Bullish
The common European currency has appreciated significantly against Canadian Dollar since the end of May. The currency pair bounced off the lower boundary of an ascending pattern on May 30 and has since gained more than 490 base points or 3.30%.
During the last week, the 55-, 100-, and 200-hour SMAs have moved below the price action and could be set to push the exchange rate higher during the following weeks.
As for near future, the EUR/CAD currency exchange rate is likely to continue its movement north until it breached the upper boundary of the ascending channel.
EURUSD Analysis: Starts Day With No Changes
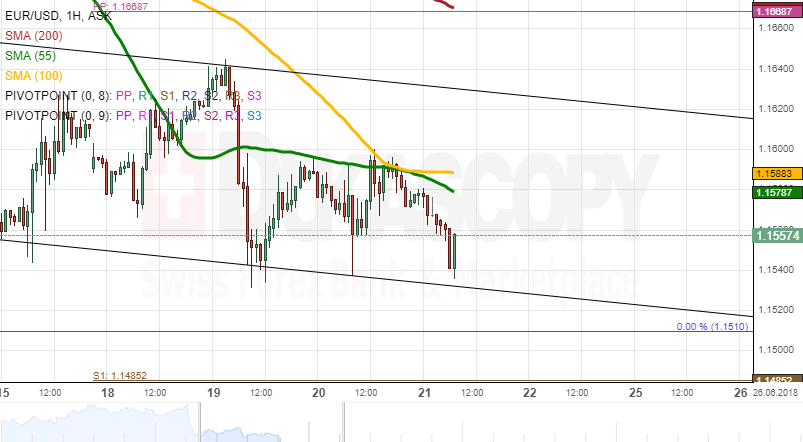
The common European currency failed to accelerate against the US Dollar on Wednesday, being restricted by the 55– and 100-hour SMAs from above. In addition, the pair likewise failed to breach the 1.1550 mark, which shows that neither bears nor bulls were able to gather the necessary strength to take the dominant hand in the market.
Technical signals are bearish today. This means that the Euro could re-test its one-year low of 1.15. The weekly S1 is likewise situated nearby. This scenario is likely if the aforementioned moving averages are not breached.
In case this move does occur, the daily high should be the 1.1670 area where the weekly PP, the 55– and 100-period (4H) and 200-hour SMAs are located.
GBPUSD Analysis: Fails To Overcome 1.32
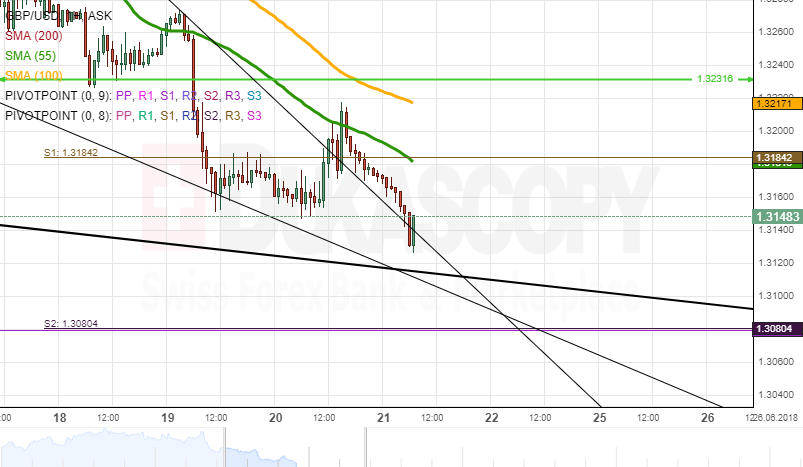
GBP/USD was moving in line with the short-term falling wedge on Wednesday. After ranging slightly below the weekly S1, the Pound picked up momentum and reached the 55-hour SMA at 1.32. This line, however, proved to be strong resistance which sent the pair back down to the 1.3150 level this morning.
The Sterling still lacks some pips to reach the bottom boundary of a channel down at 1.31. The give currency is likely to approach this boundary, being strengthened by the current bearish momentum.
However, the market sentiment should change to bullish later in the day, thus allowing the rate to test either the weekly S1 and the 55-hour SMA or the 100-hour moving average at 1.3185 and 1.3232, respectively. Important data releases from the UK are scheduled for today.
USDJPY Analysis: Tests Trend-Line
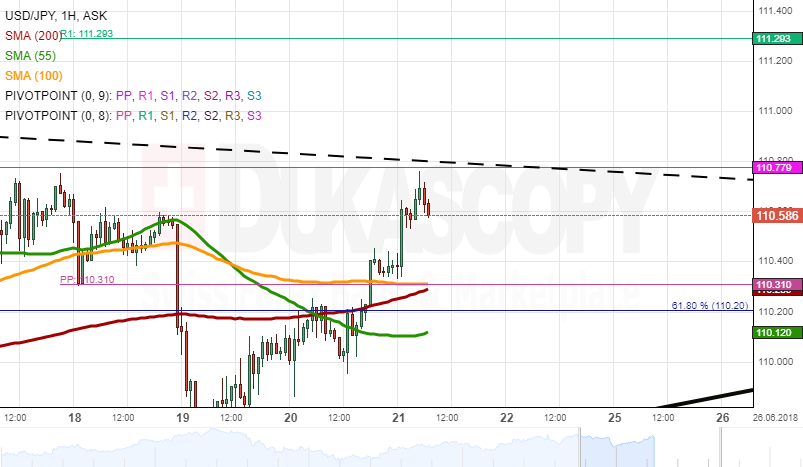
On Wednesday morning, the US Dollar tested the combined resistance of the 55-, 100– and 200-hour SMAs and the 61.80% Fibonacci retracement. This area hindered USD/JPY for some time until strong bullish sentiment pushed it even higher towards the monthly R1 and a four-week trend-line at 110.80.
Some upside potential is still apparent in the market, as technical indicators have not yet reached the overbought territory. Gains are expected to be capped near the weekly R1 at 111.30. Conversely, the pair respecting the above trend-line should return it to the massive support cluster at 110.20.
Given the rather calm day in terms of data releases, it is unlikely that this barrier is breached to the downside. In general, the pair could be located near 111.00 on Friday morning.
Gold Analysis: Goes For New 2018 Low
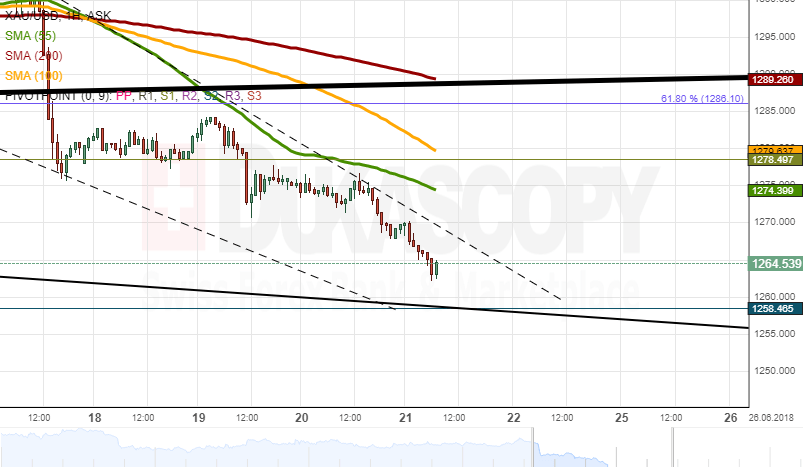
Gold remains guided by the 55-hour SMA for the second consecutive session. As a result, this moving average has pushed the rate to a new 2018 low and closer to the bottom boundary of a two-month descending channel and the monthly R2 at 1,255.00.
Technical indicators on the 1H and 4H time-frames being located in the strongly oversold territory should be an early indication of a soon change in market sentiment. It is not expected that the channel line is breached, as bulls should start to normalise the rate, especially following the rapid decline which began last Friday.
In terms of resistance, the yellow metal faces the 55– and 100-hour SMAs and the monthly S1 at 1.280.00. In case this cluster is surpassed, Gold should go for a test of the breached channel line and the 200-hour SMA circa 1.2890.00
GBP/JPY Daily Outlook
Daily Pivots: (S1) 144.77; (P) 145.19; (R1) 145.80; More...
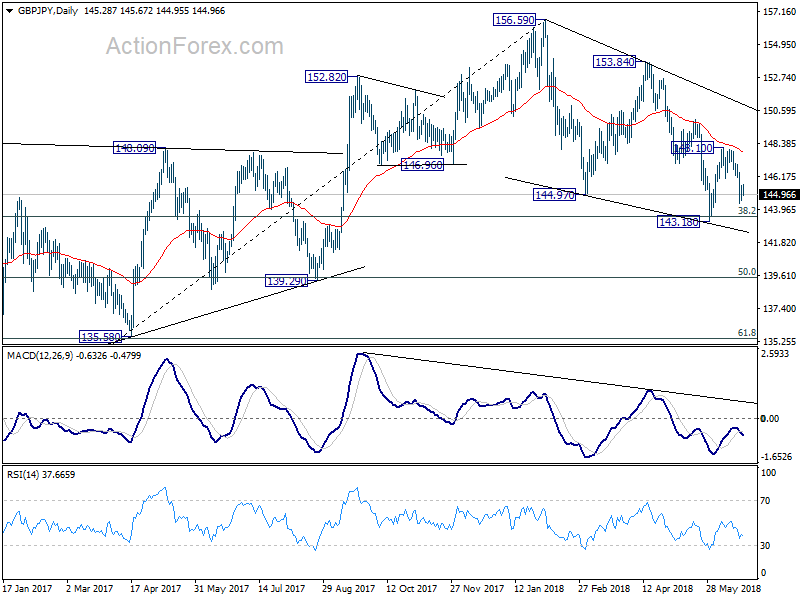
A temporary low is in place at 144.37 and intraday bias is turned neutral first. Further fall is expected with 146.46 minor resistance intact. Below 144.37 will target 143.18 first. Break will will resume larger decline from 156.59 and target 139.25/47 cluster support level. Nonetheless, above 146.46 will turn focus back to 148.10 resistance instead.
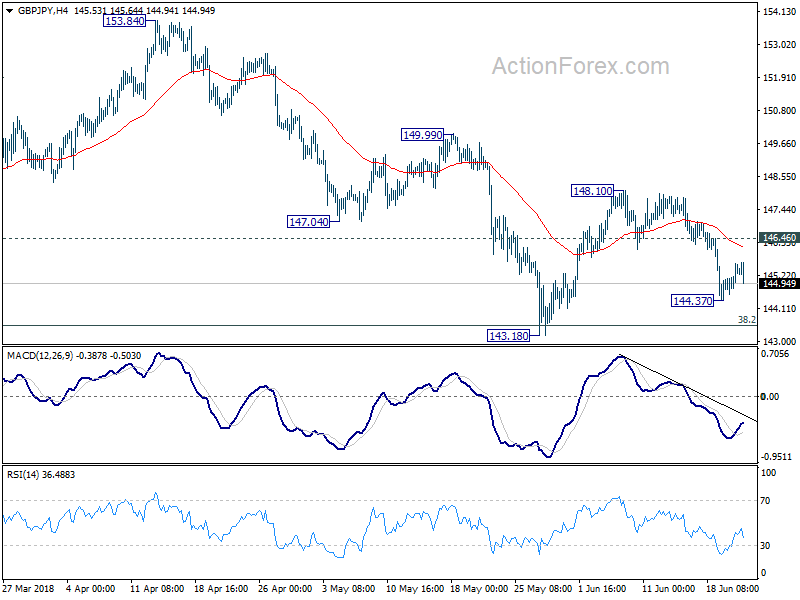
In the bigger picture, no change in the view that decline from 156.59 is a corrective move. In case of another fall, strong support should be seen above 139.29 cluster support (50% retracement of 122.36 to 156.59 at 139.47) to contain downside and bring rebound. Meanwhile, break of 153.84 should confirm that the correction is completed and target 156.59 and above to resume the medium term up trend.