

Sample Category Title
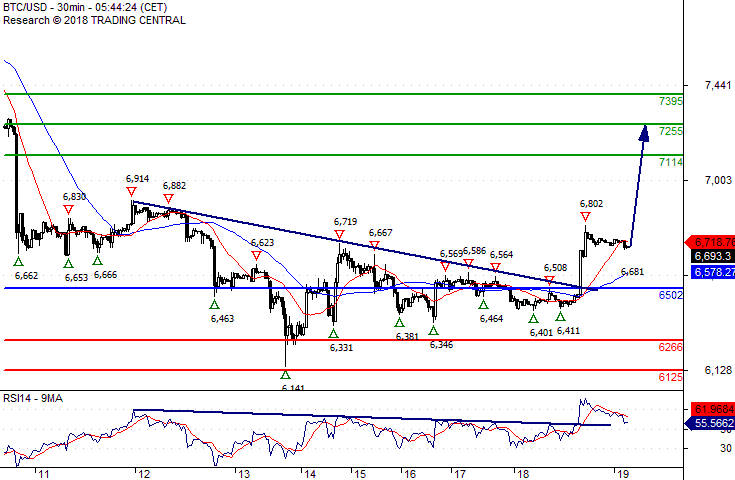
Bitcoin/Dollar As long As 6502 Is Support Look For 7114
Our pivot (invalidation) point stands at 6502.
Our preference As Long as 6502 is support look for 7114.
Alternative scenario The downside breakout of 6502 would call for 6266 and 6125.
Comment The RSI is above its neutrality area at 50. The MACD is below its signal line and positive. The pair could retrace. Moreover, the pair is below its 20 MA (6712) but above its 50 MA (6567).
Forex Technical Analysis: EUR/USD, USD/JPY, GBP/USD
EUR/USD
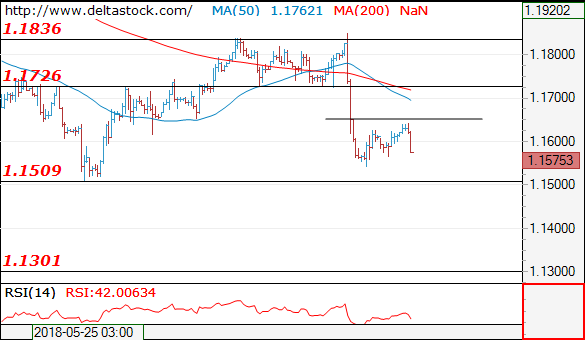
Current level - 1.1575
Yesterday's peak at 1.1650 could be the finale of the consolidation above 1.1540 and a break through 1.1510 will signal a renewal of the general downtrend, towards 1.1300.
| Resistance | Support | ||
| intraday | intraweek | intraday | intraweek |
| 1.1650 | 1.1830 | 1.1510 | 1.1480 |
| 1.1720 | 1.2060 | 1.1480 | 1.1300 |
USD/JPY
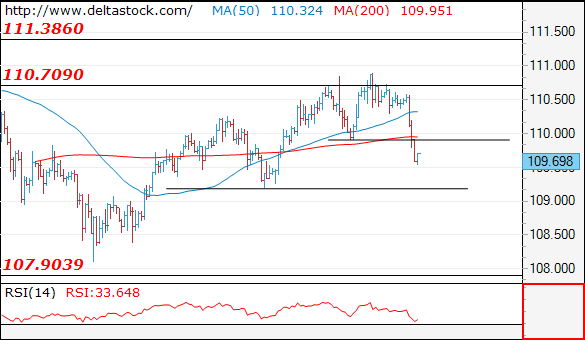
Current level - 109.69
The violation of 109.90 low signals, that the whole upmove since 108.10 is over and the third leg of the prolonged consolidation below 111.40 is underway. My outlook is bearish below 109.90, for a slide towards 109.20, en route to 107.90.
| Resistance | Support | ||
| intraday | intraweek | intraday | intraweek |
| 109.90 | 111.40 | 109.20 | 107.80 |
| 110.90 | 114.40 | 107.90 | 106.70 |
GBP/USD
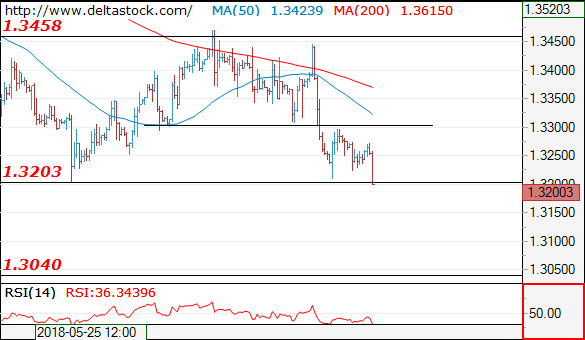
Current level - 1.3200
The consolidation pattern above 1.3200 seems complete and the outlook is bearish, for a slide towards 1.3040 area.
| Resistance | Support | ||
| intraday | intraweek | intraday | intraweek |
| 1.3300 | 1.3618 | 1.3203 | 1.3210 |
| 1.3460 | 1.3990 | 1.3110 | 1.3040 |
EUR/USD Analysis: Approaches Strong Resistance
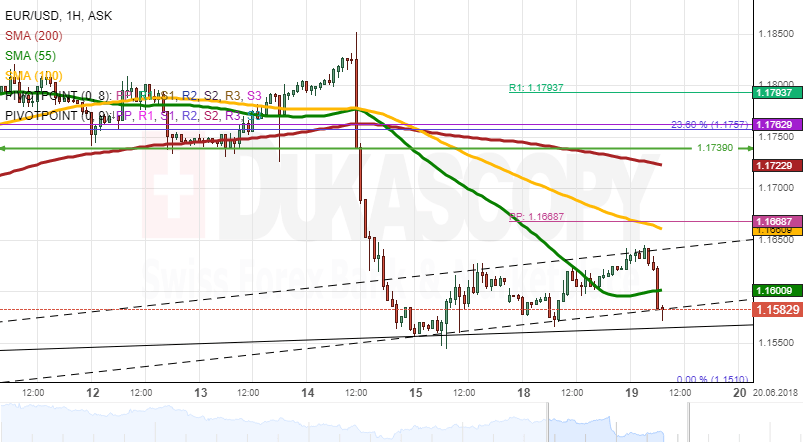
The Euro gained slight advantage against the US Dollar on Monday. It managed to breach the 55-hour SMA and test the 1.1650 mark this morning.
Technical indicators are gradually recovering from the massive plunge that occurred last week. It is likely that the price continues to edge higher during the first part of the day until 1.17 is reached. This territory should hinder or even halt further advance, as several SMAs on both the 1H and 4H time-frames are located around it. The ultimate high today should be 1.1750 which has provided strong support/resistance since mid-May.
Meanwhile, bears are expected to prevail later in the day, thus sending the Euro back lower and no lower than 1.15. By and large, the pair could be located near the 1.1600/50 range early tomorrow.
USDJPY Analysis: Plunges Due To US Tariffs
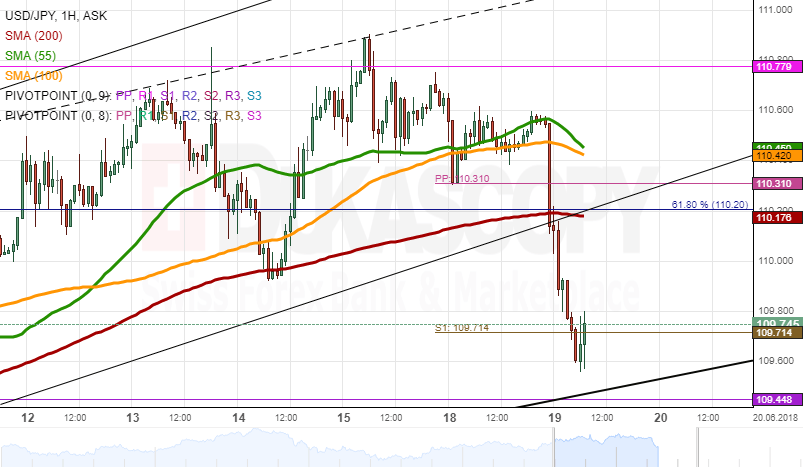
Monday's trading session was spent with very low volatility in the 110.40/60 range, thus leaving USD/JPY fluctuating around the 55– and 100-hour SMAs at 110.50.
This lack of movement changed drastically early today. The US introducing new tariffs on China resulted in higher demand for the Yen as a safe-haven currency. This caused a 0.90% plunge within a couple of hours, and the Greenback consequently breached all three SMAs, the three-week ascending channel and the weekly S1 just to trade near 109.60 at the time of this analysis.
It is expected that the nearby-located senior channel and the monthly PP mark a point of reversal, thus sending the pair back to the 61.80% Fibonacci retracement, the 200-hour and 55-period (4H) SMAs and the weekly PP circa 110.30 today.
GBP/USD Analysis: Remains At 2018 Low
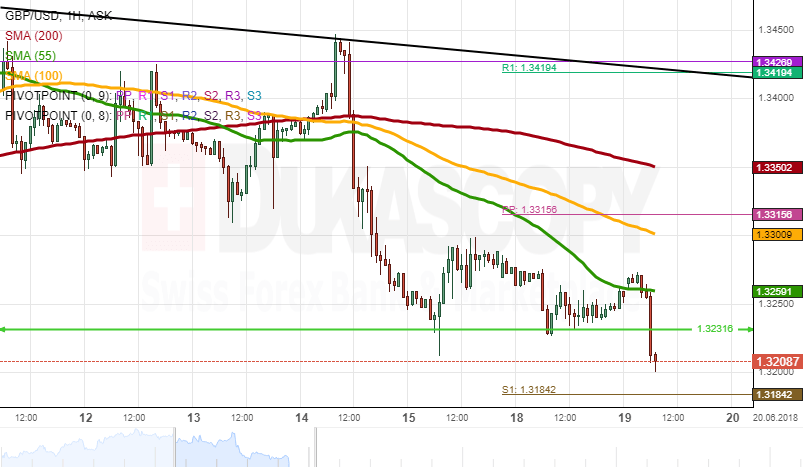
GBP/USD continues to trade sideways for the second consecutive session. The pair even diminished its trading range on Monday, as it was restricted by the seven-month low of 1.3230 and the 55-hour SMA.
It is expected that volatility increases today due to several fundamental releases; thus, one of these two barriers will be breached. Given that technical indicators are located in the oversold territory and that the rate has failed to breach this many-month low for two days, this move is more likely to occur to the upside.
This would allow the Sterling to approach the 1.3350 level which is strengthened by the 55– and 100-period (4H) and 200-hour SMAs. In case bears prevail, the Pound should not fall below the channel line at 1.3150.
Gold Analysis: Trades Near 1,280.00
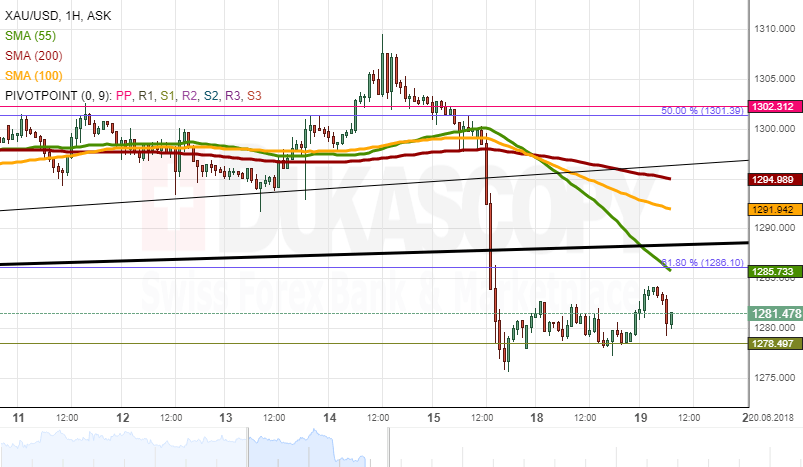
XAU/USD introduced no changes to its overall price level on Monday. The pair was trading in a narrow range around the 1.280.00 mark, as it failed to accelerate following the 1.77% plunge on Friday. A fall below 1,275.00 - its 2018 low - was restricted by the monthly S1.
It is expected that Gold picks up bullish momentum, similarly to technical indicators that have already started to move higher. It faces a strong resistance cluster formed by the 55-hour SMA, the 61.80% Fibo retracement and the breached senior channel at 1,290.00.
Some further advance should still follow, thus setting the 1,300.00 territory as today's high. This level is strengthened by the 55-, 100– and 200-period (4H) SMAs
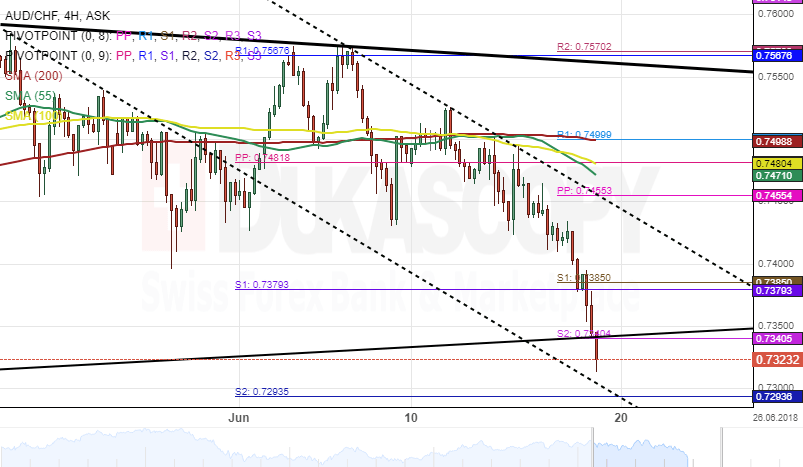
AUD/CHF 4H Chart: Breakout Alerts
The Australian Dollar has depreciated significantly against the Swiss Franc since the beginning of June. The decline started after the currency pair hit strong resistance cluster formed by the weekly and the monthly PPs near the 0.7570 mark.
During the past week, the 55-, 100-, 200-hour SMAs has pressurized the AUD/CHF exchange rate further south, as a result, the pair has lost more than 170 base points or 2.34 percent.
Given that a breakout had occurred through the lower boundary of an ascending trend line, the currency exchange rate could begin a long-term journey south, targeting the bottom border of a dominant descending pattern.
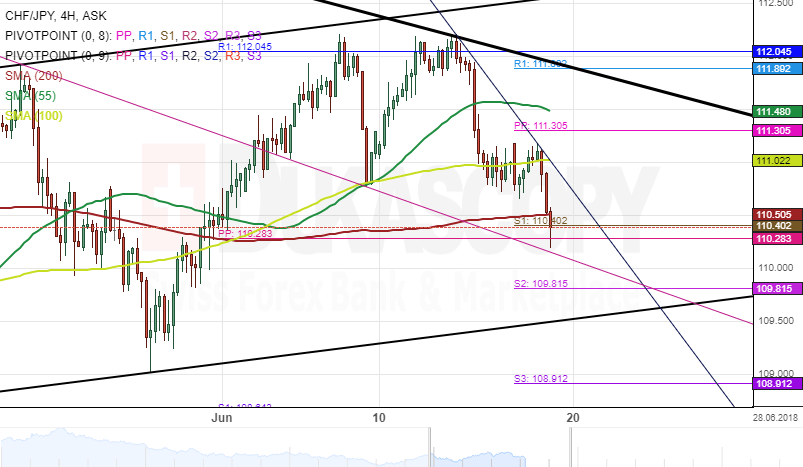
CHF/JPY 4H Chart: Falling Wedge
The Swiss Franc has been moving in several patterns against the Japanese Yen since the beginning of this year. The currency pair is currently trading in a falling wedge-like formation.
After hitting the upper boundary of a dominant channel on June 13, the CHF/JPY exchange rate began a new wave down. As a result, the price has declined 176-pips or 1.57 percent. At the time of this analysis, the pair has encountered a support cluster set by the 200-hour simple moving average and the weekly pivot point near the 110.40 mark.
Technical indicators flash bearish signals for the next couple of hours, therefore, bears might grow stronger during the following hours.
WTI Futures Erase Rally, Could Weaken Further In Short-Term
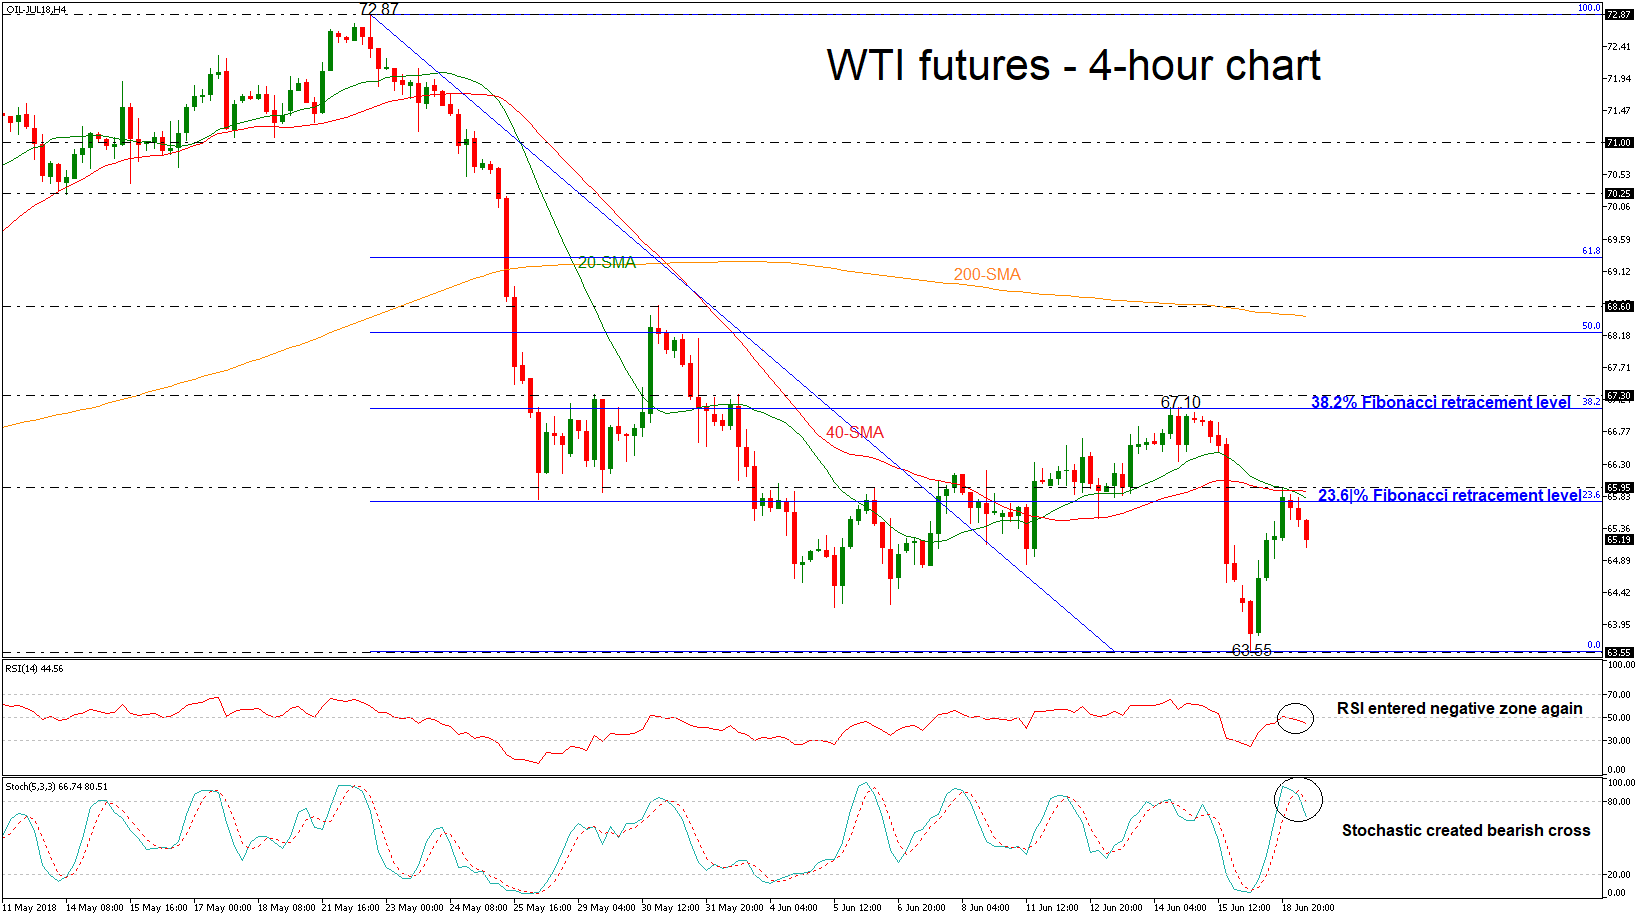
WTI futures have reversed back down again after finding resistance at the 65.95 resistance level, achieved on Monday, which overlaps with the 20- and 40- simple moving averages (SMAs) in the 4-hour chart. Additionally, the price dived below the 23.6% Fibonacci retracement level of the downleg from 72.87 to 63.55, near 65.75.
Looking at momentum oscillators on the 4-hour chart, they suggest further declines may be on the cards in the short-term. The RSI is below its neutral 50 line, detecting negative momentum, and is also pointing downwards. The stochastic oscillator, already negative, posted bearish a crossover of the %K and %D lines.
In case of further downside pressure, immediate support may be found near the latest two-month low of 63.55. A downside break of that zone would open the way for the 61.77 hurdle, taken from the low on April 6.
On the flip side, if the bulls retake control, price advances may stall initially near the latest highs at 65.95. A potential upside violation of this area would retest the 38.2% Fibonacci of 67.10, which overlaps with the peak on June 14.
In the medium-term, the oil price remains in a bearish mode as the price failed to extend gains in the previous week as it completed the fourth negative session in a row.
US President Trump Wants A Further $200 Billion Of Tariffs On China
While there was risk yesterday from Central Bankers very little was said to move the market. Instead the Trade War narrative boiled up again with the latest headlines that US President Trump is planning to impose an additional $200Bn in tariffs against China. The increase in intensity has markets rattled with stocks lower globally, Japan 225 Index down -1.75% overnight, and strong moves in USD Index as it fell below $95.00 yesterday, currently trading at $94.66. There was a noticeable shift in sentiment with USDJPY back down under 110.000 overnight. AUDUSD fell to a one year low at 0.73806 as Australia is at risk of spill over from the impact of US tariffs on China.
In Germany, Angela Merkel is under pressure politically as a two week deadline was imposed upon her to agree a deal on migrants. This deadline will fall at the end of June and failure is likely to result in a break in the coalition and her being forced from her position as Chancellor. The German 30 Index fell yesterday -1.3% from 13064.00 and has declined further overnight with the index expected to open around 12710.00.
US WTI Oil staged a recovery yesterday from support at $63.36 to a high of $65.78 after declining on Friday ahead of OPEC meetings this week. Headlines suggested that the production increases to be discussed at the meeting were much less that was reported, 300K to 600K against 1M to 1.5M barrels per day. The preliminary meeting is taking place today in Vienna and the market may be impacted by headlines from participants. Russia and Saudi Arabia want to increase production while Iran, Iraq and Venezuela want to maintain current levels.
EURUSD is unchanged overnight, trading around 1.16224.
USDJPY is down -0.83% in the early session, trading at around 109.619
GBPUSD is up 0.07% this morning trading around 1.32554
Gold is up 0.37% in early morning trading at around $1,282.70
WTI is down -0.90% this morning, trading around $65.12