Sample Category Title
Bitcoin Jumps After Square Receives NY License For Cash App
Square is one of the largest fintech companies in the world with a market capitalization of $26 billion. The company was founded by Jack Dorsey, who is the current CEO of Twitter. It provides payment processing services to online companies around the world.
In the past year, Square' stock has gone up by more than 170% after the company announced its decision to accept cryptocurrencies. Yesterday, its stock jumped by 3% after the company received a bitcoin license to operate a platform to trade cryptocurrencies in New York. Already, the app has more than 7 million active users.
After the news was released, the price of bitcoin jumped by more than 4% to an intraday high of $6720, the highest level since Tuesday last week. Traders believe that the new license will make it easy for millions of New Yorkers to buy and sell bitcoin – and other cryptocurrencies. They anticipate more demand from one of the wealthiest cities in the world.
However, traders should be cautious. In the past, imagined demand has never materialized. For example, when bitcoin futures started trading in CME and CBOE, many traders thought that increased demand from institutional investors would lead to higher prices. Sadly, the opposite happened as these institutions took short positions leading the price to fall by more than 50% this year.
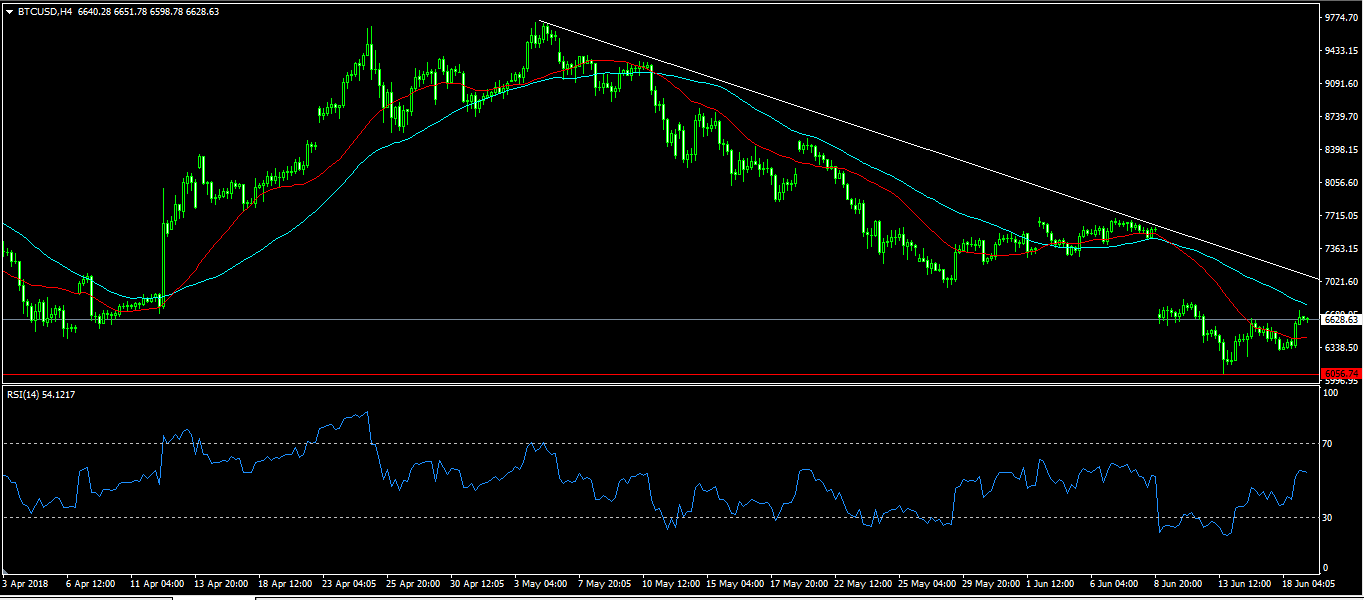
Last week, the BTC/USD pair fell after a South Korean exchange was hacked. The pair fell from $7450 to an intraweek low of $6050. In the past few days, the pair has traded within a narrow range as the market figures out what’s next. The pair is trading above the 25-day moving average, and slightly lower than the 50-day moving average. Its RSI is currently at 53 and moving up. In the coming days, the price could move up as it tries to recover from the losses. Alternatively, it could continue the downward trend as markets wait for major positive news which could propel it higher.
Monetary Policy, Data In The Headlines On Tuesday
The European Central Bank's summit in Portugal will continue to draw headlines on Tuesday. Monetary policy discussions will be accompanied by a handful of data releases from the European Union and United States.
In terms of economic data, action begins at 05:45 GMT when the Swiss State Secretariat for Economic Affairs (SECO) releases its latest economic forecast. The report monitors the growth trajectories of various components of Switzerland's gross domestic product (GDP).
At 08:00 GMT, the European Commission's statistical agency will report on the current account balance. Brussels' surplus is forecast to narrow to €30.2 billion in April compared with €32 billion the month before.
A report on Eurozone construction output will also make headlines at 09:00 GMT. In seasonally adjusted terms, construction spending is forecast to decline 0.8% month-on-month in April.
Shifting gears to the United States, at 12:30 GMT the Department of Commerce will issue its monthly report on building permits. Permits are expected to fall 1.4% to a 1.350 million-unit pace.
Energy traders will also be keeping a close eye on weekly crude inventory data courtesy of the American Petroleum Institute (API) at 20:30 GMT. The official inventory report released by the US Energy Information Administration (EIA) is due the following morning.
On the monetary policy front, ECB President, Mario Draghi, is expected to deliver public remarks in Portugal on Tuesday. ECB Executive Board member, Peter Praet, is also scheduled to speak publicly.
Federal Reserve Bank of St. Louis President, James Bullard, is scheduled to speak before the North American session kicks off.
EUR/USD
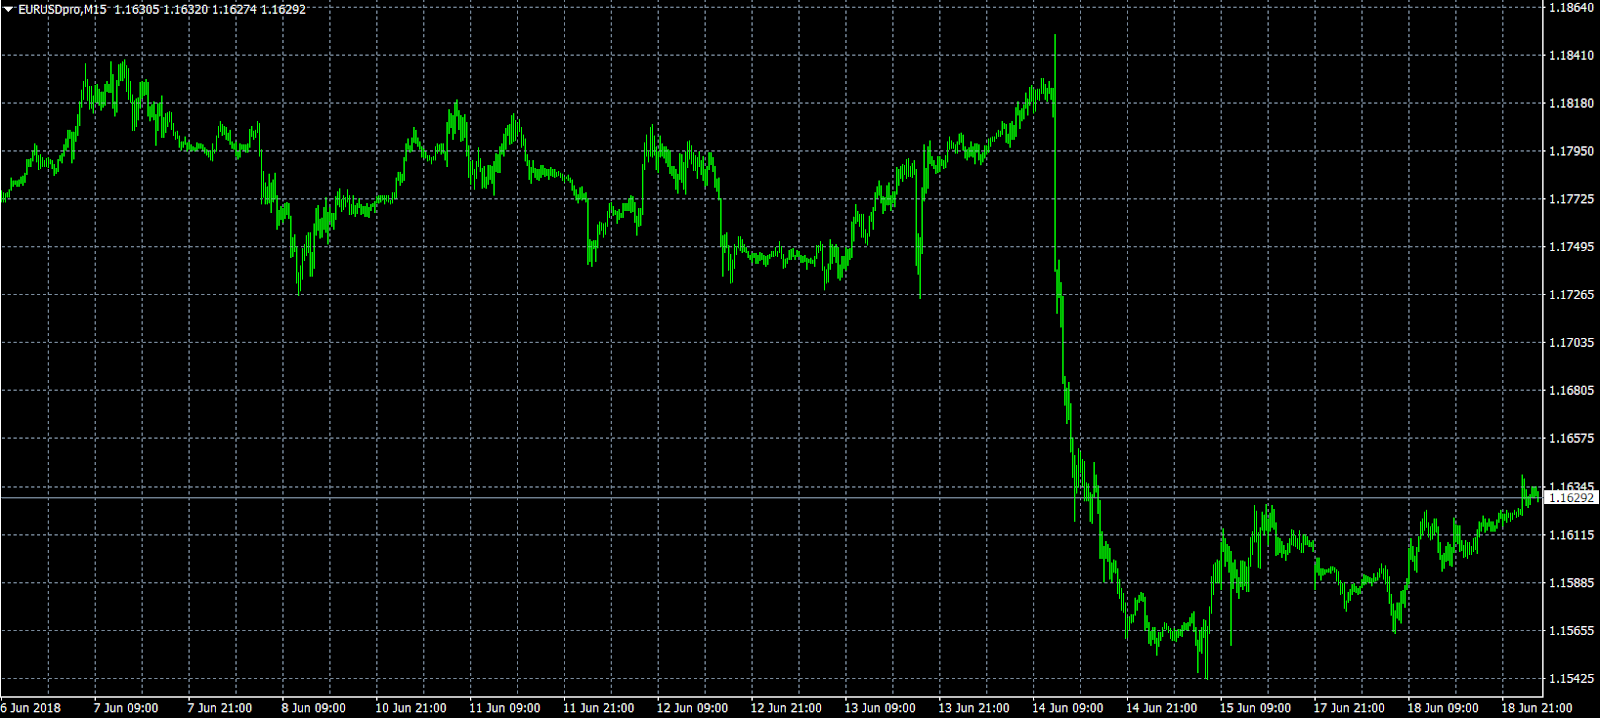
Europe's common currency is in recovery mode at the start of the week after experiencing a flash crash last Thursday at the hands of the ECB. EUR/USD is up roughly 65 pips from Friday's swing low and is now trading near 1.1630. Immediate support is located at 1.1543, the low from Friday. On the opposite side of the ledger, immediate resistance is located at the 1.1700 level.
GBP/USD
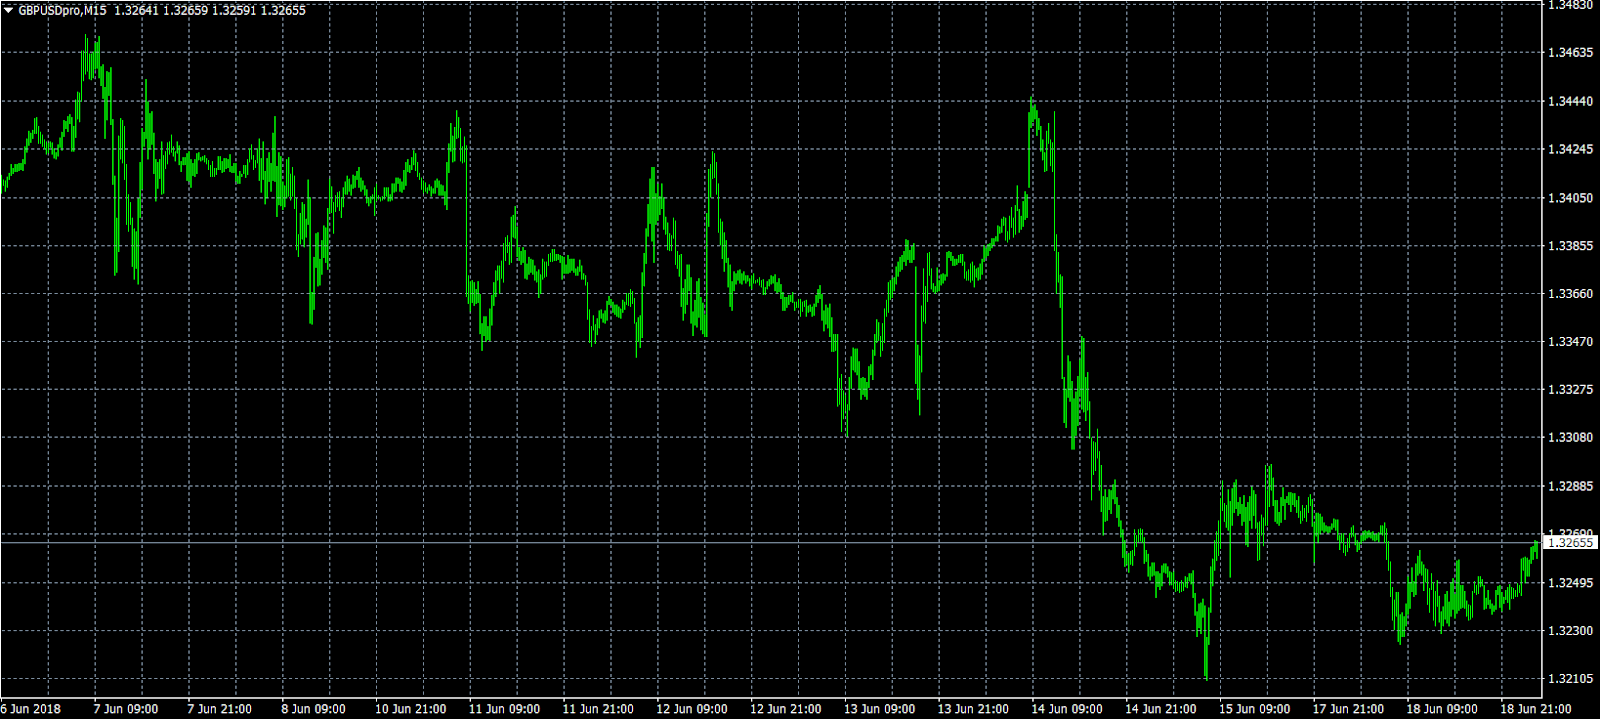
Cable is also consolidating off recent lows this week, with prices hovering near 1.3265. GBP/USD is attempting to generate support ahead of the Bank of England's upcoming policy meeting. Although no change in policy is expected, BOE officials could outline their expectations for the rest of the year.
USD/JPY
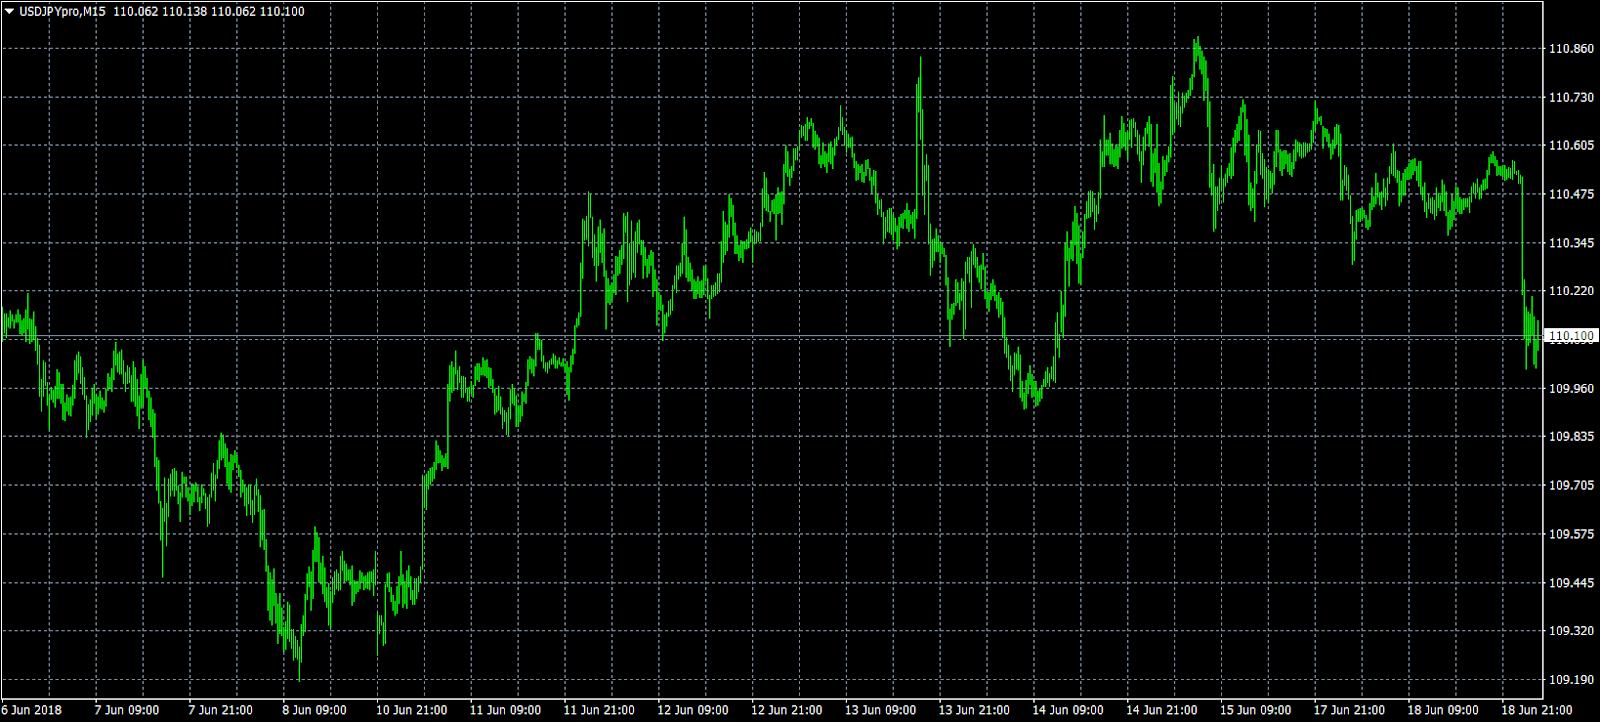
After reaching a high near 110.90 on Friday, USD/JPY is back on the defensive as the currency markets continue to consolidate. The pair is down 0.4% in Asian trade and is currently valued at 110.12. Despite recent volatile moves, USD/JPY is expected to stay rangebound between 108.00-111.00 for the foreseeable future.
Oil Looking Oversold Heading Into OPEC
There is a feeling of change within the strategy of how OPEC operates. This uncertainty has played a leading role behind the price of Oil coming under relentless pressure over the past couple of weeks, in anticipation of the cartel's meeting in Vienna this week.
Concerns that OPEC and its non-member allies will increase production for the first time since late 2016 is a major contributor behind the sharp selling of Oil in recent weeks. Back in late 2016, OPEC famously announced production cuts in a desperate measure to reduce the volume of oversupply in the market,the major catalyst behind Oil falling from above $110 to below $30 between mid-2014 and early 2016. Speculation that OPEC could now reposition its strategy in the opposite direction has encouraged WTI Oil to decline nearly $10 in less than a month.
Anticipation of a drastic shift in OPEC's mindset is quite puzzling to most when you consider that the previous theme heading into meetings was how much production output could possibly be cut from the market. This focus hassuddenly been replaced with anxiety over how much supply could potentially be added back into the market. This suggests that there has been a rebalancing after years of an overwhelming oversupply of the commodity; equally, it could also point to underlying concerns that have been evident for some time, that some members no longer wish to comply with OPEC's production cut deal.
Either way there is a shift in play,with previous global demand-side concerns being substituted to specific supply-side actions where the market is now expecting an increase in production. The recent price action in the Oil markets suggests that investors are confident that OPEC will announce an increase in production output, but I do not expect that it will be to the degree that articulates WTI falling $10 in less than a month. The commodity is at risk to being oversold as the OPEC get-togethercommences and could be in line for a rebound.
A hike in production output has already been priced in, but I am not ruling out a modest rebound over the upcoming trading sessions as the exact increase in production volume remains to be seen. There is a risk that traders are expecting a little bit too much heading into the meeting and could reshuffle their positions upon speculation that OPEC will not increase production to the amount currently being priced in by the market between 500,000 to 1 million barrels a day. After all, it did take a very long time to persuade OPEC committee members to agree to the historic production cuts all the way back in 2016, and it will not be a straightforward task to encourage a reverse in action. If the expected rise in production is less than 300,000 barrels a day, we can't rule out the possibility that there could be a rebound in prices.
Although both Saudi Arabia and Russia are thought to be actively encouraging an increase in production behind the scenes, this will likely be opposed by Iran, Venezuela and Iraq. While none of these three nations has anywhere near the amount of influence over OPEC as either Saudi Arabia or Russia, there will be power in numbers if other producers in the cartel reject the proposal to increase supply. This potential scenario does provide some light that traders would be mistaken to consider the OPEC outcome as a “done deal”.
One other factor that investors will need to carefully monitor is whether President Trump is now attempting to exert some influence over OPEC. The United States President has used social media to attack OPEC, and has in the past repeatedly called out the cartel for “artificially” inflating the value of Oil. If the market does attempt to appreciate on the OPEC meeting's outcome, it could encourage Trump to lash out at OPEC once again.
ECB Draghi: Policy to remain patient, persistent and prudent
ECB President Mario Draghi delivers his speech on "Monetary policy in the euro area" at the ECB Forum on Central Banking today.
He opened by saying that "the euro area's economy continues on a growth path and inflation is gradually returning towards our objective." But recent data created "questions about the durability of the growth outlook". And, the financial crisis presented policy makers with "new issues and fresh challenges in understanding the wage- and price-setting process." For now, "ample degree of monetary accommodation" will help lifting inflation towards target. And that will be "maintained even after a gradual winding-down of our net asset purchases." Draghi emphasized that "this requires monetary policy in the euro area to remain patient, persistent and prudent."
Draghi reiterated the decisions made last week on ending the asset purchase program in December, reinvesting the principle payments afterwards, and, keep interest rates unchanged through the summer of 2019. He added that "this enhanced forward guidance clearly signals that we will remain patient in determining the timing of the first rate rise and will take a gradual approach to adjusting policy thereafter.
EUR/USD Bearish Continuation Move Below 1.1589
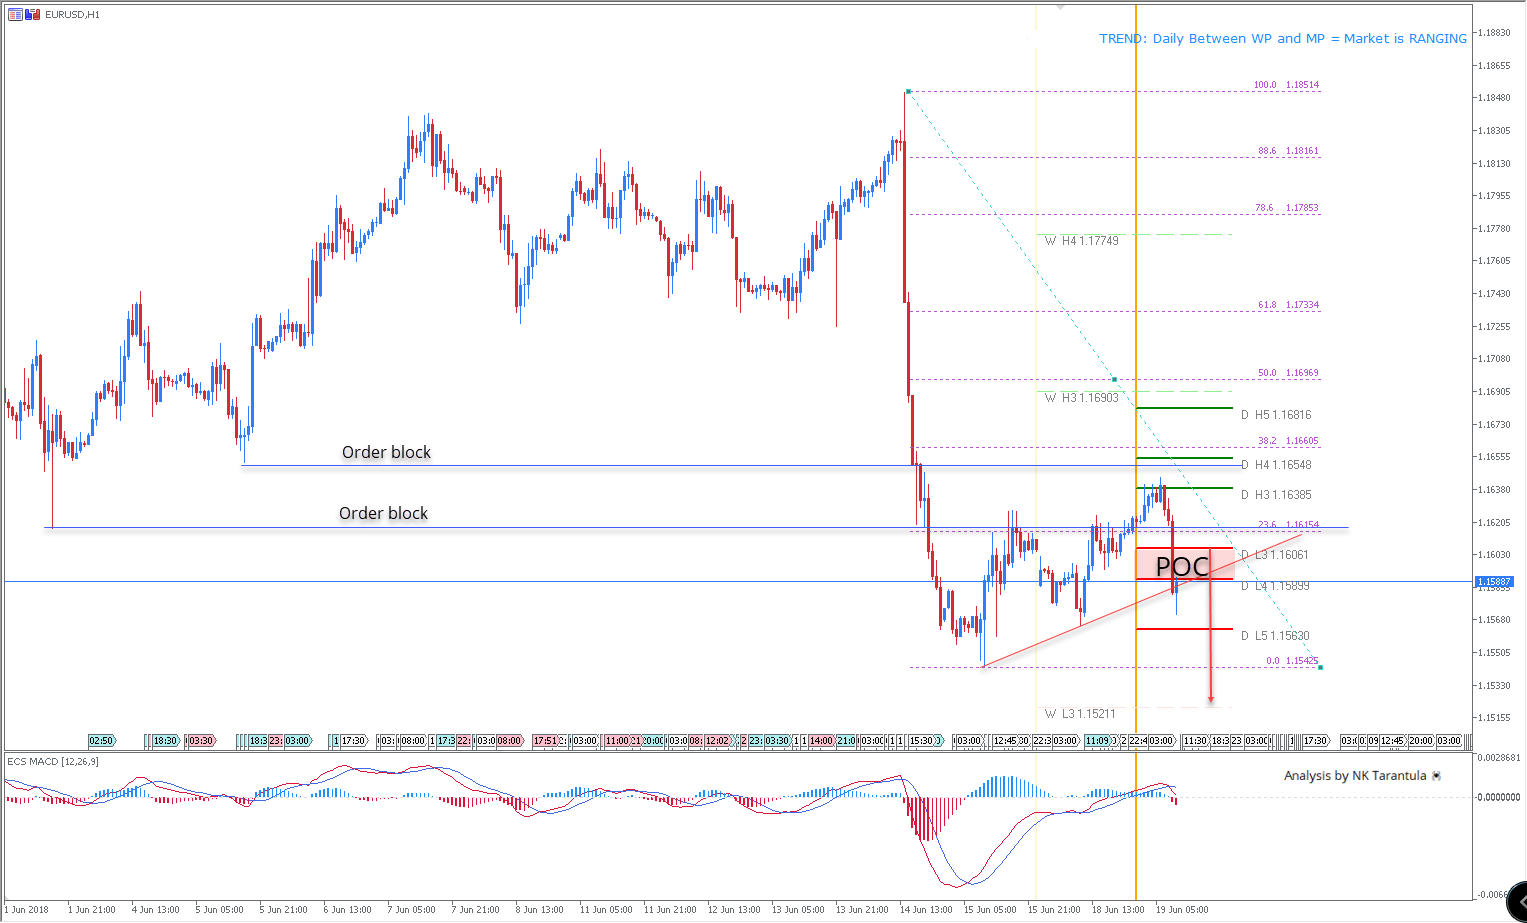
The EUR/USD rejected precisely as planned in yesterday's analysis. The rejection happened in the POC zone, and the EUR/USD went down. Today, the EUR/USD is trying to close below the trendline for a bearish continuation move. 1h momentum or 4h close below 1.1589 should provide a continuation towards 1.1542 and 1.1521. Two order blocks above are strong resistance points, and EUR/USD can get bullish only above them. However, a test of W L3 – 1.1521 seems likely.
W L3 - Weekly Camarilla Pivot (Weekly Interim Support)
W H3 - Weekly Camarilla Pivot (Weekly Interim Resistance)
W H4 - Weekly Camarilla Pivot (Strong Weekly Resistance)
D H4 - Daily Camarilla Pivot (Very Strong Daily Resistance)
D L3 – Daily Camarilla Pivot (Daily Support)
D L4 – Daily H4 Camarilla (Very Strong Daily Support)
POC - Point Of Confluence (The zone where we expect price to react aka entry zone)
EUR/CHF Daily Outlook
Daily Pivots: (S1) 1.1533; (P) 1.1566; (R1) 1.1598; More....
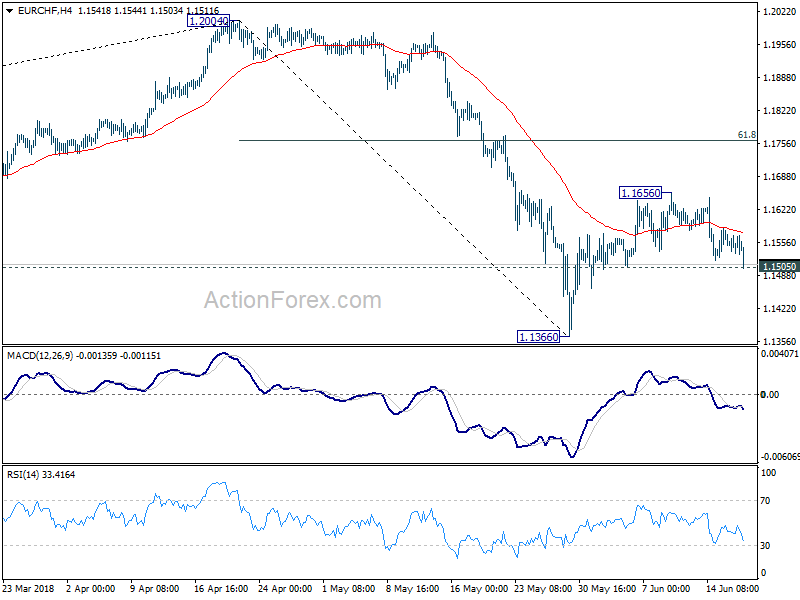
Focus in EUR/CHF is now on 1.1505 minor support with the current fall. Break will confirm completion of the rebound from 1.1366. And, corrective pattern from 1.2004 would then extend with the third leg, through 1.1366 low. On the upside, above 1.1656 will extend the rebound from 1.1366. But upside should be limited by 61.8% retracement of 1.2004 to 1.1366 at 1.1760.
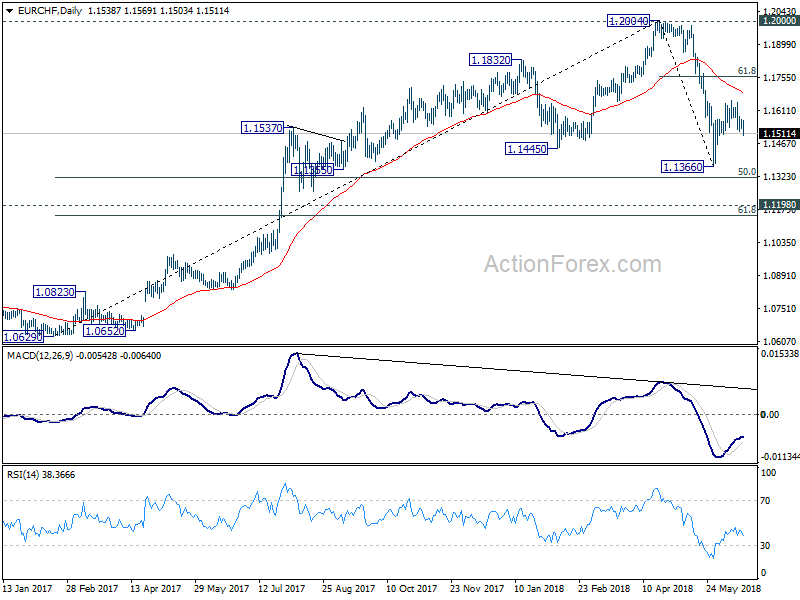
In the bigger picture, current development suggests solid rejection by prior SNB imposed floor at 1.2000. Considering bearish divergence condition in daily and weekly MACD, 1.2004 should be a medium term top. And price action from 1.2004 is correcting the up trend from 1.0629. Such correction is expected to extend for a while and therefore, we're not anticipating a break of 1.2004 in near term. Another decline cannot be ruled out yet. But in that case, strong support should be seen at 1.1198 (2016 high), 61.8% retracement of 1.0629 to 1.2004 at 1.1154 to contain downside.
GBP/JPY Daily Outlook
Daily Pivots: (S1) 146.01; (P) 146.55; (R1) 146.99; More...
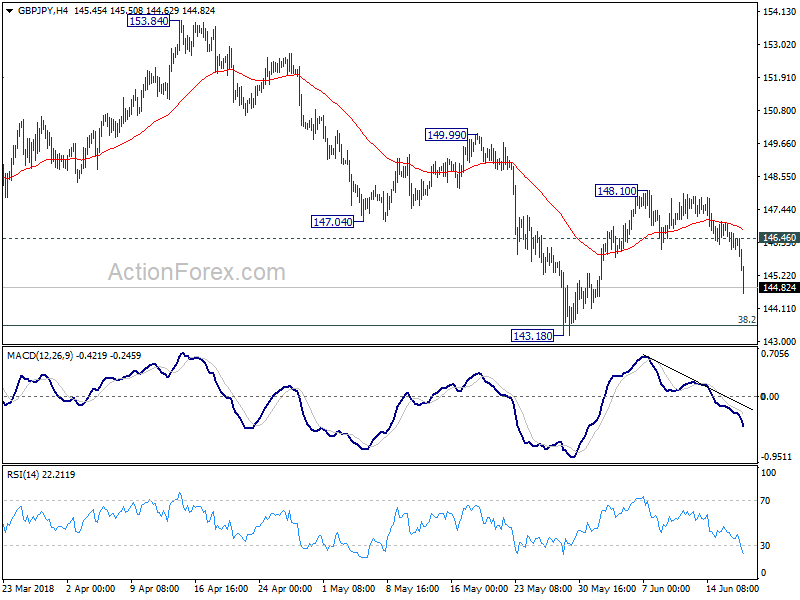
GBP/JPY's decline accelerates to as low as 144.62 so far today. The solid break of 145.82 minor support indicates completion of the rebound from 143.18. Intraday bias is turned back to the downside for 143.18 low. Firm break there will resume larger decline from 156.59 and target 139.25/47 cluster support level. On the upside, break of 146.46 minor resistance is needed to indicate completion of the fall. Otherwise, deeper decline will now be in favor in case of recovery.
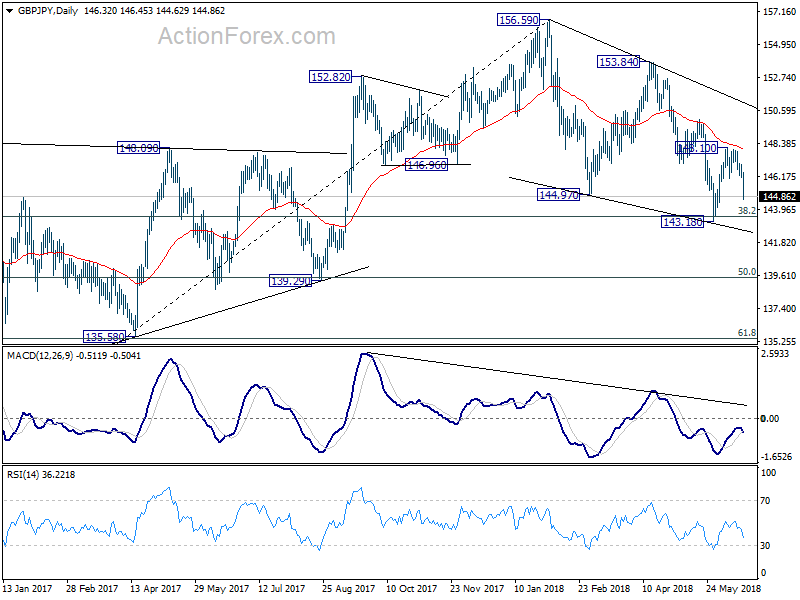
In the bigger picture, no change in the view that decline from 156.59 is a corrective move. In case of another fall, strong support should be seen above 139.29 cluster support (50% retracement of 122.36 to 156.59 at 139.47) to contain downside and bring rebound. Meanwhile, break of 153.84 should confirm that the correction is completed and target 156.59 and above to resume the medium term up trend.
EUR/JPY Daily Outlook
Daily Pivots: (S1) 127.99; (P) 128.30; (R1) 128.80; More....
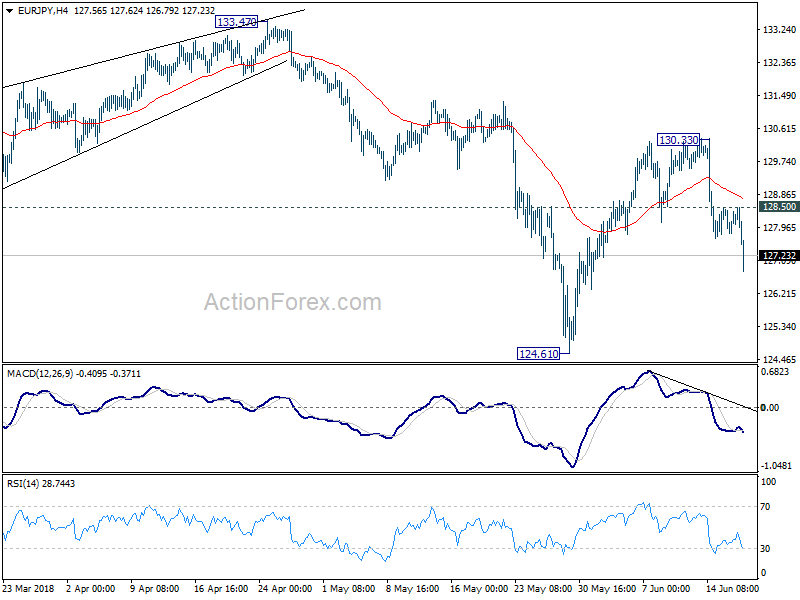
EUR/JPY's decline from 130.33 accelerates to as low as 126.79 so far. Rebound from 124.61 should have completed at 130.33 after rejection by 55 day EMA. Intraday bias is now on the downside for 124.08/61 support zone. On the upside, break of 128.50 minor resistance is needed to indicate completion of the fall. Otherwise, deeper decline will remain in favor even in case of recovery.
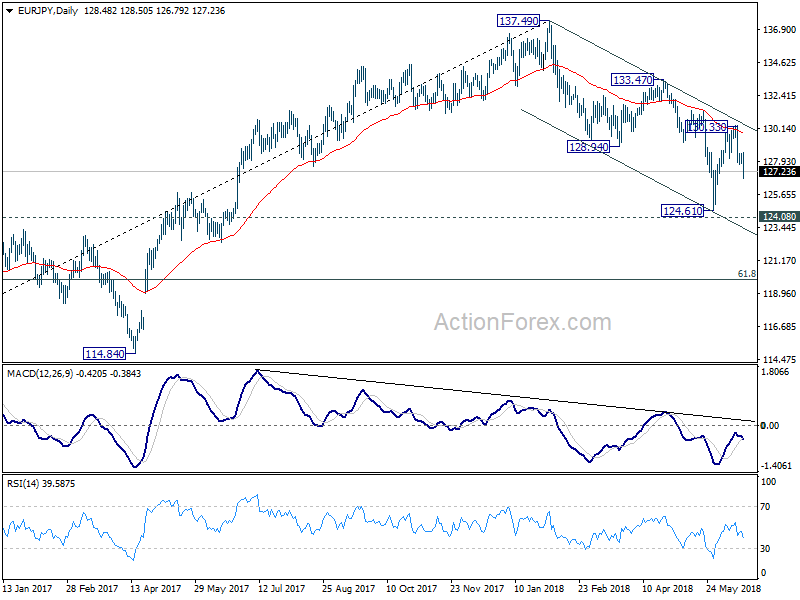
In the bigger picture, despite rebounding strongly ahead of 124.08 resistance turned support, there was no clear follow through buying. Note again that there is bearish divergence in daily MACD. Firm break of 124.08 will confirm trend reversal. That is, whole rise from 109.03 (2016 low) has completed at 137.49 already. In that case, deeper fall should be seen back to 61.8% retracement of 109.03 to 137.49 at 119.90 and below. Nonetheless, decisive break of 133.47 key resistance will likely extend the rise from 109.03 through 137.49 high.
EUR/GBP Daily Outlook
Daily Pivots: (S1) 0.8741; (P) 0.8761; (R1) 0.8793; More...
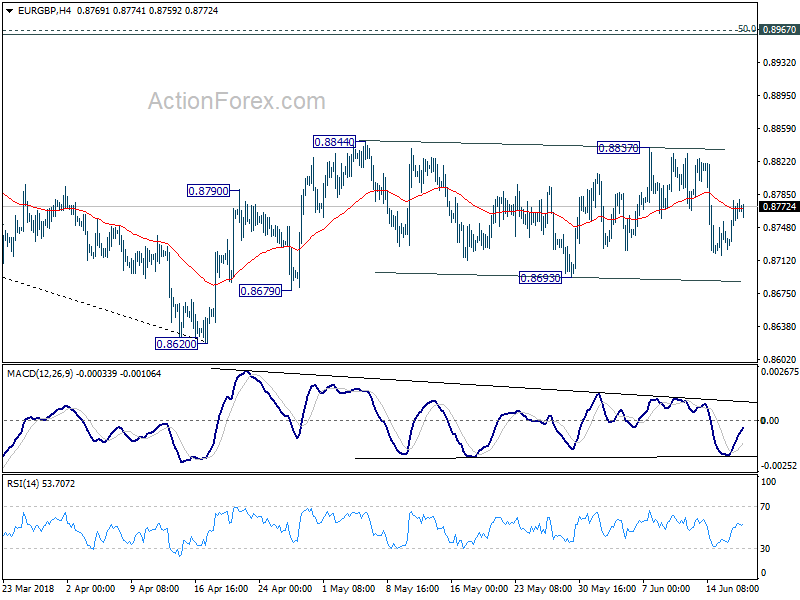
EUR/GBP is still bounded in range of 0.8693/8844 and intraday bias remains neutral. Outlook is unchanged that with .8693 minor support intact, we'd favor another rise. On the upside, break of 0.8844 will resume the rebound from 0.8620 for 0.8967 cluster resistance (50% retracement of 0.9305 to 0.8620 at 0.8963). However, break of 0.8693 will bring deeper fall back to retest 0.8620 low.
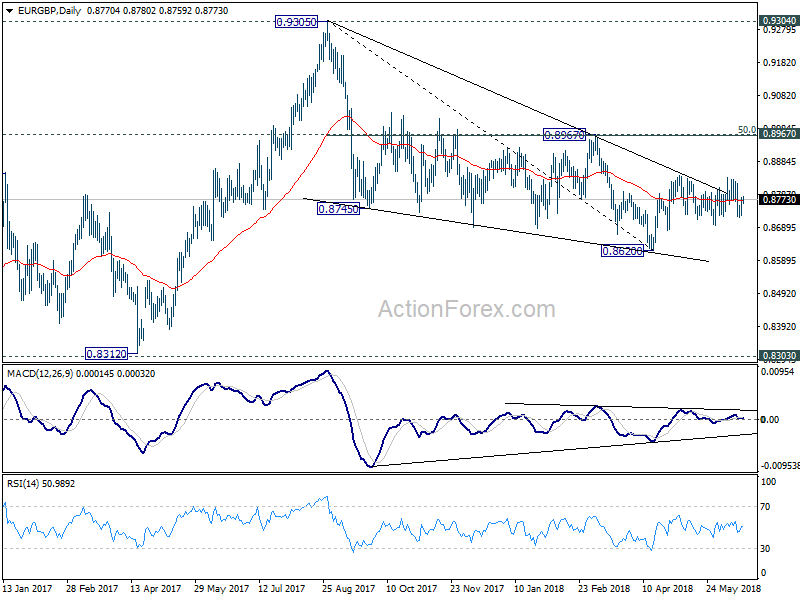
In the bigger picture, for now, the decline from 0.9305 is seen as a leg inside the long term consolidation pattern from 0.9304 (2016 high). Such consolidation pattern could extend further. Hence, in case of strong rally, we'd be cautious on strong resistance by 0.9304/5 to limit upside. Meanwhile, in another decline attempt, we'd expect strong support from 0.8116 cluster support (50% retracement of 0.6935 to 0.9304 at 0.8120) to contain downside.
EUR/AUD Daily Outlook
Daily Pivots: (S1) 1.5576; (P) 1.5623; (R1) 1.5702; More....
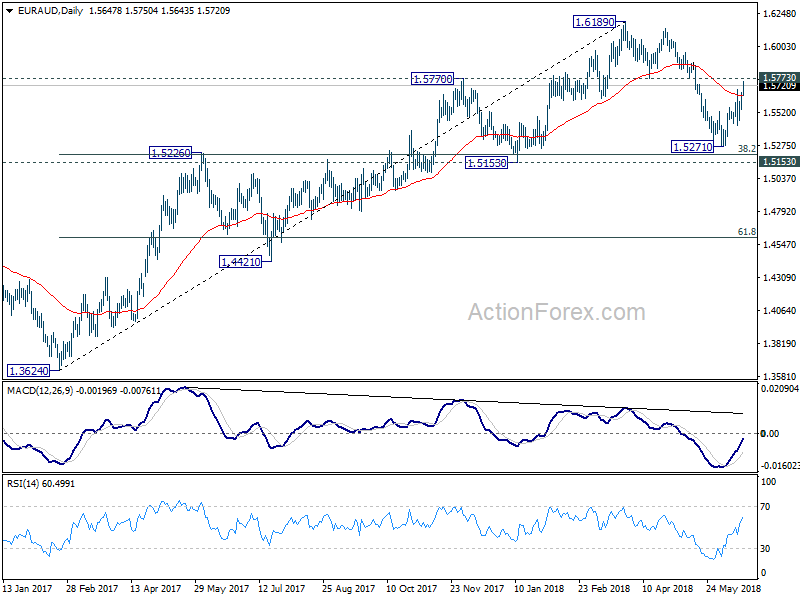
EUR/AUD's break of 1.5690 minor resistance suggests that rebound from 1.5271 has resumed. Current upside acceleration suggest that the decline from 1.6189 has possibly completed with three waves down to 1.5271 already. Intraday bias is now on the upside with focus on 1.5773 support turned resistance. Break will bring retest of 1.6189 high. On the downside, below 1.5601 minor support will turn intraday bias neutral instead.
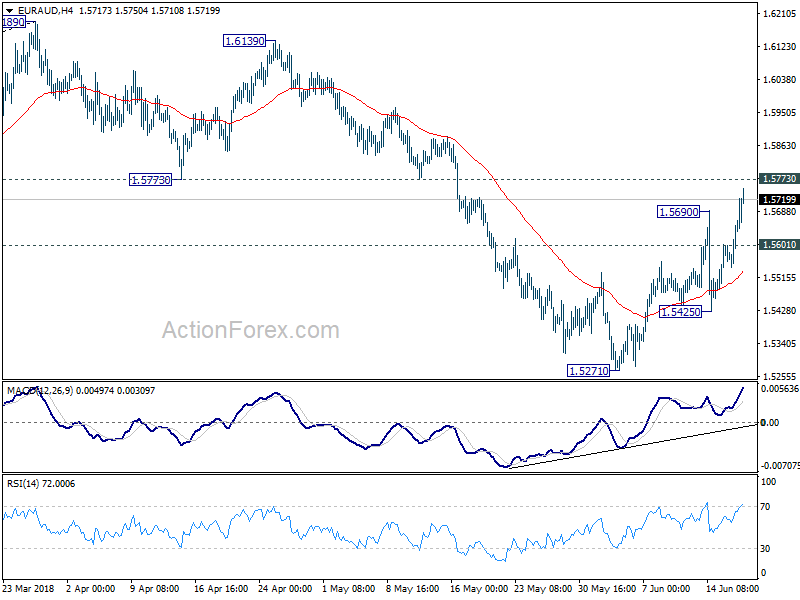
In the bigger picture, focus is back on 1.5773 support turned resistance with the current strong rebound. Firm break there will argue that medium term rise from 1.3624 (2017 low) is not completed yet. Further break of 1.6189 will target 1.6587 key resistance (2015 high). Though, rejection by 1.5773 will revive the case of bearish trend reversal and target 61.8% retracement of 1.3624 to 1.6189 at 1.4604.