Sample Category Title
Elliott Wave View: FTSE Calling For Another Leg Lower
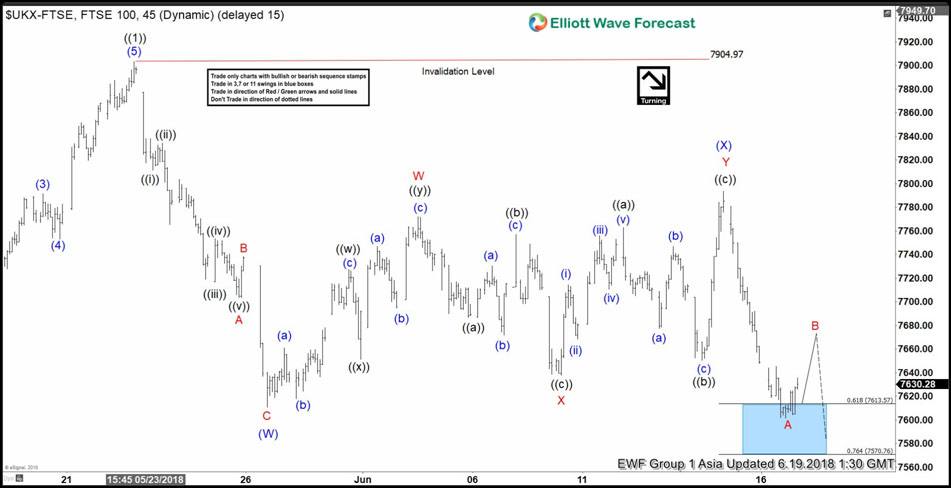
FTSE short-term Elliott Wave view suggests that the bounce to 7904.97 high on 5/22/2018 peak ended primary wave ((1)). Below from there, the index is doing a pullback in Primary wave ((2)) in 3, 7 or 11 swings to correct cycle from 3/23/2018 low. Down from 7904.97 high, the decline to 7610.66 low ended the first leg of the pullback in Intermediate wave (W). The internals of Intermediate wave (W) unfolded as Elliott wave Zigzag structure where Minor wave A ended at 7703.26, Minor wave B ended at 7738.46, and Minor wave C of (W) ended at 7610.66. Up from there, the bounce to 7793.45 high ended the correction against 5/22/2018 cycle in Intermediate wave (X). The internals of Intermediate wave (X) unfolded as double three structure where Minor wave W ended at 7772.12, Minor wave X ended at 7637.52 and Minor wave Y of (X) ended at 7793.45.
Then down from there, the index has made a new low below Intermediate wave (W) at 7610.66 low confirming the next leg lower within intermediate wave (Y) of ((2)) has started. Near-term, while below 7793.45 high, the rally is expected to fail in 3, 7 or 11 swings for another leg lower towards 7435.72 – 7504.01, which is 100%-123.6% Fibonacci extension area of Intermediate wave (W)-(X) to complete Primary wave ((2)). Afterwards, the index is expected to find buyer’s either for a new high or for 3 wave bounce at least. We don’t like selling it in the proposed pullback.
FTSE Elliott Wave 1 Hour Chart
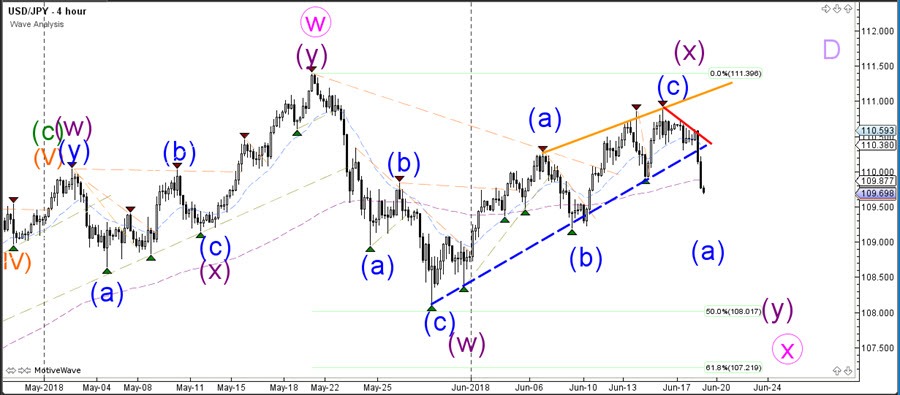
USD/JPY Bearish Breakout Of Rising Wedge Pattern
The USD/JPY broke below the support trend line after failing to break the previous top. The strong momentum could indicate a larger bearish correction.
The USD/JPY is probably expanding a larger WXY correction (purple) within wave X (pink).
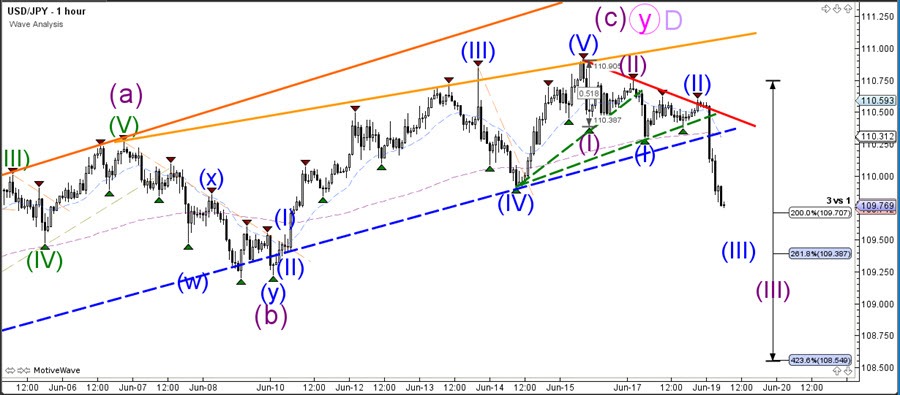
The USD/JPY could also have completed the wave D at the previous high but that seems less likely. Price is probably building a wave 3 (purple) within a wave A – see on the 4 hour chart – after breaking below the rising wedge chart pattern.
AUD/USD Daily Outlook
Daily Pivots: (S1) 0.7404; (P) 0.7431; (R1) 0.7449; More...
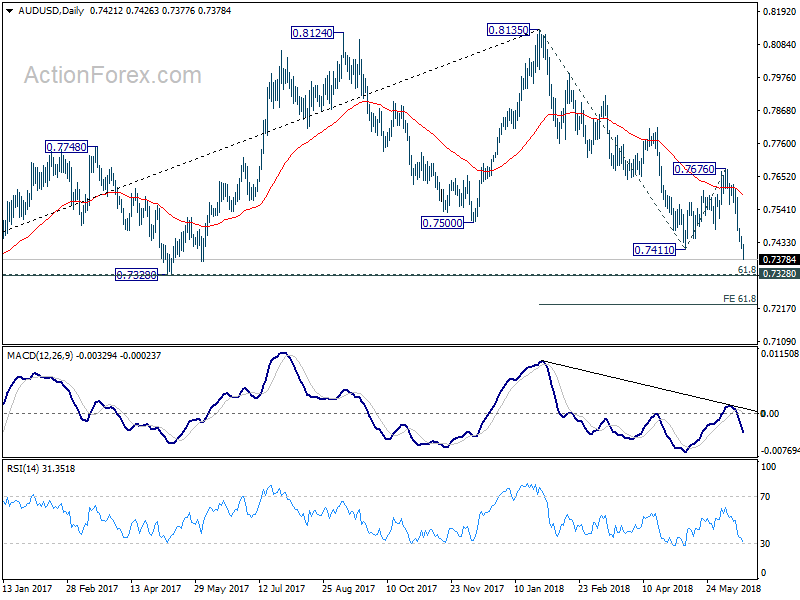
AUD/USD drops to as low as 0.7379 so far today. Solid break of 0.7411 support confirms resumption of larger decline from 0.8135. Intraday bias stays on the downside for 0.7328 cluster support (61.8% retracement of 0.6826 to 0.8135 at 0.7326) next. Break there will target 61.8% projection of 0.8135 to 0.7411 from 0.7676 at 0.7229 next. On the upside, above 0.7453 minor resistance will turn bias neutral and bring consolidations first.
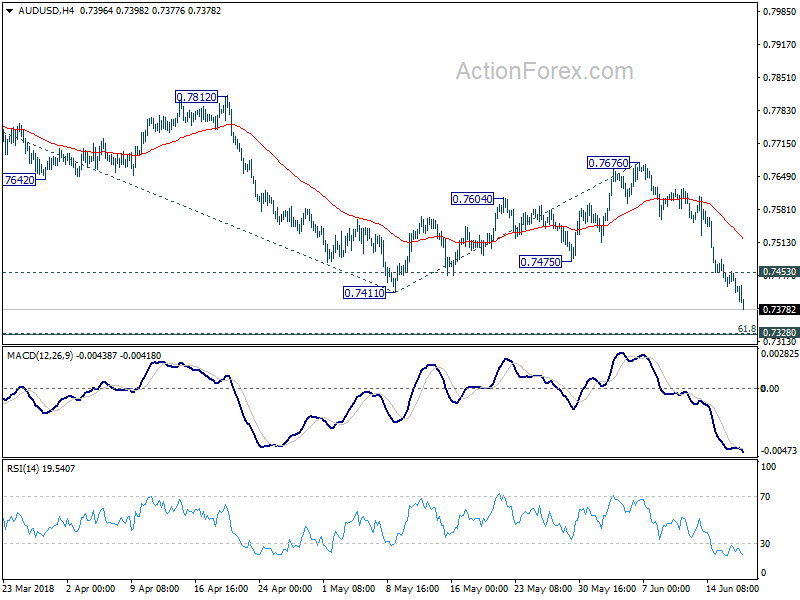
In the bigger picture, medium term rebound from 0.6826 is seen as a corrective move. Prior break of 0.7500 key support suggests that such correction is completed at 0.8135. Deeper decline would be seen back to retest 0.6826 low. In case of another rise, we'd expect strong resistance from 38.2% retracement of 1.1079 to 0.6826 at 0.8451 to limit upside to bring long term down trend resumption eventually.
USD/CAD Daily Outlook
Daily Pivots: (S1) 1.3156; (P) 1.3200; (R1) 1.3246; More...
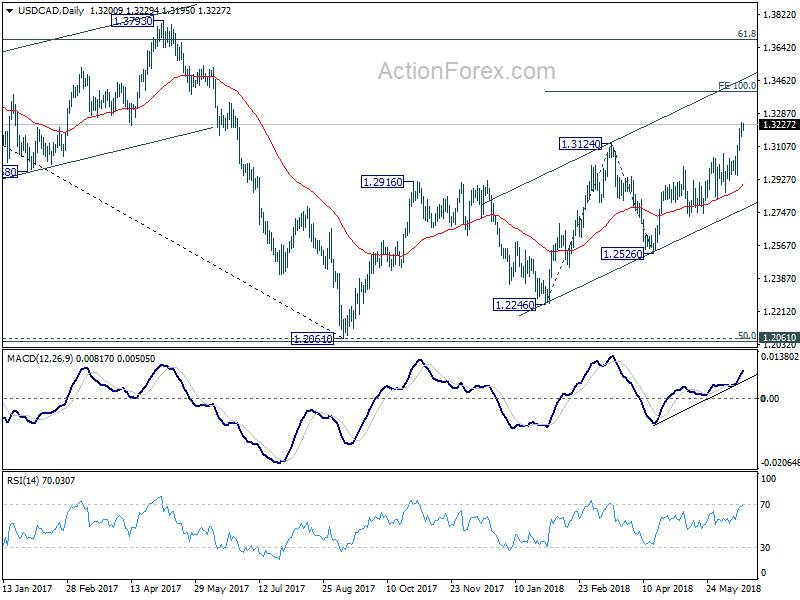
USD/CAD's rally is still in progress. Intraday bias stays on the upside for 100% projection of 1.2246 to 1.3124 from 1.2526 at 1.3404 next. On the downside, below 1.3120 minor support will turn intraday bias neutral and bring consolidation first, before staying another rise.
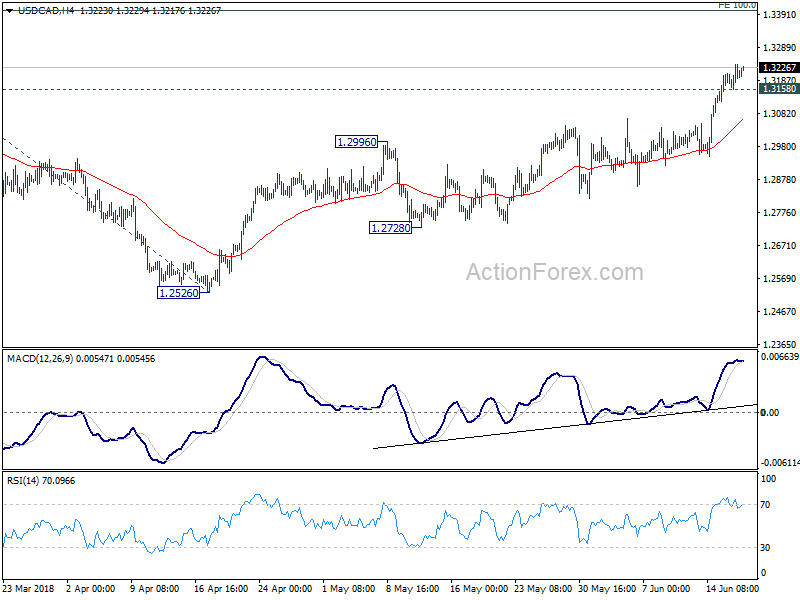
In the bigger picture, current development solidify the view of bullish trend reversal. That is fall from 1.4689 (2015 high) has completed at 1.2061, ahead of 50% retracement of 0.9406 (2011 low) to 1.4689 (2015 high) at 1.2048. Further rally should be seen for 61.8% retracement of 1.4689 to 1.2061 at 1.3685 and above. This will now be the preferred case as long as 1.2526 support holds, even in case of deep pull back.
EUR/USD Daily Outlook
Daily Pivots: (S1) 1.1584; (P) 1.1604 (R1) 1.1644; More.....
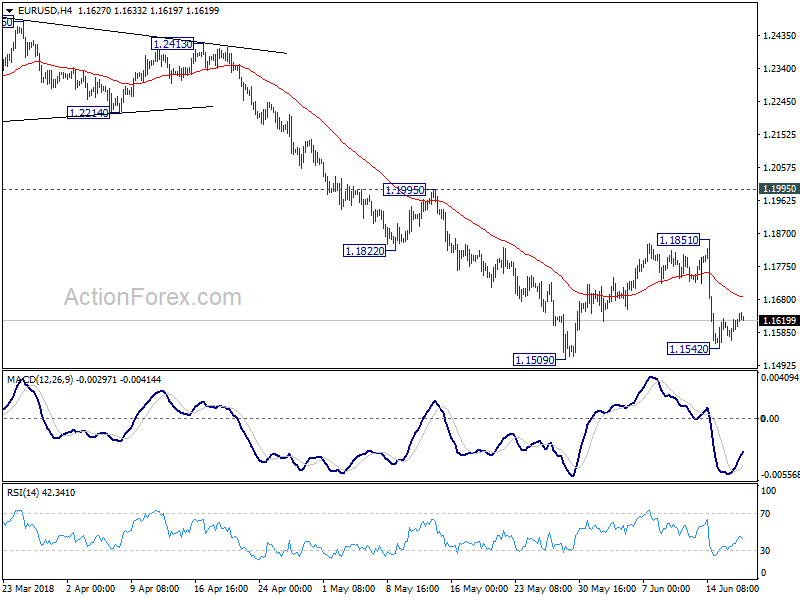
Intraday bias in EUR?USD remains neutral as this point for some more consolidation. Upside of recovery should be limited below 1.1851 resistance to bring fall resumption. Break of 1.1509 will resume larger decline from 1.2555 through 50% retracement of 1.0339 to 1.2555 at 1.1447 to 61.8% retracement at 1.1186.
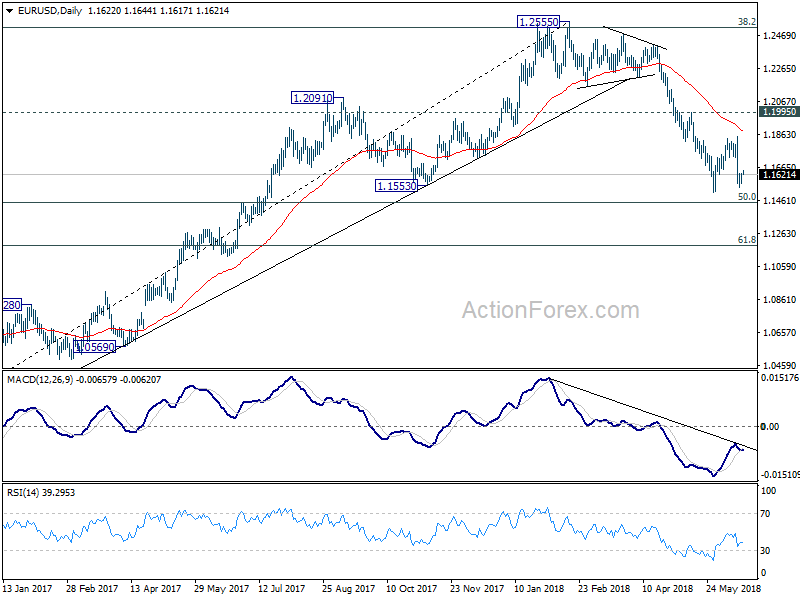
In the bigger picture, current development suggests that EUR/USD was rejected by 38.2% retracement of 1.6039 (2008 high) to 1.0339 (2017 low) at 1.2516. And, a medium term top was formed at 1.2555 already. Decline from there should extend further to 61.8% retracement of 1.0339 to 1.2555 at 1.1186 and below. For now, even in case of rebound, we won't consider the fall from 1.2555 as finished as long as 1.1995 resistance holds.
GBP/USD Daily Outlook
Daily Pivots: (S1) 1.3220; (P) 1.3253; (R1) 1.3279; More...
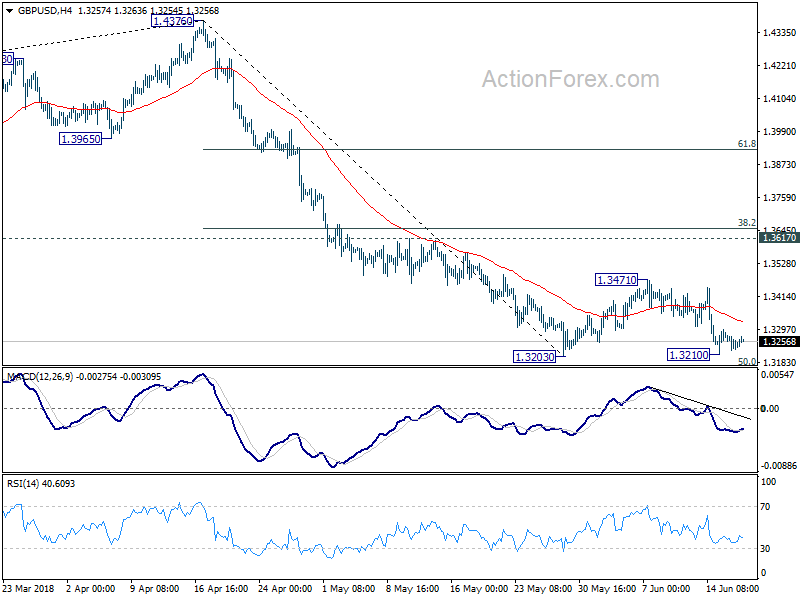
Intraday bias in GBP/USD is turned neutral as a temporary low is formed at 1.3210, just ahead of 1.3203. Some more consolidations could be seen. But upside of recovery should be limited below 1.3471 resistance. Break of 1.3203 will finally confirm resumption of larger decline from 1.4376. In that case, GBP/USD should target 50% retracement of 1.1946 to 1.4376 at 1.3161 first, and 61.8% retracement at 1.2875 next.
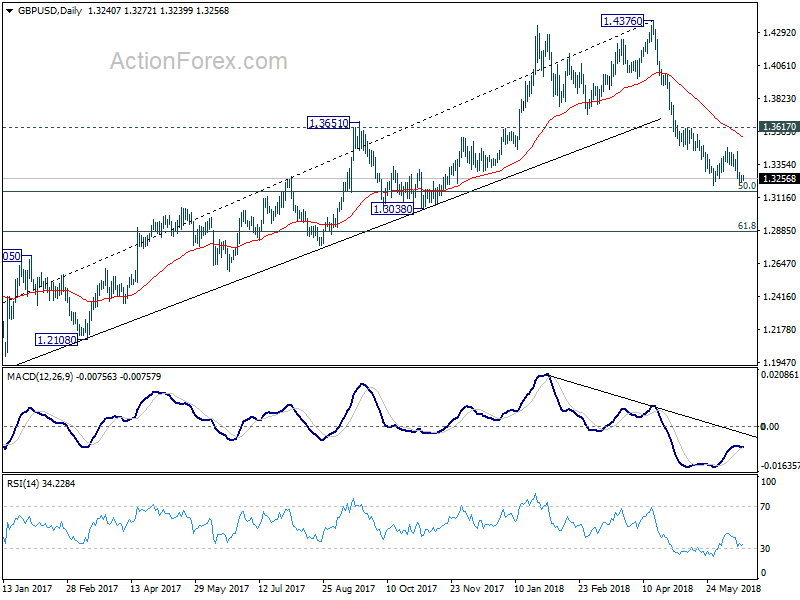
In the bigger picture, current development suggests that whole medium term rebound from 1.1936 (2016 low) has completed at 1.4376 already, with trend line broken firmly, on bearish divergence condition in daily MACD, after rejection from 55 month EMA (now at 1.4182). 61.8% retracement of 1.1936 (2016 low) to 1.4376 at 1.2874 is the next target. We'll pay attention to the reaction from there to asses the chance of long term down trend resumption. For now, outlook will stay bearish as long as 1.3617 resistance holds, even in case of strong rebound.
USD/CHF Daily Outlook
Daily Pivots: (S1) 0.9929; (P) 0.9959; (R1) 0.9983; More...
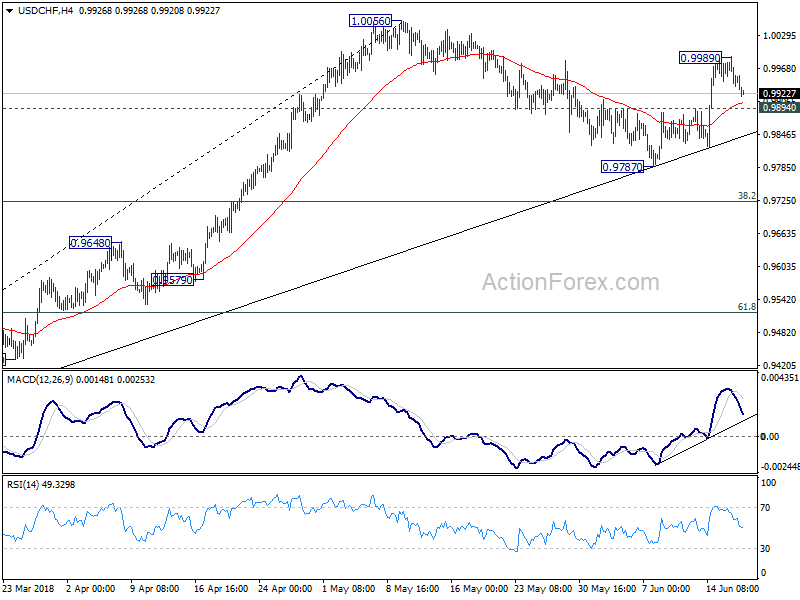
Intraday bias in USD/CHF remains neutral fir the moment. With 0.9894 minor support intact, another rise is in favor. The corrective fall from 1.0056 should have completed at 0.9787. Above 0.9989 will bring retest of 1.0056 first. Break will resume the rise from 0.9186 and target 61.8% projection of 0.9186 to 1.0056 from 0.9787 at 1.0325, which is close to 1.0342 key resistance. However, break of 0.9894 will likely extend the correction, possibly through 0.9787 before completion.
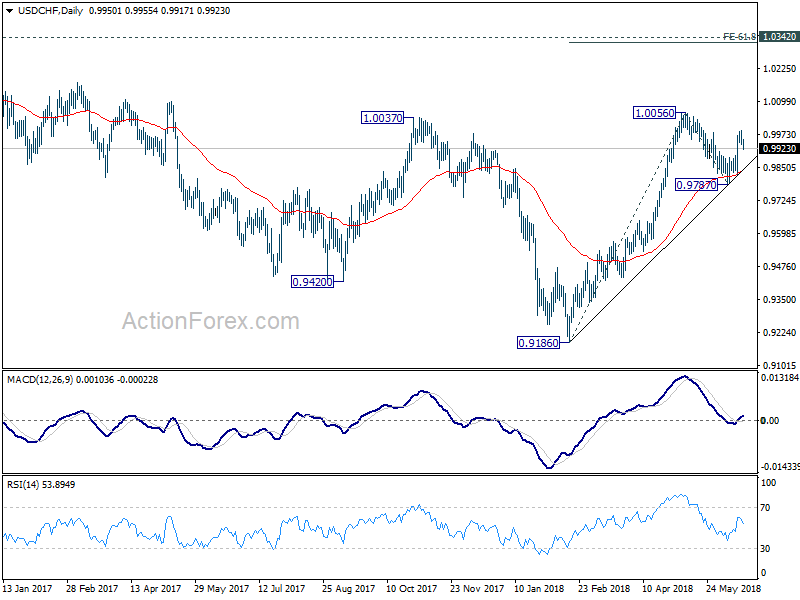
In the bigger picture, medium term decline from 1.0342 has completed with three waves down to 0.9186. Rise from there is currently viewed as a leg inside the long term range pattern. Hence, while further rally would be seen, we'd be cautious on strong resistance from 1.0342 to limit upside. For now, further rise is expected as long as 38.2% retracement of 0.9186 to 1.0056 at 0.9724 holds. However, sustained break of 0.9724 will dampen this bullish view and would at least bring deeper fall to 61.8% retracement at 0.9518.
USD/JPY Daily Outlook
Daily Pivots: (S1) 110.32; (P) 110.53; (R1) 110.77; More...
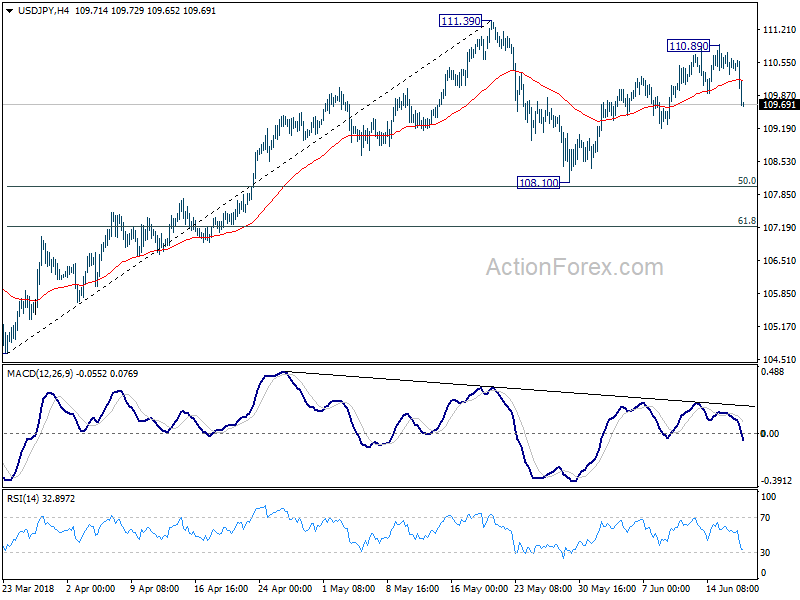
USD/JPY's break of 109.91 minor support suggests that corrective rebound from 108.10 has completed at 110.89 already. Intraday bias is turned back to the downside for 108.10 support and possibly below. Fall from 110.89 is seen as the third leg of consolidation pattern from 111.39. Hence, we'd expect strong support from 61.8% retracement of 104.62 to 111.39 at 107.20 to contain downside and bring rebound. On the upside, above 110.89 will bring retest of 111.39 instead.
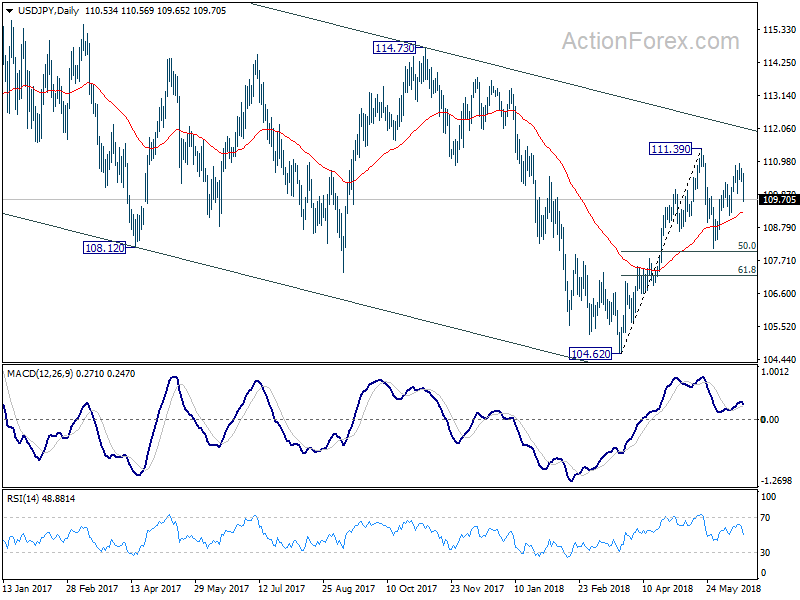
In the bigger picture, at this point, we're slightly favoring the case that corrective decline from 118.65 (2016 high) has completed with three waves down to 104.62. Above 111.39 will affirm this view and target 114.73 for confirmation. However, it should be noted that USD/JPY is bounded in medium term falling channel from 118.65 (2016 high). Sustained break of 61.8% retracement of 104.62 to 111.39 at 107.20 will likely resume the fall from 118.65 through 104.62 low.
Yen Continues to Shine as Trade Tension Escalates. AUD, NZD, CAD Suffer
Yen and Swiss Franc continue to dominate the market on risk aversion as trade tensions escalate. The US markets didn't perform too badly indeed. DOW closed just down -103.01 pts or -0.41% overnight at 24987.47. S&P was down -5.91 pts or -0.21%. NASDAQ even managed to gain 0.65 pts or 0.01%. Nonetheless, Asian markets are trading in deep red, with Nikkei losing -1.46% at the time of writing. Hong Kong HSI is down -2.18%. Australian, New Zealand and Canadian Dollar are the biggest casualties under current market sentiment while Dollar also loses some ground.
Technically, USD/JPY's break of 109.91 support indicates near term reversal and it could be heading back to 108.10 support to extend the consolidation pattern from 111.39. EUR/JPY and GBP/JPY also breaks 127.69 and 145.82 support and should be heading to near term low at 124.61 and 143.18 respectively. AUD/USD's break of 0.7411 support also indicates resumption of fall from 0.8135, towards 0.7328 cluster support.
China condemns US blackmailing after Trump threatens with extra tariffs on USD 200B Chinese products
Trump ordered US Trade Representative to identify USD 200B worth of Chinese products for additional 10% tariffs. It noted in the statement that "the initial tariffs that the President asked us to put in place were proportionate and responsive to forced technology transfer and intellectual property theft by the Chinese. It is very unfortunate that instead of eliminating these unfair trading practices China said that it intends to impose unjustified tariffs targeting U.S. workers, farmers, ranchers, and businesses. At the President's direction, USTR is preparing the proposed tariffs to offset China's action."
The Chinese Ministry of Commerce vowed to fight back with "qualitative" and "quantitative" for any additional tariffs. The MOFCOM condemned to initiative of imposing extra tariffs on USD 200B of Chinese goods. It said in a statement today that "Such a practice of extreme pressure and blackmailing deviates from the consensus reached by both sides on multiple occasions, and is a disappointment for the international community." And, "the United States has initiated a trade war and violated market regulations, and is harming the interests of not just the people of China and the U.S., but of the world."
US farmer group to launch TV ads against trade war
Trump's protectionist trade policy are causing a lot of concerns from US farmers. The steel and aluminum tariffs on Mexico have already triggered retaliation on US agriculture products. The trade war with China is even a bigger concern. Brian Kuehl, executive director of Farmers for Free Trade, said "the reason you are seeing people increase the pressure now is because the pressure is increasing on them. Now the impact is really starting to hit. It is not something you can just take lightly."
The group issued a statement last week in response to the section 301 tariffs on China. There it noted imposing tariffs on China is "no longer a negotiating tactic" and it's a "tax" on farmers livelihoods. It's "downright scary". And the group criticized that the tariffs is a "win for our competitors", including South Maerica and Australia. The group called for elected officials to stop this trade war.
The group will also launch a TV ads on Tuesday in Pennsylvania and Michigan urging Trump to stop trade war.
https://www.youtube.com/watch?v=qTLHdwyMn8A
Fed Bostic: Business optimism replaced trade policy and tariffs concerns
Atlanta Fed President Raphael Bostic delivered a speech titled "The Path to Economic Resilience" to the Rotary Club os Savannah yesterday. There he expressed his support further further rate hike as the economy "appears to be in a pretty good place". His growth outlook "hasn't changed materially" since the start of the year and output is expected to growth at a "moderately above-trend pace this year and next", then slow to slightly less than 2%. Regarding inflation, Bostic said he hasn't seen a "dramatic shift" in inflation expectation or measured retail price inflation yet. And aggregate wage growth "appears to have flattened out" over the past year to a level that's inline with fundamentals.
Bostic is comfortable to "move policy toward a more neutral stance", where it's "neither accommodative nor restrictive". While neutral rate is "something we know with precision", he believed Fed is getting close to the "lower part of most plausible estimates of the neutral rate". And he noted the key question is the number of hikes are required to reach neutral.
He also warned of trade policy of the US. Bostic said "I began the year with a decided upside tilt to my risk profile for growth, reflecting business optimism following the passage of tax reform. However, that optimism has almost completely faded among my contacts, replaced by concerns about trade policy and tariffs. Perceived uncertainty has risen markedly. Projects already under way are continuing, but I get the sense that the bar for new investment is currently quite high. 'Risk off' behavior appears to be the dominant sentiment among my contacts. In response, I've shifted the risks to my growth outlook to balanced."
US halts wargames with South Korea, continues with Japan
The joint military exercises of the US and South Korea are formally halted. The South Korean defense ministry said in a statement that "South Korea and the United States have agreed to suspend all planning activities regarding the Freedom Guardian military drill scheduled for August." Pentagon spokeswoman Dana White said separately that "we are still coordinating additional actions. No decisions on subsequent wargames have been made."
On the other hand, the join military exercises of US and Japan will continue as usual. Japan's Chief Cabinet Secretary Yoshihide Suga said there is no change to the planned drills. And, Suga added "the United States is in a position to keep its commitment to its allied nations' defense and our understanding is there is no change to the U.S. commitment to the Japan-U.S. alliance and the structure of American troops stationed in Japan."
At the same time, North Korean leader Kim Jong-un arrives in Beijing today for a two-day visit. It's believed that Kim will brief Chinese President Xi Jinping on last week's summit with Trump in Singapore.
RBA unsure next move is a hike?
A major surprise from the RBA minutes released today is that it no longer predicts the next rate move as a increase. Back in the April and May meeting minutes, the central bank noted that "in the current circumstances, members agreed that it was more likely that the next move in the cash rate would be up, rather than down." But such reference is taken out from the June minutes.
While that's a notable change, it shouldn't be taken too seriously for the time being. The minutes were on the meeting held on June 5. On June 13, last Wednesday, RBA Governor Philip Lowe reiterated in a speech that "the national accounts provided confirmation that the Australian economy is moving in the right direction ... If this continues to be the case, it is likely that the next move in interest rates will be up, not down."
Otherwise, the minutes revealed nothing special. The main factor behind RBA's neutral stance is sluggish wage growth. It reiterated that the unemployment rate steadied at 5.5%. Ratio of job vacancies to the number of unemployed workers had remained well below levels seen a decade earlier. Both suggested that "spare capacity remained in the labour market." And, "wages had continued to grow at a low and stable rate".
Also from Australia, House Price index dropped -0.7% in Q1 versus expectation of -0.9%.
Looking ahead
The calendar remains light today. Swiss will release SECO economic forecasts. Eurozone will release current account. US will release housing starts and build permits.
USD/JPY Daily Outlook
Daily Pivots: (S1) 110.32; (P) 110.53; (R1) 110.77; More...
USD/JPY's break of 109.91 minor support suggests that corrective rebound from 108.10 has completed at 110.89 already. Intraday bias is turned back to the downside for 108.10 support and possibly below. Fall from 110.89 is seen as the third leg of consolidation pattern from 111.39. Hence, we'd expect strong support from 61.8% retracement of 104.62 to 111.39 at 107.20 to contain downside and bring rebound. On the upside, above 110.89 will bring retest of 111.39 instead.
In the bigger picture, at this point, we're slightly favoring the case that corrective decline from 118.65 (2016 high) has completed with three waves down to 104.62. Above 111.39 will affirm this view and target 114.73 for confirmation. However, it should be noted that USD/JPY is bounded in medium term falling channel from 118.65 (2016 high). Sustained break of 61.8% retracement of 104.62 to 111.39 at 107.20 will likely resume the fall from 118.65 through 104.62 low.
Economic Indicators Update
| GMT | Ccy | Events | Actual | Forecast | Previous | Revised |
|---|---|---|---|---|---|---|
| 1:30 | AUD | House Price Index Q/Q Q1 | -0.70% | -0.90% | 1.00% | |
| 1:30 | AUD | RBA Minutes June | ||||
| 5:45 | CHF | SECO Economic Forecasts | ||||
| 8:00 | EUR | Eurozone Current Account (EUR) Apr | 30.3B | 32.0B | ||
| 12:30 | USD | Housing Starts May | 1.31M | 1.29M | ||
| 12:30 | USD | Building Permits May | 1.35M | 1.36M |
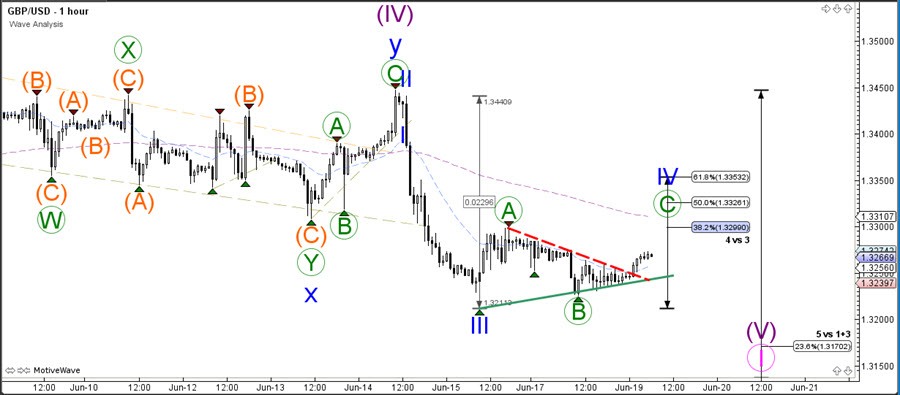
GBP/USD Testing Fibs After Failure To Break Support
The GBP/USD downtrend is taking a pause at the previous bottom and support around 1.32, which is a key bounce or break zone.
The GBP/USD needs to break below the support at 1.32 to restart the downtrend. In that case a wave 5 (purple) continuation for a lower low is probable and price could move down to the Fibonacci targets. The alternative scenario is that price is building an expanded wave 4 (purple).
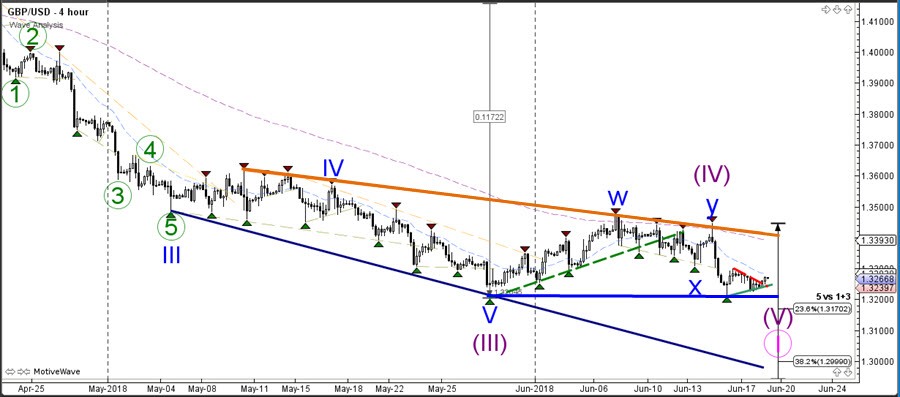
The GBP/USD seems to be building an ABC (green) correction back towards the Fibonacci levels of the wave 4 retracement (blue). A bullish break above the 38.2-50% Fibonacci levels could make the alternative scenario more likely than the current wave 5.