Sample Category Title
Commodities Lift AUD and CAD as Tariff Speculation Builds
Commodity currencies are finding a bid in Asian session today, though still largely range-bound against Dollar. A sharp rally in Copper prices, driven by US tariff fears, is likely giving Aussie a tailwind, countering lingering drag from today’s slightly weaker-than-expected inflation data. Meanwhile, Loonie is benefitting from speculation that Canada may be assigned lower tariffs under US President Donald Trump’s upcoming global trade measures.
According to a Toronto Star report, the Trump administration is preparing a tiered structure for its reciprocal tariffs, grouping trading partners into low, medium, and high tariff categories. Though details remain vague, sources suggest that Canada could be in the "low" tier—but with a twist: tariffs may be cumulative across sectors. The lack of clarity on what qualifies as “high” is keeping markets on edge too, with figures ranging from 25% to triple digits being floated.
Despite the moves in FX, the broader market isn’t displaying strong risk-on conviction. Yen and Swiss Franc are both under pressure—typically a signal of risk appetite—but equities have yet to respond in kind. Yen, in particular, is back as the day’s worst performer, following a recovery yesterday. The lack of follow-through in stocks suggests traders remain hesitant ahead of next week’s highly anticipated “Liberation Day” tariffs announcement on April 2.
In Europe, UK CPI data will be the key focus today. Barring any dramatic surprises, the figures should support BoE’s current stance of slow, measured easing, with rate cuts expected once per quarter. That likely caps any Sterling upside for now, even as traders shift focus toward Euro and GBP cross flows for near-term positioning.
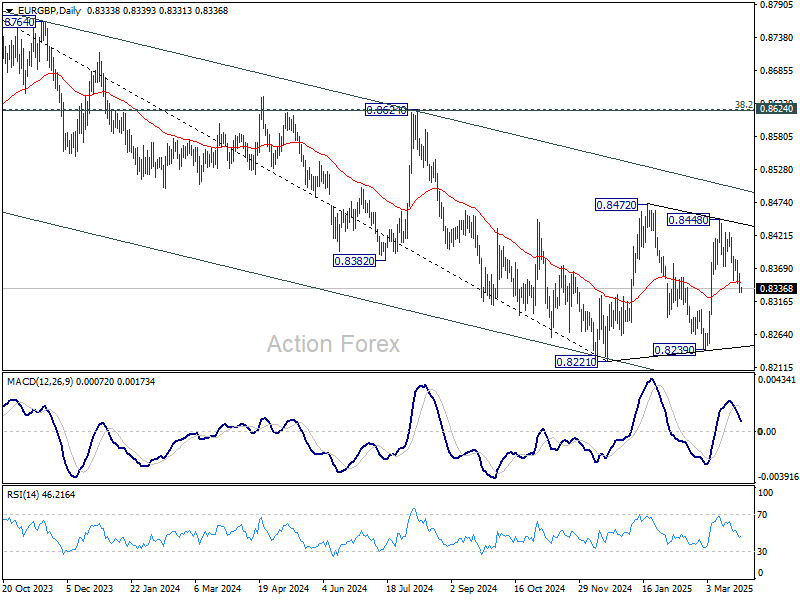
Technically, EUR/GBP's break of 55 D EMA now argues that rebound from 0.8239 has completed at 0.8448 already, as a leg inside the sideway pattern from 0.8221. Deeper fall would be mildly in favor back to 0.8239 support next.
In Asia, at the time of writing, Nikkei is up 1.02%. Hong Kong HSI is up 0.25%. China Shanghai SSE is up 0.02%. Singapore Strait Times is up 0.36%. Japan 10-year JGB yield is up 0.014 at 1.587. Overnight, DOW rose 0.01%. S&P 500 rose 0.16%. NASDAQ rose 0.46%. 10-year yield fell -0.024 to 4.307.
Fed's Goolsbee sees surging inflation expectations as a red flag
Chicago Fed President Austan Goolsbee warned that a shift in market-based long-run inflation expectations toward the elevated levels seen in consumer surveys, such as the University of Michigan’s, would be a "major red flag" demanding immediate Fed attention.
He emphasized that if investor sentiment converges with households' expectations, now at the highest since 1993, Fed would have little choice but to respond.
Goolsbee noted that Fed has moved into “a different chapter” marked by heightened uncertainty, contrasting with the “golden path” of 2023 and 2024, when inflation eased without damaging growth or jobs.
While he still sees interest rates being “a fair bit lower” in the next 12–18 months, he acknowledged that economic unpredictability, particularly surrounding trade policy, may delay Fed’s next move. His stance: “wait and see is the correct approach,” though not without costs.
In conversations with business leaders, Goolsbee said April 2—the date of expected US tariff announcements—has become a key flashpoint of anxiety. This uncertainty, he said, is fueling a broad hesitancy in investment and hiring decisions across the Fed district.
BoJ’s Ueda: Vigilant on upside inflation risks, signals readiness for stronger action
BoJ Governor Kazuo Ueda emphasized today that the central bank remains "vigilant" to upside surprises in "underlying inflation.
While recent "very high" inflation has been driven largely by temporary factors like import costs and food prices, there’s still a possibility that underlying inflation could accelerate more quickly than expected.
Ueda warned that if such "broad-based inflation" materializes, BoJ would need to respond by raising interest rates and even take “stronger steps”.
However, for now, he reaffirmed the view that underlying inflation remains “just a bit” short of the 2% target, though it is on track to gradually converge to that level.
Meanwhile, data released today showed Japan’s services producer price index rose 3.0% yoy in February, a deceleration from January’s 3.2% and below expectations of 3.1%.
Australia CPI slows to 2.4% in Feb, trimmed mean ticks down to 2.7%
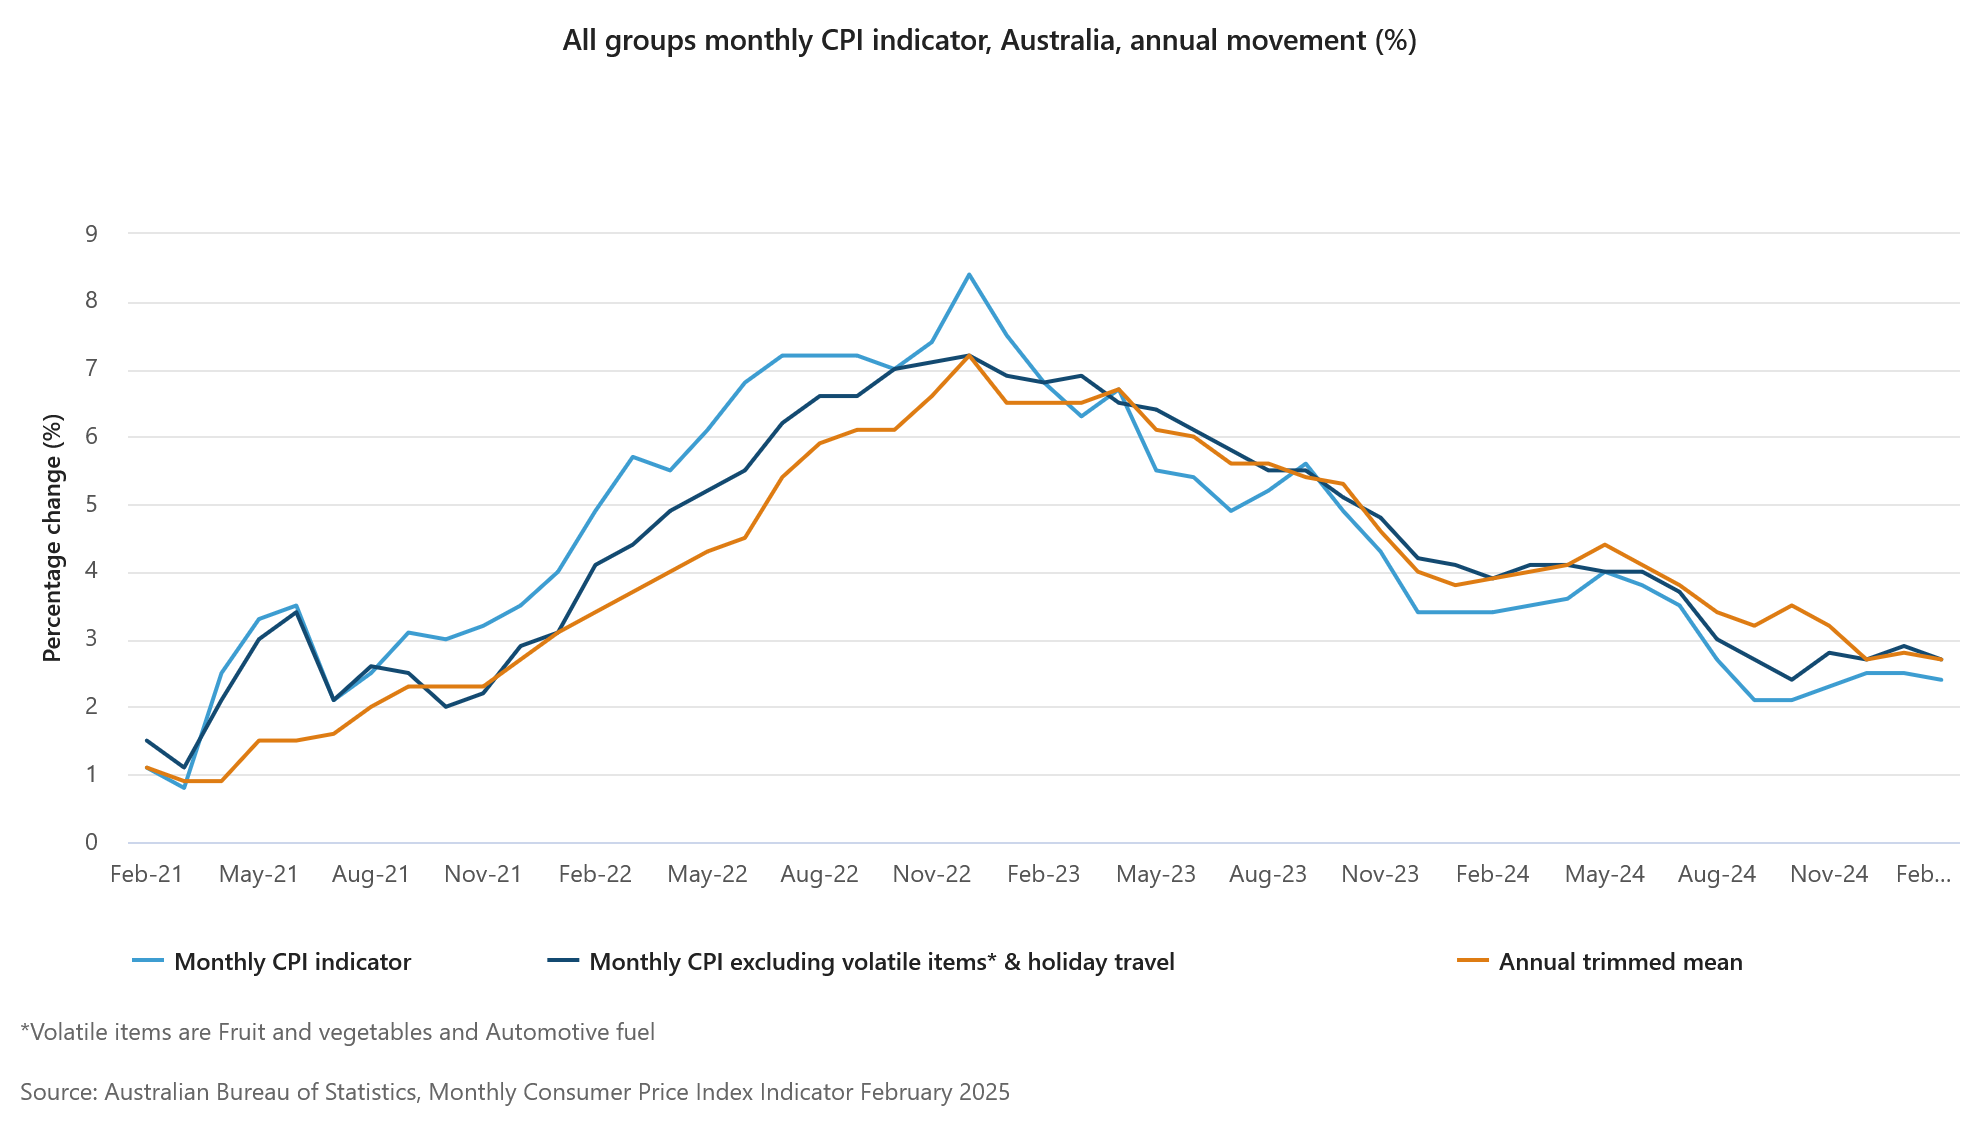
Australia’s monthly CPI eased to 2.4% yoy in February, slightly below expectations of 2.5% yoy and marking a step down from the steady 2.5% yoy pace seen over the past two months.
Core inflation measures also softened, with the trimmed mean slipping from 2.8% yoy to 2.7% yoy. CPI excluding volatile items and holiday travel eased from 2.9% yoy to 2.7% yoy.
The largest contributors to annual inflation were food and non-alcoholic beverages (+3.1%), alcohol and tobacco (+6.7%), and housing (+1.8%).
Still, the overall slowdown adds to the case for RBA to remain on hold at its upcoming meeting. The central bank has made it clear that February’s rate cut does not set an automatic path for further easing. With the more comprehensive Q1 CPI data still to come, today’s numbers are unlikely to shift policy expectations in a meaningful way.
Tariff fears drive Copper to record in classic commodity fifth-wave extension
US Copper prices surged to fresh record highs, driven by rising expectations that President Donald Trump may soon impose tariffs on copper imports.
Traders are responding to signals that the Commerce Department’s review—ordered by Trump in February—is advancing quickly, and that a decision, possibly imposing tariffs of up to 25%, could be announced within weeks.
The surge reflects not only speculative buying but also a defensive scramble as traders and manufacturers brace for supply disruptions. A key driver of the move is fear, with the current rally taking the form of a classic fifth-wave extension seen in commodity markets—when panic buying exacerbates already tight conditions.
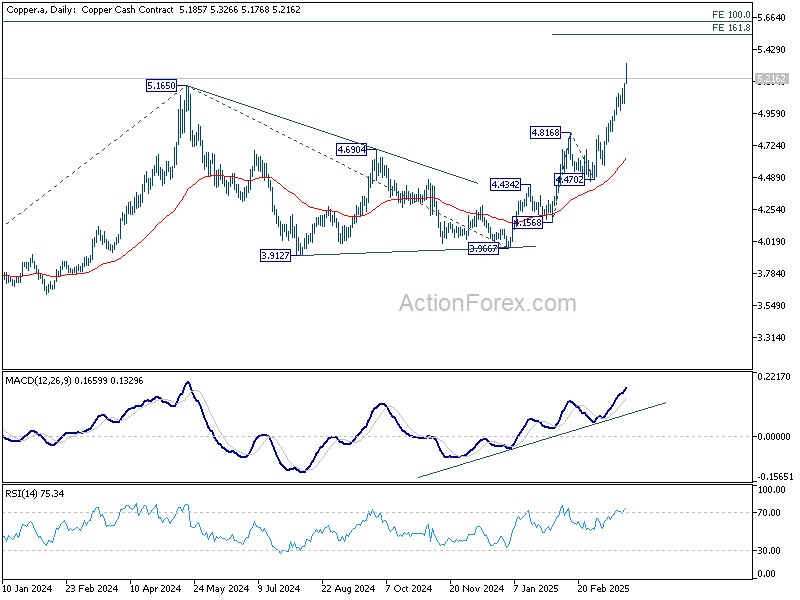
Technically, the uptrend from January low at 3.9667 is now in its final leg of a five-wave sequence. While there may still be some upside left, strong resistance lies ahead.
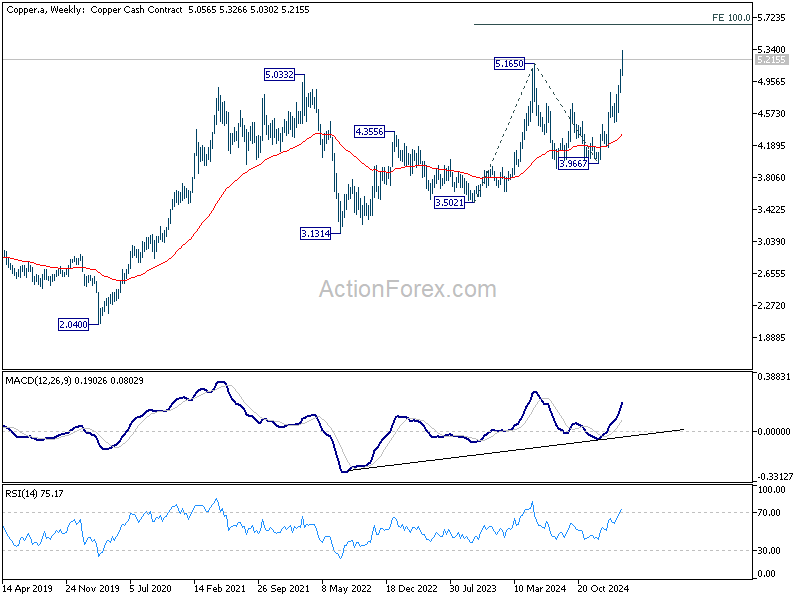
Despite the bullish momentum, Copper should soon face strong resistance soon. Two key projection levels—5.538 (161.8% of the 4.1568 to 4.8168 move from 4.4702) and 5.6298 (100% projection of 3.5021 to 5.1650 from 3.9667)—form a crucial zone that should cap the rally.
Looking ahead
UK CPI is the main focus in European session while Swiss will release UBS economic expectations. Later in the day, US durable goods orders will be published. BoC will release summary of deliberations.
EUR/AUD Daily Outlook
Daily Pivots: (S1) 1.7092; (P) 1.7143; (R1) 1.7173; More...
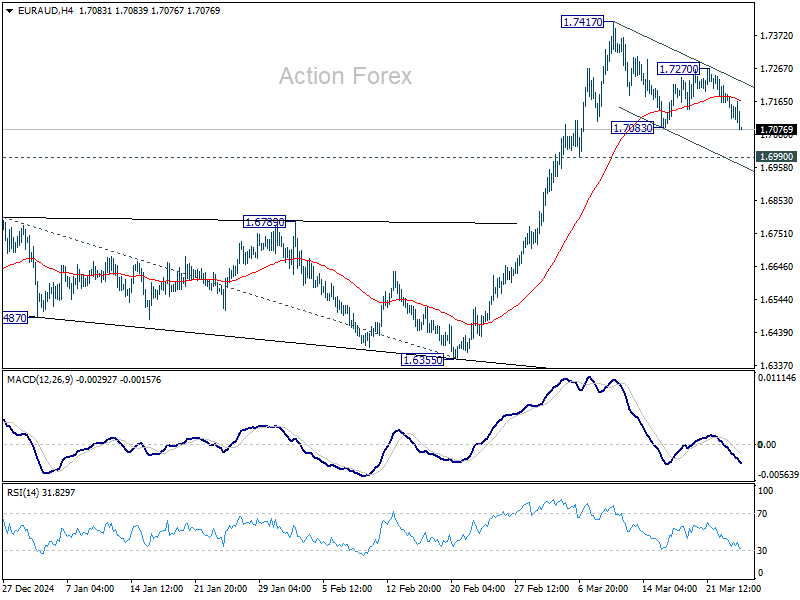
EUR/AUD's corrective fall from 1.7417 short term top is resuming and intraday bias is mildly on the downside. Still, downside of the pullback should be contained by 0.6990 support to bring rebound. On the upside, above 1.7270 will bring retest of 1.7417 first. Break there will resume rise from 1.6335 to 161.8% projection of 1.5963 to 1.6800 from 1.6355 at 1.7709 next.
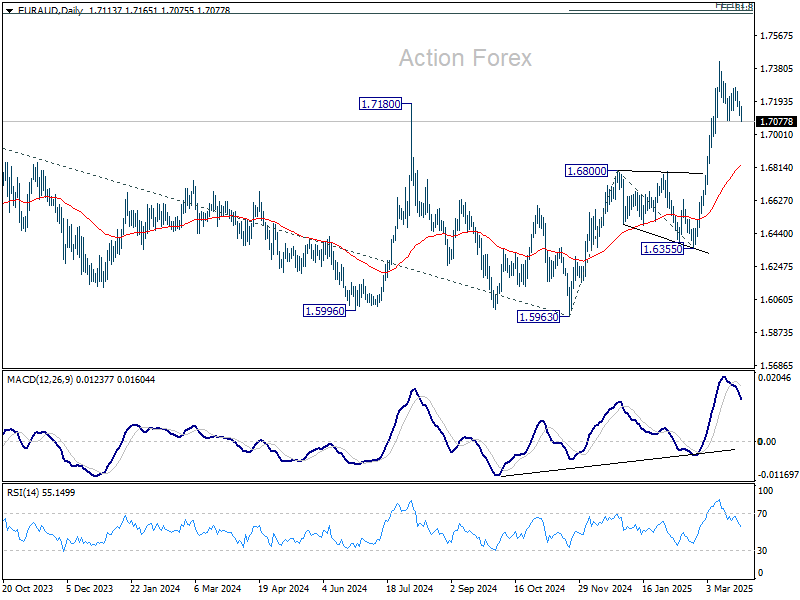
In the bigger picture, the breach of 1.7180 key resistance (2024 high) suggests that up trend from 1.4281 (2022 low) is resuming. Sustained trading above 1.7180 will confirm and target 61.8% projection of 1.4281 to 1.7062 from 1.5963 at 1.7682, which is also close to 61.8% retracement of 1.9799 (2020 high) to 1.4281 at 1.7691. For now, this will remain the favored case as long as 1.6800 resistance turned support holds, even in case of deep pullback.
Fed’s Goolsbee sees surging inflation expectations as a red flag
Chicago Fed President Austan Goolsbee warned that a shift in market-based long-run inflation expectations toward the elevated levels seen in consumer surveys, such as the University of Michigan’s, would be a "major red flag" demanding immediate Fed attention.
He emphasized that if investor sentiment converges with households' expectations, now at the highest since 1993, Fed would have little choice but to respond.
Goolsbee noted that Fed has moved into “a different chapter” marked by heightened uncertainty, contrasting with the “golden path” of 2023 and 2024, when inflation eased without damaging growth or jobs.
While he still sees interest rates being “a fair bit lower” in the next 12–18 months, he acknowledged that economic unpredictability, particularly surrounding trade policy, may delay Fed’s next move. His stance: “wait and see is the correct approach,” though not without costs.
In conversations with business leaders, Goolsbee said April 2—the date of expected US tariff announcements—has become a key flashpoint of anxiety. This uncertainty, he said, is fueling a broad hesitancy in investment and hiring decisions across the Fed district.
Tariff fears drive Copper to record in classic commodity fifth-wave extension
US Copper prices surged to fresh record highs, driven by rising expectations that President Donald Trump may soon impose tariffs on copper imports.
Traders are responding to signals that the Commerce Department’s review—ordered by Trump in February—is advancing quickly, and that a decision, possibly imposing tariffs of up to 25%, could be announced within weeks.
The surge reflects not only speculative buying but also a defensive scramble as traders and manufacturers brace for supply disruptions. A key driver of the move is fear, with the current rally taking the form of a classic fifth-wave extension seen in commodity markets—when panic buying exacerbates already tight conditions.
Technically, the uptrend from January low at 3.9667 is now in its final leg of a five-wave sequence. While there may still be some upside left, strong resistance lies ahead.
Despite the bullish momentum, Copper should soon face strong resistance soon. Two key projection levels—5.538 (161.8% of the 4.1568 to 4.8168 move from 4.4702) and 5.6298 (100% projection of 3.5021 to 5.1650 from 3.9667)—form a crucial zone that should cap the rally.
Bitcoin Eyes $90K Comeback—Can Bulls Regain Control?
Key Highlights
- Bitcoin price started a recovery wave above the $85,000 resistance zone.
- BTC is following a bullish trend line with support at $85,400 on the 4-hour chart.
- Ethereum price also recovered and climbed above the $2,000 level.
- Gold could aim for a fresh increase if it stays above $3,000.
Bitcoin Price Technical Analysis
Bitcoin price remained stable above $82,000 and started a recovery wave against the US Dollar. BTC cleared the $84,500 and $85,000 resistance levels.
Looking at the 4-hour chart, the price settled above the $85,500 level, the 100 simple moving average (red, 4-hour) and the 200 simple moving average (green, 4-hour). There was a move above the 50% Fib retracement level of the downward move from the $92,790 swing high to the $76,539 low.
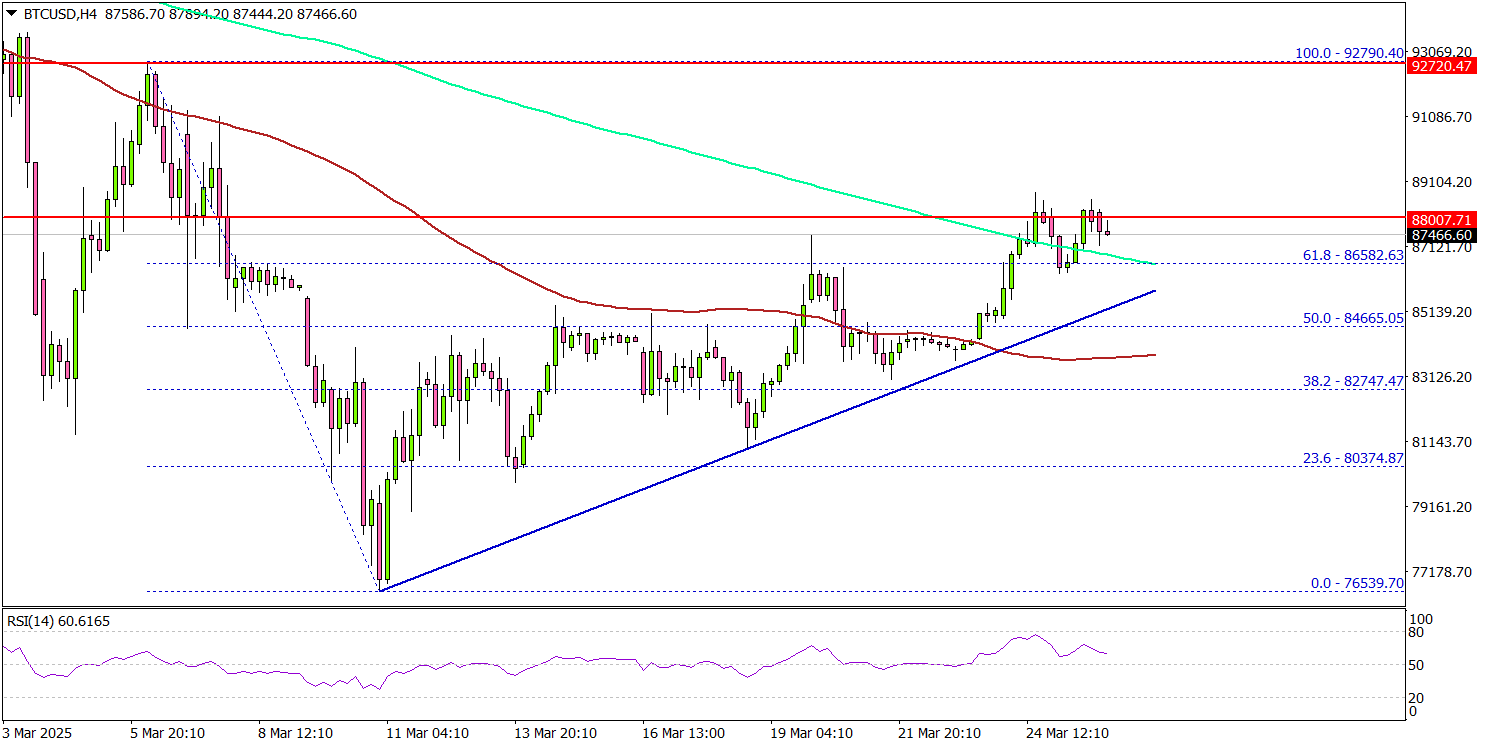
BTC is now following a bullish trend line with support at $85,400 on the same chart. On the upside, the price could face resistance near the $88,800 level.
The next key resistance is $89,500. The main resistance could be $90,000. A successful close above $90,000 might start another steady increase. In the stated case, the price may perhaps rise toward the $92,000 level. Any more gains might call for a test of $92,500.
Immediate support is near the $85,500 level. The next key support sits at $83,800. A downside break below $83,800 might send Bitcoin toward the $82,500 support. Any more losses might send the price toward the $81,200 support zone.
Looking at Ethereum, there was a decent upward move and the bulls were able to clear the $2,000 resistance zone.
Today’s Economic Releases
- US Durable Goods Orders for Feb 2025 – Forecast -1.0% versus +3.2% previous.
Australia CPI slows to 2.4% in Feb, trimmed mean ticks down to 2.7%
Australia’s monthly CPI eased to 2.4% yoy in February, slightly below expectations of 2.5% yoy and marking a step down from the steady 2.5% yoy pace seen over the past two months.
Core inflation measures also softened, with the trimmed mean slipping from 2.8% yoy to 2.7% yoy. CPI excluding volatile items and holiday travel eased from 2.9% yoy to 2.7% yyo.
The largest contributors to annual inflation were food and non-alcoholic beverages (+3.1%), alcohol and tobacco (+6.7%), and housing (+1.8%).
Still, the overall slowdown adds to the case for RBA to remain on hold at its upcoming meeting. The central bank has made it clear that February’s rate cut does not set an automatic path for further easing. With the more comprehensive Q1 CPI data still to come, today’s numbers are unlikely to shift policy expectations in a meaningful way.
BoJ’s Ueda: Vigilant on upside inflation risks, signals readiness for stronger action
BoJ Governor Kazuo Ueda emphasized today that the central bank remains "vigilant" to upside surprises in "underlying inflation.
While recent "very high" inflation has been driven largely by temporary factors like import costs and food prices, there’s still a possibility that underlying inflation could accelerate more quickly than expected.
Ueda warned that if such "broad-based inflation" materializes, BoJ would need to respond by raising interest rates and even take “stronger steps”.
However, for now, he reaffirmed the view that underlying inflation remains “just a bit” short of the 2% target, though it is on track to gradually converge to that level.
Meanwhile, data released today showed Japan’s services producer price index rose 3.0% yoy in February, a deceleration from January’s 3.2% and below expectations of 3.1%.
No April Fooling for RBA – Rates on Hold This Meeting
The RBA was too hawkish in its rhetoric last month to consider a cut at this meeting. The labour market, wages, consumption and trimmed mean inflation are all crucial for the path beyond that.
We are sufficiently confident that the RBA will keep rates on hold on 1 April that I will be writing my post-meeting note from London. We do not expect any surprises from the RBA this meeting that would require spending the early hours of the London morning trying to work out what is going on. While we still expect a rate cut in May, back-to-back cuts in February and April were never on the table. The RBA was too hawkish in its rhetoric last month for that, and the Board made clear that last month’s cut did not foreshadow more. Cutting again at the April meeting would therefore be damaging to its credibility.
Recall that the RBA’s February forecast round implied no further decline in trimmed mean inflation from here – flat at 2.7%, the same annualised rate achieved in the second half of 2024. This was predicated on a market path for the cash rate with roughly 90bps of policy easing over this year. In order to get inflation all the way back to the 2.5% midpoint of the target range, the RBA expects to need to cut by less than this. If things start turning out in line with this narrative, with inflation stuck at current rates and wages growth holding up in the near term, then it would be reasonable to expect the RBA to cut at most once more this year.
Our own view of the outlook is not wildly different, with trimmed mean inflation cycling around the desired level of 2.5%, just 0.2ppts below the RBA’s forecasts. We also expect a small lift in the unemployment rate, to 4.5% compared with the RBA’s 4.2% forecast, which is barely above the current level of 4.1%. (It is worth noting that Treasury’s Budget forecasts also have unemployment staying at 4¼% out to 2026/27.) However, our forecasts diverge enough to have different policy implications. If our forecasts are broadly correct, then the RBA is likely to cut three more times this year, bringing the cash rate to 3.35%.
Since the February meeting, the data flow has been in line with, or a little softer than the RBA’s forecasts. The monthly inflation indicator has been consistent with trimmed mean inflation at or below the RBA’s expectations. The headline CPI indicator outcome for February was essentially as expected, flat in the month and 2.4%yr (versus 2.5%yr expected, with the difference coming from some small revisions to past data and rounding). The monthly trimmed mean ticked down to 2.7%, suggesting we are on track to see the annual pace of the quarterly trimmed mean CPI series hit 2.7% in the March quarter. Pleasingly, inflation in the stickier housing-related and financial services components continues to unwind.
The labour market was a bit mixed in February, with both employment and participation stepping down. And population growth slowed a bit more sharply than we had expected, which points to both demand and labour supply being lower than assumed, and less housing-related inflationary pressure. (The Budget forecasts did not incorporate the latest information on the labour market or population.)
Other developments since the February RBA meeting include the breaking of the ‘US exceptionalism’ narrative, along with the associated market sell-off (now partially reversed) and decline in US consumer confidence. The downside risks to global growth from the US-instigated trade war are also a concern, though Treasury modelling in yesterday’s Budget suggests the implications for the Australian economy are modest.
The federal government’s announcement of a six-month extension to the electricity rebates pushes out the timing of the bounce-back in CPI inflation. The RBA will look through this and continue to focus on trimmed mean inflation. The other tax and spending measures were modest enough that they will not affect the RBA’s view of the outlook materially, even though market pricing did shift a bit on the night.
We therefore think that the April meeting will prove to be something of a ‘dead rubber’. Even so, there are some things to watch for in the post-meeting statement. Along with any update to the outlook for inflation, we look for any commentary on the outlook for wages; as best as we can tell, wages growth would actually have to pick up from here to meet the RBA’s near-term forecasts for Wage Price Index growth. We think this is unlikely and will be watching for how the RBA characterises developments here.
Likewise, we look for more discussion about the consumption outlook. Recent timely data have been a bit mixed, and the RBA’s outlook for consumption growth in calendar 2025 is notably above consensus, even after the slight downward revision in the February SMP. While Assistant Governor Hunter noted in a recent speech that spending has indeed picked up for goods and services less affected by Black Friday and other sales periods, nobody was suggesting otherwise. The real risk around the consumption outlook is that the lift in spending in response to the Stage 3 tax cuts, while positive, is less than historical experience would lead one to expect. That is the message of our own Westpac–DataX Consumer Panel, which points to only about 25 cents in every dollar of extra disposable income being spent, which is on the low side of earlier expectations.
Looking forward to May, the inflation data will once again be crucial. So much is hanging on that difference between 2.7% and 2.5% that even a small downside surprise for the RBA on trimmed mean inflation in the March quarter will cement our current view on the timing and scale of further cuts.
Dow Jones (DJIA) Advances, US Consumer Confidence Slides
- Despite rising recession fears and declining US consumer confidence, the Dow Jones Industrial Average is experiencing gains.
- US consumer confidence has fallen for the fourth consecutive month.
- Key Technical Levels Identified for Dow Jones.
US Equity markets continued their advance today as investors evaluated the impact of upcoming reciprocal tariffs following U.S. President Donald Trump's hint at possibly softening his trade policy.
Dow Jones Heatmap
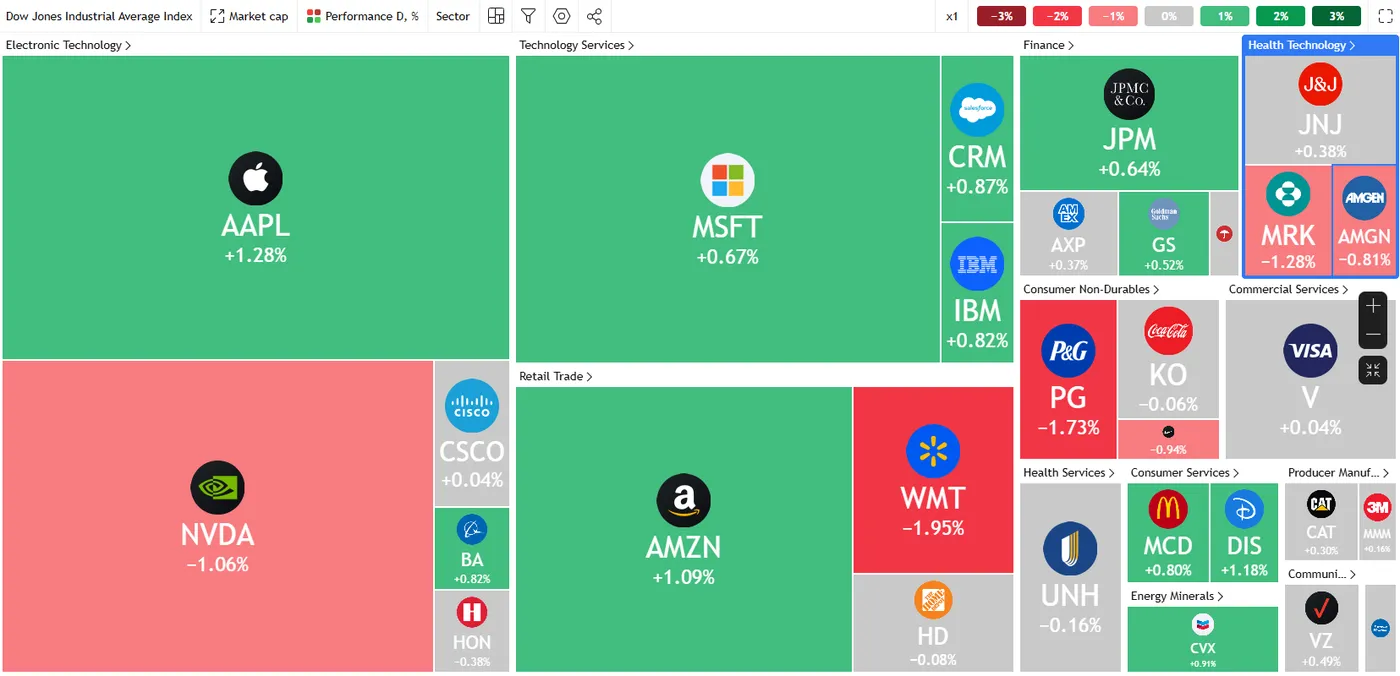
Source: TradingView
President Trump stated that not all planned tariffs would start on April 2nd, with some countries potentially being exempt. However, new tariffs on autos, pharmaceuticals, and a 25% tariff on Venezuelan crude were mentioned.
Meanwhile, Fed Governor Kugler said monetary policy is still tight but noted slower progress toward the 2% inflation goal since last summer, calling the recent rise in goods inflation "unhelpful."
US Data Ramps Up Recession Fears
Lackluster US data failed to dent market optimism proving once more that at present, Tariff chatter is the dominant force driving market moves.
U.S. consumer sentiment continued to drop in March, with the Conference Board’s Consumer Confidence Index falling from 98.3 to 92.9, the lowest level since February 2021.
The print is worse than the July 2022 print which was the nadir of the Biden Presidency when inflation was at 9%. It is the fourth monthly decline in a row.
The consumer expectations index based on consumers’ short-term outlook for income, business, and labor market conditions recorded its lowest reading in 12 years.
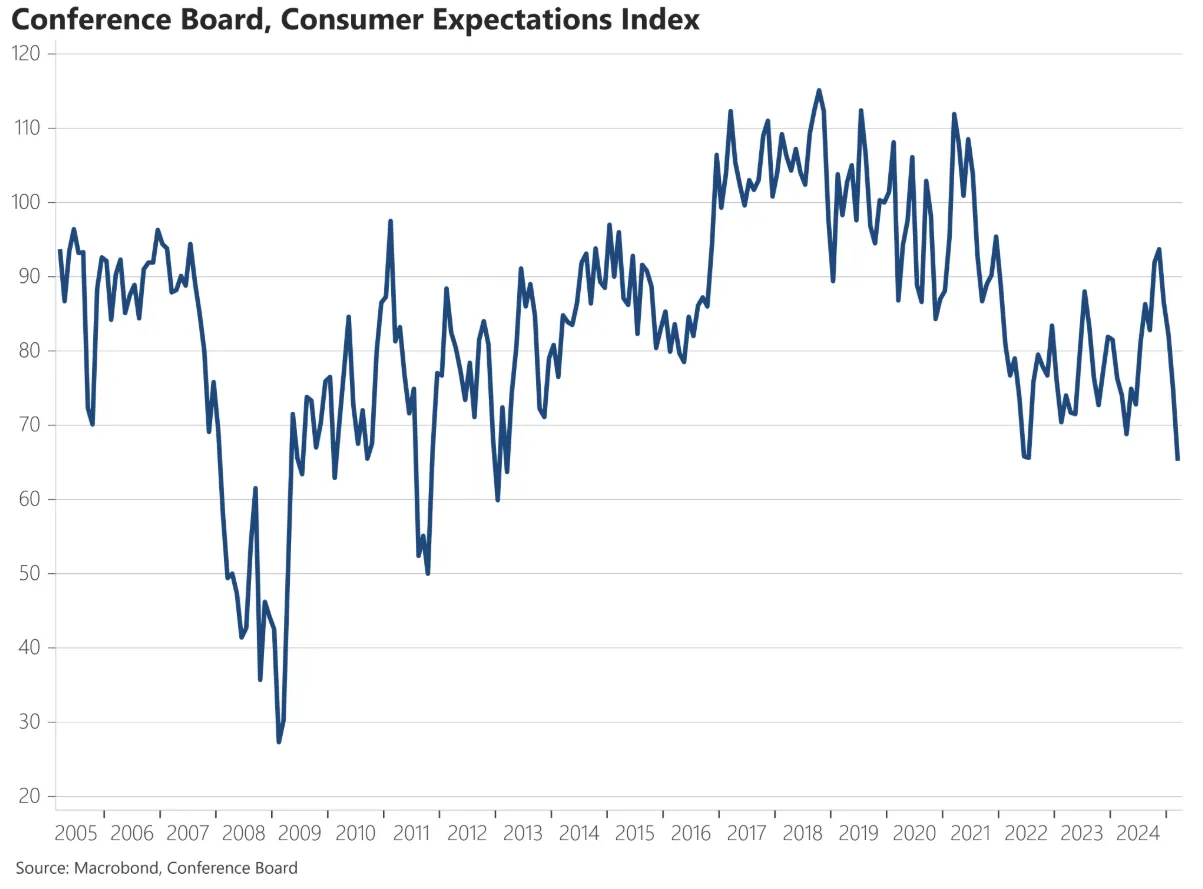
Source: Macrobond, Conference Board
In March, consumers' expectations for inflation over the next year increased, according to the Conference Board survey. These expectations had been falling last year but have gone up for three months in a row now.
As US data continues to underwhelm recession fears are only likely to grow. Today's report showed that opinions on current business conditions are now almost neutral, while consumers have become more negative about the future, with growing pessimism about upcoming business conditions.
Is this the pain President Trump was referring to and will it lead to a recession? For now US Equity markets are on the rise but i expect market concern to grow especially if US data continues to underwhelm moving forward.
Technical Analysis - Dow Jones (DJIA)
Looking at Dow Jones from a technical standpoint, we had a gap higher over the weekend before the index enjoyed a bullish start to the week yesterday with gains of 1.36%.
Price is currently testing a key resistance level at 42764 with a break above opening up a test of resistance at 43402.
A positive for bulls is that the 14-period RSI has crossed above the 50 handle which is a sign that momentum may be shifting.
Also supporting a bullish narrative is that US stocks have historically exhibited positive performance trends during the final two weeks of March since 1950.
If history repeats itself the Dow Jones could be set for further gains or at the least hold onto most of its recent gains since bottoming out on March 13 at 40665.
Dow Jones Daily Chart, March 25, 2025
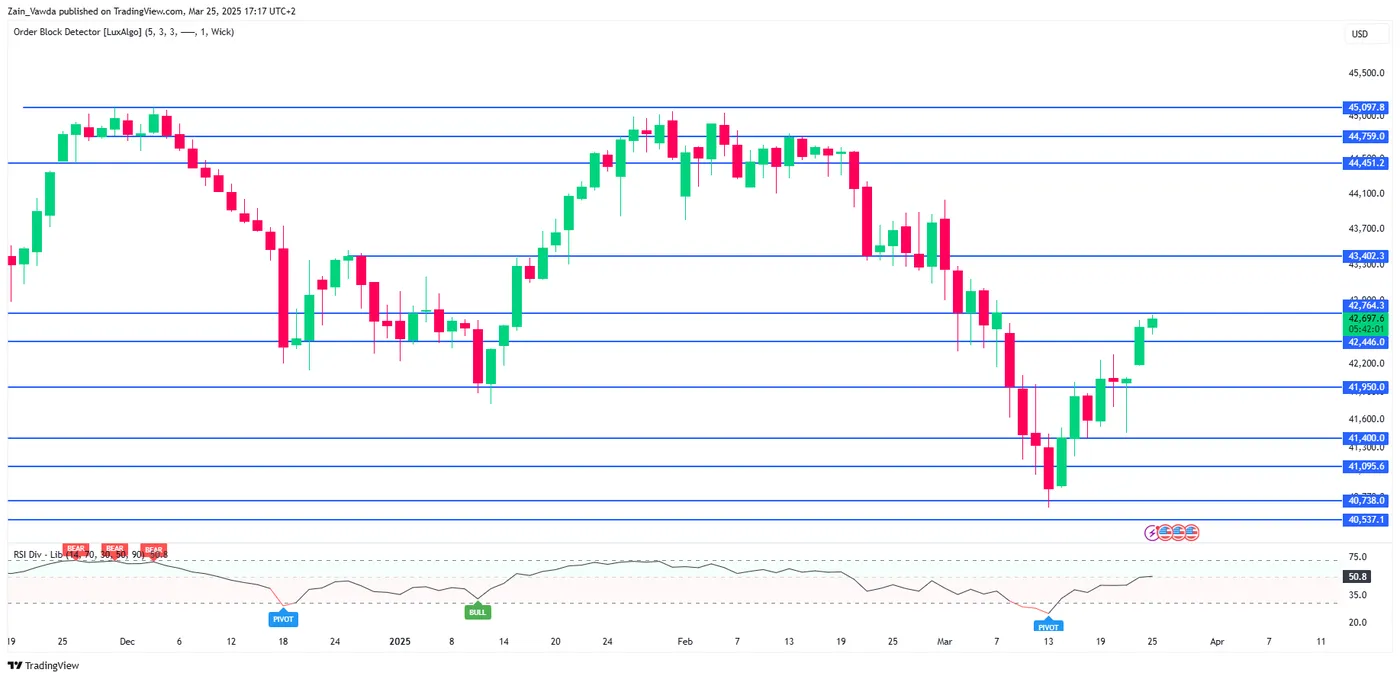
Source: TradingView
Support
- 42446
- 41950
- 41400
Resistance
- 42764
- 43402
- 44451
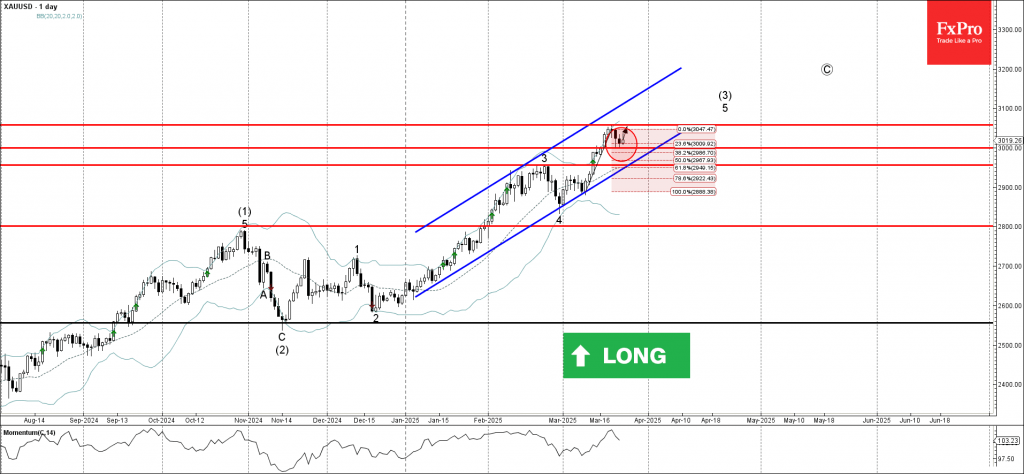
Gold Wave Analysis
Gold: ⬆️ Buy
- Gold reversed from support zone
- Likely to rise to the resistance level 3060.00
Gold recently reversed up from the support zone between the round support level 3000.00 and the 38.2% Fibonacci correction of the upward impulse from the start of March.
The upward reversal from this support zone stopped continues the active minor impulse wave 5 of the intermediate impulse wave (3) from November.
Given the clear daily uptrend, Gold can be expected to rise to the next resistance level 3060.00 (which reversed the price earlier this month).
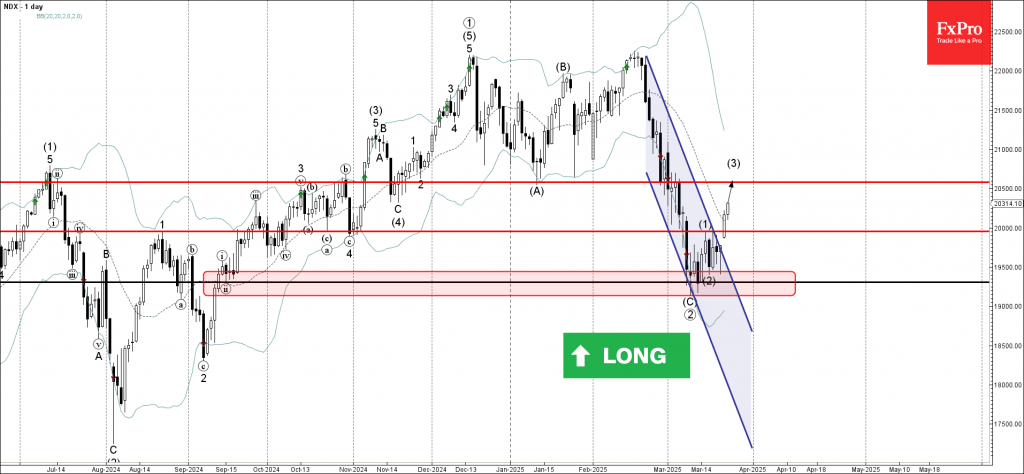
Nasdaq-100 Wave Analysis
Nasdaq-100: ⬆️ Buy
- Nasdaq-100 broke resistance zone
- Likely to rise to resistance level 20500.00
Nasdaq-100 index recently broke the resistance zone between the round resistance level 20000.00 and the resistance trendline of the daily down channel from February.
The breakout of this resistance zone accelerated the active intermediate impulse wave (3) from the start of March.
Nasdaq-100 index can be expected to rise to the next resistance level 20500.00 (former strong support from January and the target price for the completion of the active impulse wave (3)).