
Sample Category Title
EUR/USD Mid-Day Outlook
Daily Pivots: (S1) 1.0769; (P) 1.0800; (R1) 1.0822; More...
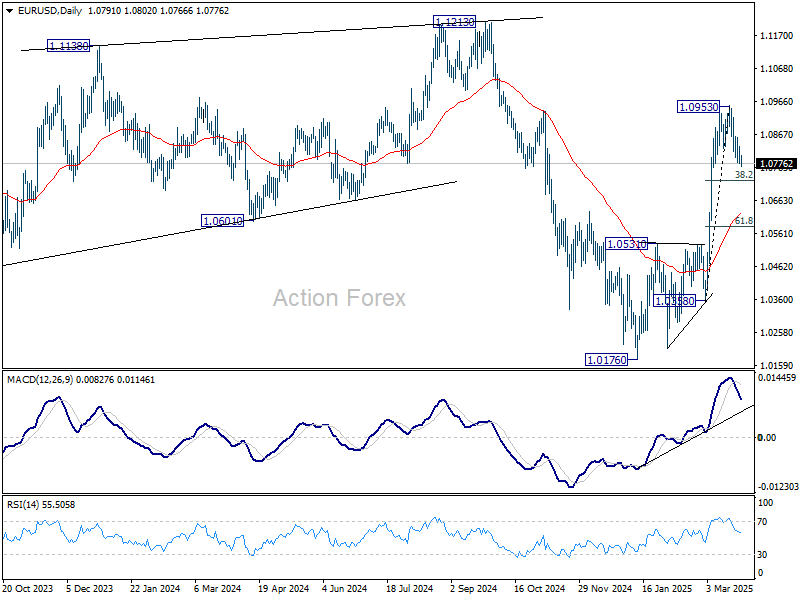
Intraday bias in EUR/USD Is back on the downside, with breach of 1.0775 temporary low. Corrective fall from 1.0953 is extending lower, but downside should be contained by 38.2% retracement of 1.0358 to 1.0953 at 1.0726 to bring rebound. On the upside, break of 1.0953 will resume the rally from 1.0176 towards 1.1274 key resistance.
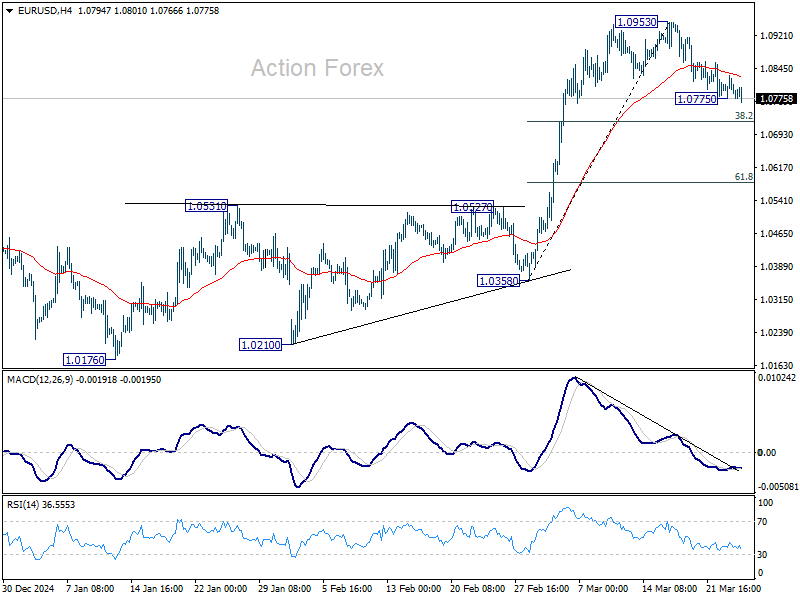
In the bigger picture, prior strong break of 55 W EMA (now at 1.0675) suggests that fall from 1.1274 (2024 high) has completed as a three wave correction to 1.0176. Rise from 0.9534 is still intact, and might be ready to resume. Decisive break of 1.1274 will target 100% projection of 0.9534 to 1.1274 from 1.0176 at 1.1916. Also, that will send EUR/USD through a multi-decade channel resistance will carries larger bullish implication. This will now be the favored case as long as 1.0531 resistance turned support holds.
USD/CHF Mid-Day Outlook
Daily Pivots: (S1) 0.8801; (P) 0.8825; (R1) 0.8850; More…
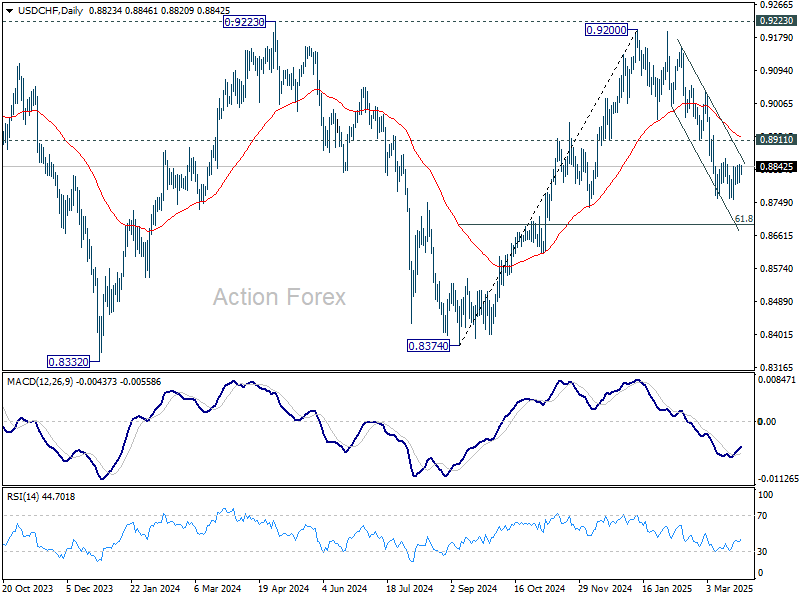
USD/CHF is staying in consolidation from 0.8757 and intraday bias stays neutral. In case of stronger recovery, upside should be limited by 0.8911 support turned resistance. On the downside, break of 0.8757 will resume the fall from 0.9200 to 61.8% retracement of 0.8374 to 0.9200 at 0.8690. Sustained break there will pave the way back to 0.8374 support.
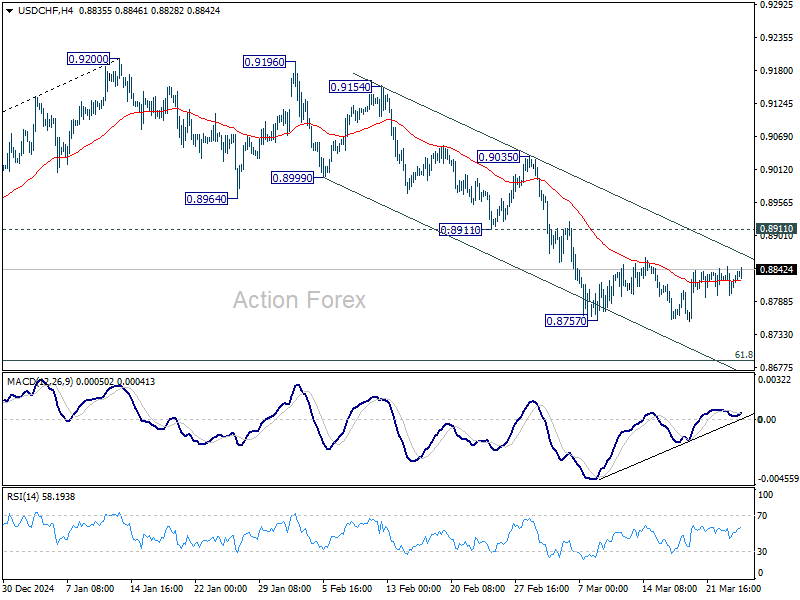
In the bigger picture, rejection by 0.9223 key resistance keep medium term outlook bearish. That is, larger fall from 1.0342 (2017 high) is not completed yet. Firm break of 0.8332 (2023 low) will confirm down trend resumption.
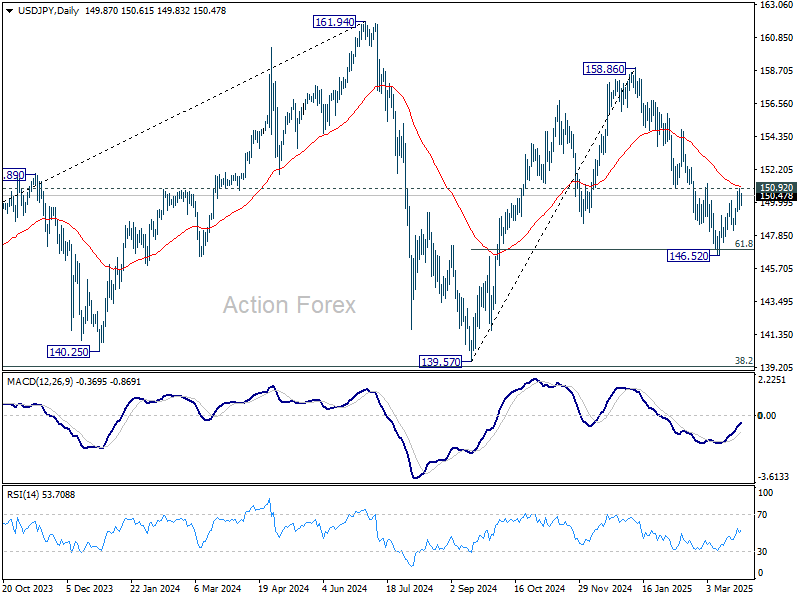
USD/JPY Mid-Day Outlook
Daily Pivots: (S1) 149.33; (P) 150.14; (R1) 150.72; More...
No change in USD/JPY's outlook and intraday bias stays neutral. Strong resistance is still expected from 150.92 to complete the corrective recovery from 146.52. On the downside break of 148.17 support will bring retest of 146.52 first. Sustained trading below 61.8% retracement of 139.57 to 158.86 at 146.32 will resume the fall from 158.86 to 139.57 support. However, firm break of 150.92 will argue that fall from 158.86 has completed and turn bias back to the upside for 154.79 resistance next.
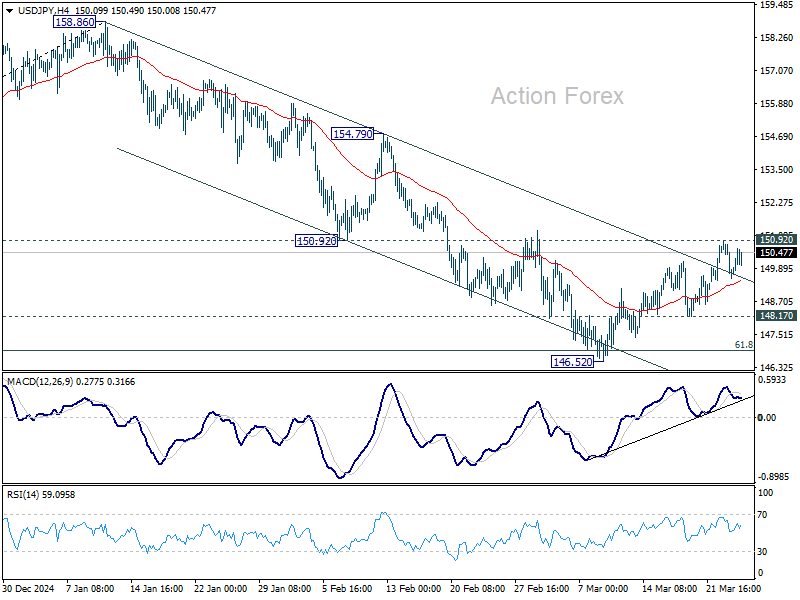
In the bigger picture, price actions from 161.94 are seen as a corrective pattern to rise from 102.58 (2021 low), with fall from 158.86 as the third leg. Strong support should be seen from 38.2% retracement of 102.58 to 161.94 at 139.26 to bring rebound. However, sustained break of 139.26 would open up deeper medium term decline to 61.8% retracement at 125.25.
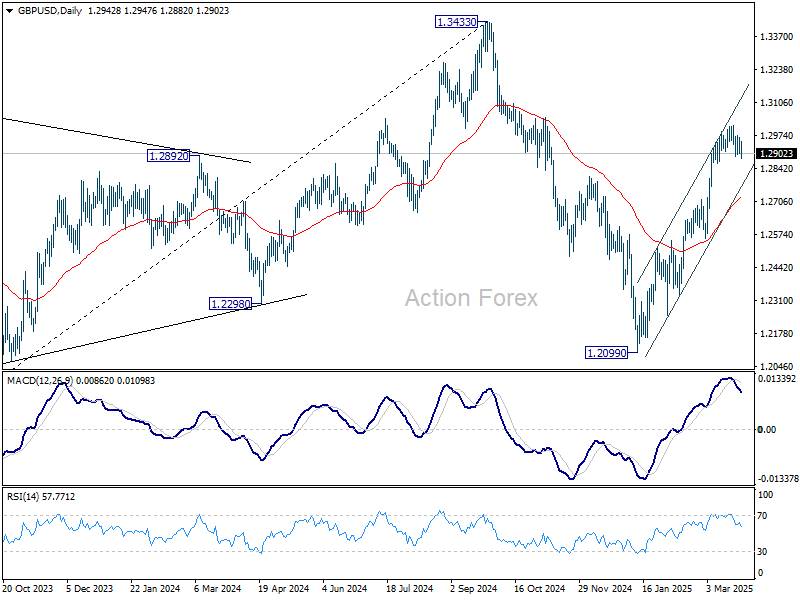
GBP/USD Mid-Day Outlook
Daily Pivots: (S1) 1.2909; (P) 1.2938; (R1) 1.2974; More...
Intraday bias in GBP/USD remains neutral for the moment. Corrective fall from 1.3013 short term top could still continues. Below 1.2886 will target near term channel support (now at 1.2782) and possibly below. But downside should be contained by 38.2% retracement of 1.2248 to 1.3013 at 1.2721 to bring rebound. On the upside, break of 1.3013 will resume the rally from 1.2099.
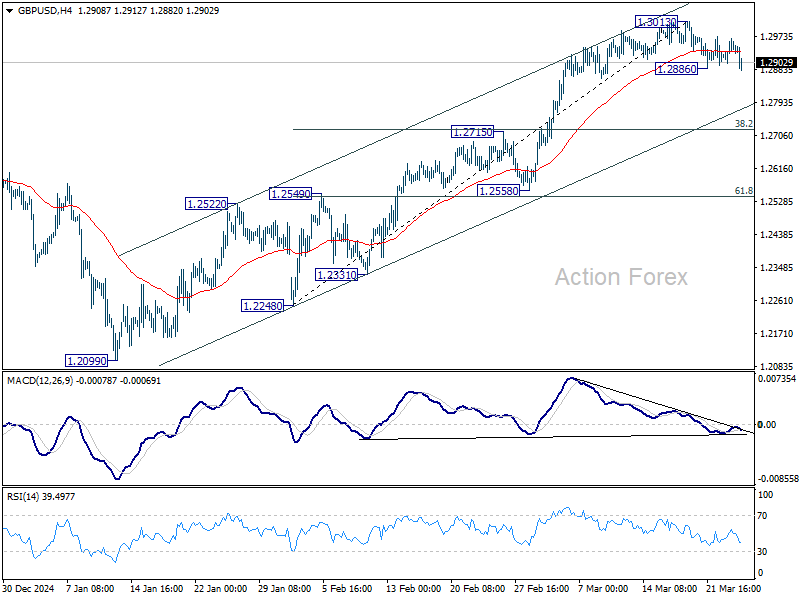
In the bigger picture, up trend from 1.3051 (2022 low) is not completed. Resumption is expected after corrective pattern from 1.3433 completes. Next target will be 1.4248 key resistance. This will now remain the favored case as long as 1.2099 support holds.
Sterling Lags After CPI Miss, But BoE Rate Cut to Stay Gradual
Sterling fell broadly today after UK’s February CPI came in slightly below expectations. However, the selloff has been contained, with markets still expecting the BoE to proceed cautiously with policy easing. In particular, services inflation remained sticky at 5%, signaling that underlying price pressures are not abating as quickly as hoped.
Some economists argue that February’s inflation dip may prove to be a false dawn. The scheduled rise in energy bills and national insurance contributions next month could push inflation back towards 4% level again, undermining hopes of sustained disinflation.
Against that backdrop, BoE is unlikely to accelerate the pace of rate cuts. Markets still see a 25bps rate reduction as a realistic outcome for BoE’s next meeting in May. That would align with the central bank's previously communicated strategy of a cautious and gradual easing path, one cut per quarter.
On the day, Sterling is the weakest performer among major currencies, followed by Yen and Swiss Franc. Commodity currencies continue to lead with Kiwi topping the chart. Dollar and Euro are positioning in the middle of the pack.
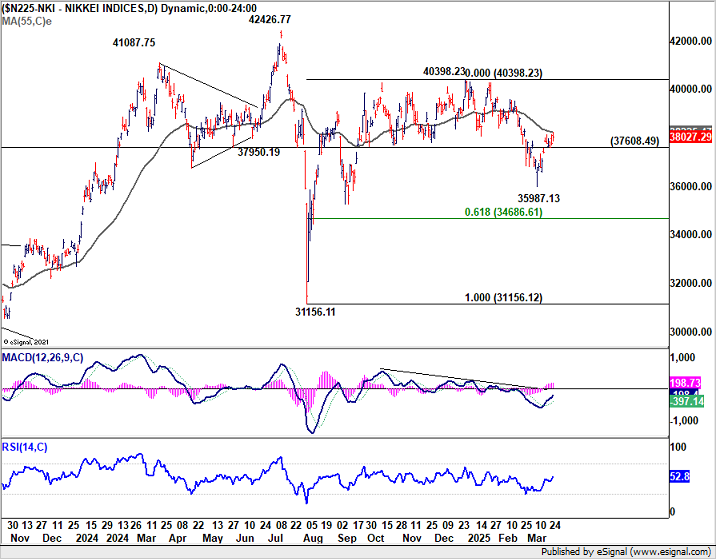
Technically, Nikkei's near term rebound from 35987.13 appears to be losing momentum at it approaches 55 D EMA. Break of 37608.49 support will indicate rejection by the EMA, and should bring deeper fall through 35897.13 to resume the whole decline from 40398.23. If realized, this down move in Nikkei should be accompanied by another selloff in USD/JPY.
In Europe, at the time of writing, FTSE is up 0.31%. DAX is down -0.42%. CAC is down -0.49%. UK 10-year yield is up 0.004 at 4.766. Germany 10-year yield is down -0.006 at 2.795. Earlier in Asia, Nikkei rose 0.65%. Hong Kong HSI rose 0.60%. China Shanghai SSE fell -0.04%. Singapore Strait Times rose 0.23%. Japan 10-year JGB yield rose 0.014 to 1.587.
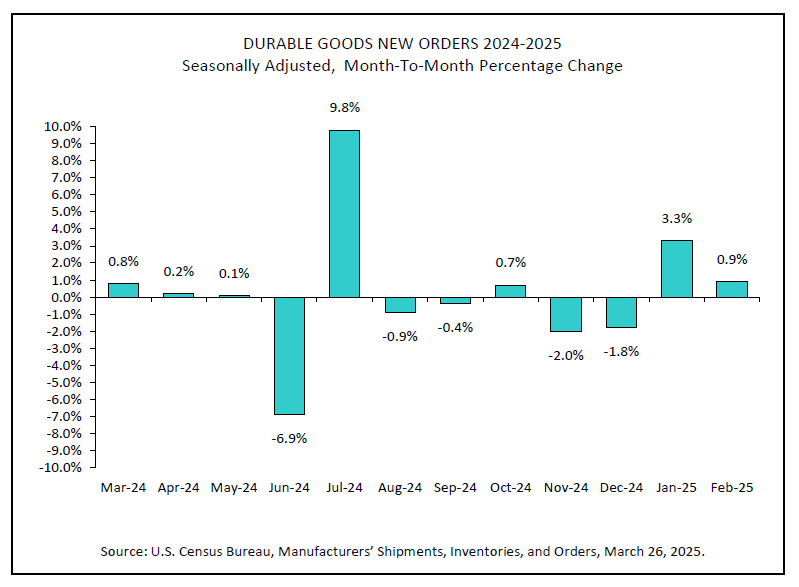
US durable goods orders rises 0.9% mom in Feb, ex-transport orders up 0.7% mom
US durable goods new orders rose 0.9% mom to USD 289.3B in February, much better than expectation of -0.7% mom fall.
Ex-transport orders rose 0.7% mom to USD 190.9B, above expectation of 0.4% mom. Ex-defense orders rose 0.8% mom to USD 271.3B.
Transportation equipment led the increase, up 1.5% mom to USD 98.3B.
Fed's Goolsbee sees surging inflation expectations as a red flag
Chicago Fed President Austan Goolsbee warned that a shift in market-based long-run inflation expectations toward the elevated levels seen in consumer surveys, such as the University of Michigan’s, would be a "major red flag" demanding immediate Fed attention.
He emphasized that if investor sentiment converges with households' expectations, now at the highest since 1993, Fed would have little choice but to respond.
Goolsbee noted that Fed has moved into “a different chapter” marked by heightened uncertainty, contrasting with the “golden path” of 2023 and 2024, when inflation eased without damaging growth or jobs.
While he still sees interest rates being “a fair bit lower” in the next 12–18 months, he acknowledged that economic unpredictability, particularly surrounding trade policy, may delay Fed’s next move. His stance: “wait and see is the correct approach,” though not without costs.
In conversations with business leaders, Goolsbee said April 2—the date of expected US tariff announcements—has become a key flashpoint of anxiety. This uncertainty, he said, is fueling a broad hesitancy in investment and hiring decisions across the Fed district.
ECB’s Panetta: Focus on inflation, not unreliable neutral rate estimates
Italian ECB Governing Council Member Fabio Panetta urged the central bank to steer its attention toward inflation projections rather than attempting to anchor policy decisions on the elusive concept of the “neutral interest rate” or R-star.
In a letter to the Financial Times, Panetta argued that the neutral rate is an invisible target that can only be approximated using models and surveys that are “riddled with uncertainty,” especially in today’s volatile environment.
Panetta warned against ECB becoming “fixated” on labeling its stance as restrictive based on R-star estimates, calling. Instead, he emphasized that the ECB’s efforts should remain firmly grounded in assessing inflation data and determining whether monetary policy is appropriately calibrated to bring inflation sustainably back to the 2% target.
ECB’s Villeroy sees room for rate cuts to 2% by summer
French ECB Governing Council member Francois Villeroy de Galhau signaled there is "still scope for further easing," though he emphasized that the pace and magnitude remain uncertain.
Speaking to Frankfurter Allgemeine Zeitung, Villeroy acknowledged that current market expectations of ECB rates around 2% by summer represent a “possible scenario,” considering Europe’s summer period spans from June through September.
He also addressed recent tightening in financial conditions, noting that the rise in long-term bond yields—triggered by Germany’s massive defense and infrastructure spending plans—must be factored into ECB’s monetary policy assessment.
The spending surge, aimed at countering a perceived US retreat in global leadership, has raised concerns about its inflationary impact. However, Villeroy downplayed those risks, arguing that Europe’s weak domestic demand could offset inflationary pressure from higher public expenditure.
He added that if such fiscal spending is coupled with expanded industrial supply, the inflation impact would likely be limited.
UK CPI slows to 2.8% in Feb, core down to 3.5%
UK CPI slowed from 3.0% yoy to 2.8% yoy in February, below expectation of 2.9% yoy. CPI Core (excluding energy, food, alcohol and tobacco) fell from 3.7% yoy to 3.5% yoy, below expectation of 3.6% yoy.
CPI goods annual rate slowed from 1.0% to 0.8%, while the CPI services annual rate was unchanged at 5.0%.
On a monthly basis, CPI rose by 0.4% mom.
BoJ’s Ueda: Vigilant on upside inflation risks, signals readiness for stronger action
BoJ Governor Kazuo Ueda emphasized today that the central bank remains "vigilant" to upside surprises in "underlying inflation.
While recent "very high" inflation has been driven largely by temporary factors like import costs and food prices, there’s still a possibility that underlying inflation could accelerate more quickly than expected.
Ueda warned that if such "broad-based inflation" materializes, BoJ would need to respond by raising interest rates and even take “stronger steps”.
However, for now, he reaffirmed the view that underlying inflation remains “just a bit” short of the 2% target, though it is on track to gradually converge to that level.
Meanwhile, data released today showed Japan’s services producer price index rose 3.0% yoy in February, a deceleration from January’s 3.2% and below expectations of 3.1%.
Australia CPI slows to 2.4% in Feb, trimmed mean ticks down to 2.7%
Australia’s monthly CPI eased to 2.4% yoy in February, slightly below expectations of 2.5% yoy and marking a step down from the steady 2.5% yoy pace seen over the past two months.
Core inflation measures also softened, with the trimmed mean slipping from 2.8% yoy to 2.7% yoy. CPI excluding volatile items and holiday travel eased from 2.9% yoy to 2.7% yoy.
The largest contributors to annual inflation were food and non-alcoholic beverages (+3.1%), alcohol and tobacco (+6.7%), and housing (+1.8%).
Still, the overall slowdown adds to the case for RBA to remain on hold at its upcoming meeting. The central bank has made it clear that February’s rate cut does not set an automatic path for further easing. With the more comprehensive Q1 CPI data still to come, today’s numbers are unlikely to shift policy expectations in a meaningful way.
GBP/USD Mid-Day Outlook
Daily Pivots: (S1) 1.2909; (P) 1.2938; (R1) 1.2974; More...
Intraday bias in GBP/USD remains neutral for the moment. Corrective fall from 1.3013 short term top could still continues. Below 1.2886 will target near term channel support (now at 1.2782) and possibly below. But downside should be contained by 38.2% retracement of 1.2248 to 1.3013 at 1.2721 to bring rebound. On the upside, break of 1.3013 will resume the rally from 1.2099.
In the bigger picture, up trend from 1.3051 (2022 low) is not completed. Resumption is expected after corrective pattern from 1.3433 completes. Next target will be 1.4248 key resistance. This will now remain the favored case as long as 1.2099 support holds.
US durable goods orders rises 0.9% mom in Feb, ex-transport orders up 0.7% mom
US durable goods new orders rose 0.9% mom to USD 289.3B in February, much better than expectation of -0.7% mom fall.
Ex-transport orders rose 0.7% mom to USD 190.9B, above expectation of 0.4% mom. Ex-defense orders rose 0.8% mom to USD 271.3B.
Transportation equipment led the increase, up 1.5% mom to USD 98.3B.
ECB’s Villeroy sees room for rate cuts to 2% by summer
French ECB Governing Council member Francois Villeroy de Galhau signaled there is "still scope for further easing," though he emphasized that the pace and magnitude remain uncertain.
Speaking to Frankfurter Allgemeine Zeitung, Villeroy acknowledged that current market expectations of ECB rates around 2% by summer represent a “possible scenario,” considering Europe’s summer period spans from June through September.
He also addressed recent tightening in financial conditions, noting that the rise in long-term bond yields—triggered by Germany’s massive defense and infrastructure spending plans—must be factored into ECB’s monetary policy assessment.
The spending surge, aimed at countering a perceived US retreat in global leadership, has raised concerns about its inflationary impact. However, Villeroy downplayed those risks, arguing that Europe’s weak domestic demand could offset inflationary pressure from higher public expenditure.
He added that if such fiscal spending is coupled with expanded industrial supply, the inflation impact would likely be limited.
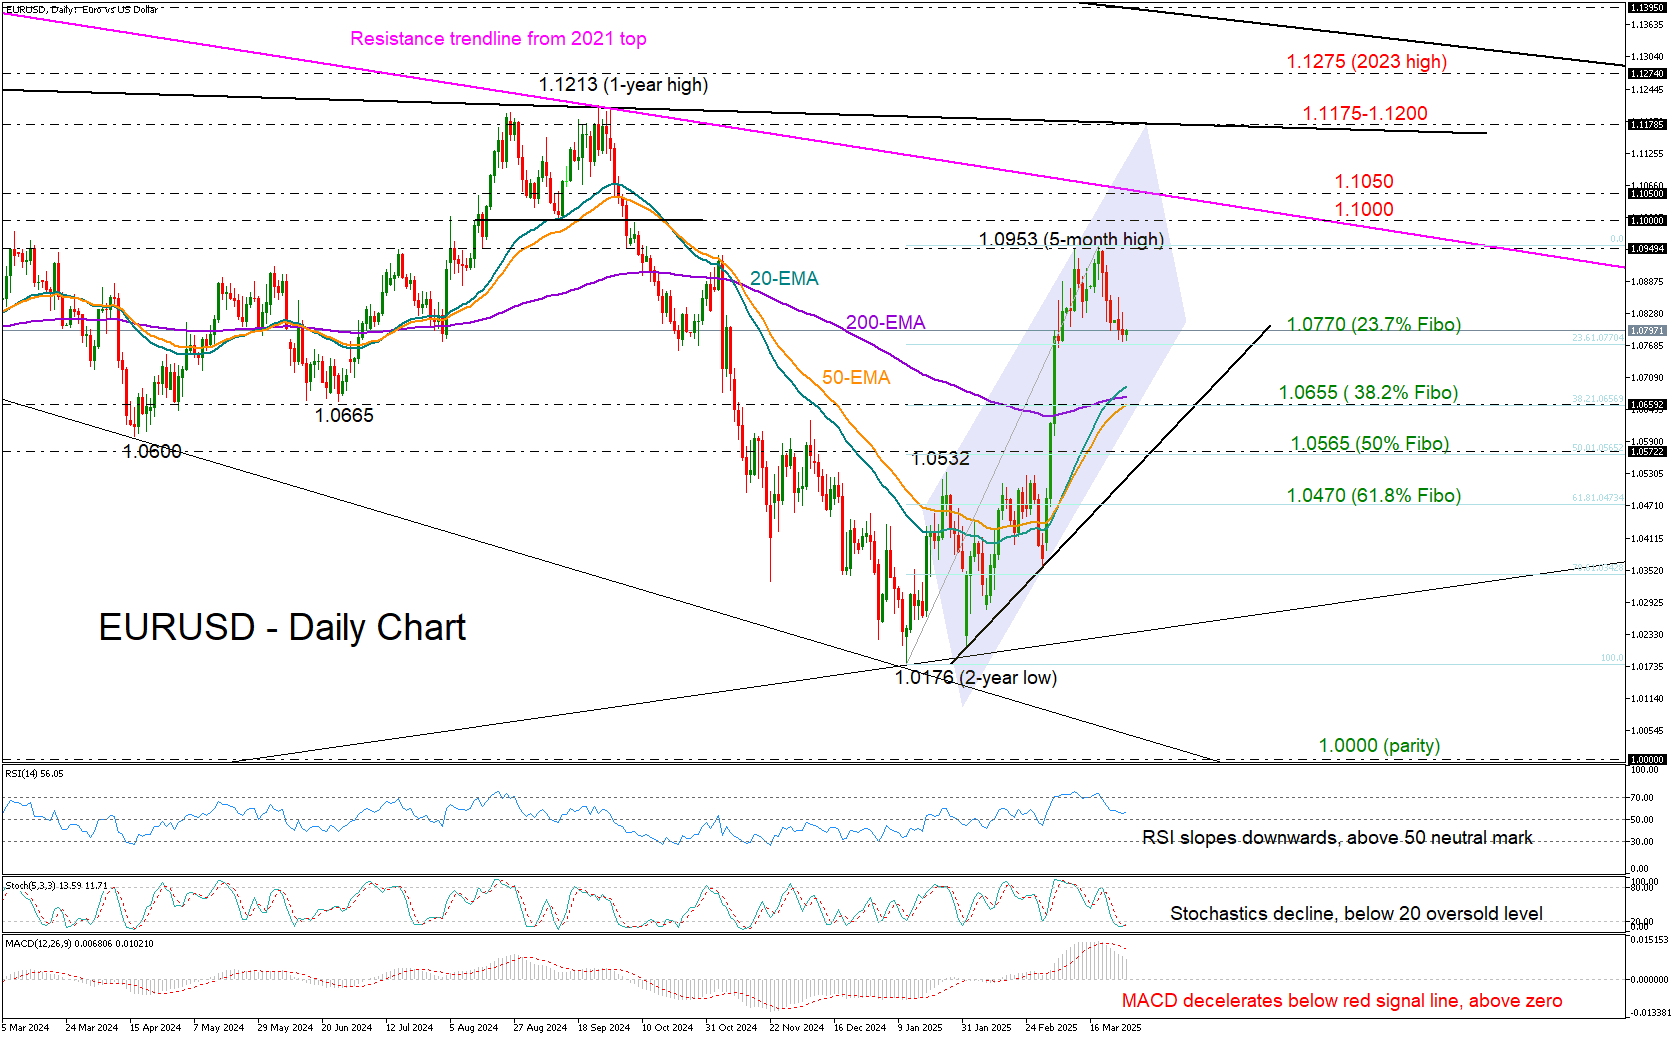
EUR/USD’s Euphoria Wanes
- EUR/USD pulls back ahead of April 2 tariffs.
- Support at 1.0765; mixed technical signals.
- Bearish confirmation below 1.0565.
EURUSD has extended its retreat from the five-month high of 1.0953, trading lower for the second consecutive week, with the bears steering the price toward the key support near 1.0770.
The latest explosive vertical rally stalled below the 1.1000 threshold, and in the weekly chart, the bulls remain capped under the 200-period exponential moving average (EMA), raising concerns about further downside as investors reassess the impact of reciprocal tariffs, Germany’s defense spending and lower interest rates on economic growth.
On the daily chart, a bullish crossover between the 20- and longer-term EMAs offers a glimmer of hope that the upward trajectory could stay intact. However, a drop below these EMAs, near the 38.2% Fibonacci retracement of the recent upleg at 1.0655, could reinforce selling pressure toward the 50% Fibonacci level at 1.0565. A tentative support trendline from February’s lows adds extra significance to this area – failure to hold there could dampen prospects of a bullish reversal.
Despite the negative slope in the technical indicators, the stochastic oscillator is already within the oversold zone and the RSI has yet to cross below its 50 neutral mark, both suggesting that upside movements or some stability is still possible.
A sustained bullish outlook however could be a tough task. Buyers need to reclaim 1.0953 and break through the psychological 1.1000 barrier to test the crucial falling trendline at 1.1050 stemming from the 2021 peak. A breakout there could pave the way toward the next important barrier at 1.1175-1.1200.
Overall, EURUSD could remain under pressure in the coming sessions, with the 1.0770 area likely acting as support. A breakdown could expose the market to the 1.0600 territory.
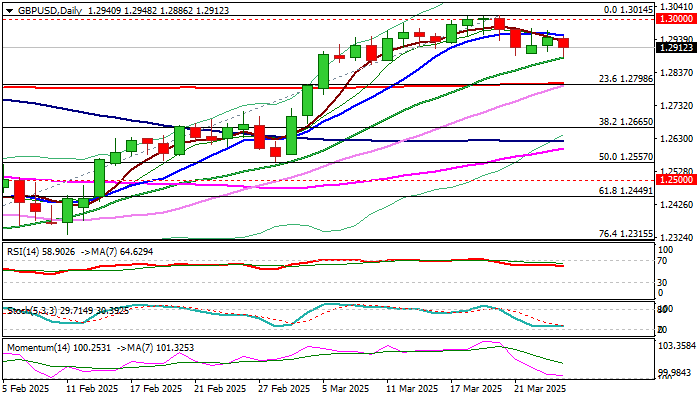
GBP/USD: Cable Eases After Soft CPI Data But Still Lacks Clearer Direction Signals
Cable fell to two-week low on Wednesday on softer than expected UK February inflation data that fuel expectations for BoE rate cut in May.
Fresh weakness pressure support at 1.2883 (20DMA / last Friday’s low) break of which to open way for deeper correction (dips from new multi-month high at 1.3014 were so far shallow) and expose next significant support at 1.2798 (200DMA / Fibo 23.6% of 1.2099/1.3014 rally).
The notion could be supported by negative signals developing on weekly chart (overbought conditions / double weekly Doji with strong upside rejection last week).
Also, the price returned into rising weekly Ichimoku cloud, with close within the cloud to add to negative signals, along with potential monthly bull-trap above 1.2924 Fibo resistance).
On the other hand, economists are not very optimistic and expect inflation to remain sticky, with lower February numbers to be seen as temporary improvement rather than sustained easing in price pressures.
In such scenario, price adjustment is likely to remain limited with shallow dips to signal that larger bulls hold grip and on track for fresh advance after consolidation.
Res: 1.2952; 1.2989; 1.3000; 1.3042.
Sup: 1.2883; 1.2861; 1.2798; 1.2715.
UK Inflation Declines
Today, the latest UK Consumer Price Index (CPI) figures were released. According to ForexFactory:
- The actual annual CPI came in at 2.8%,
- Analysts had expected it to remain at the previous level of 3.0%.
As a result, the British pound weakened, and a slight spike in volatility was observed on the FTSE 100 stock index chart (UK 100 on FXOpen)
Technical Analysis of FTSE 100
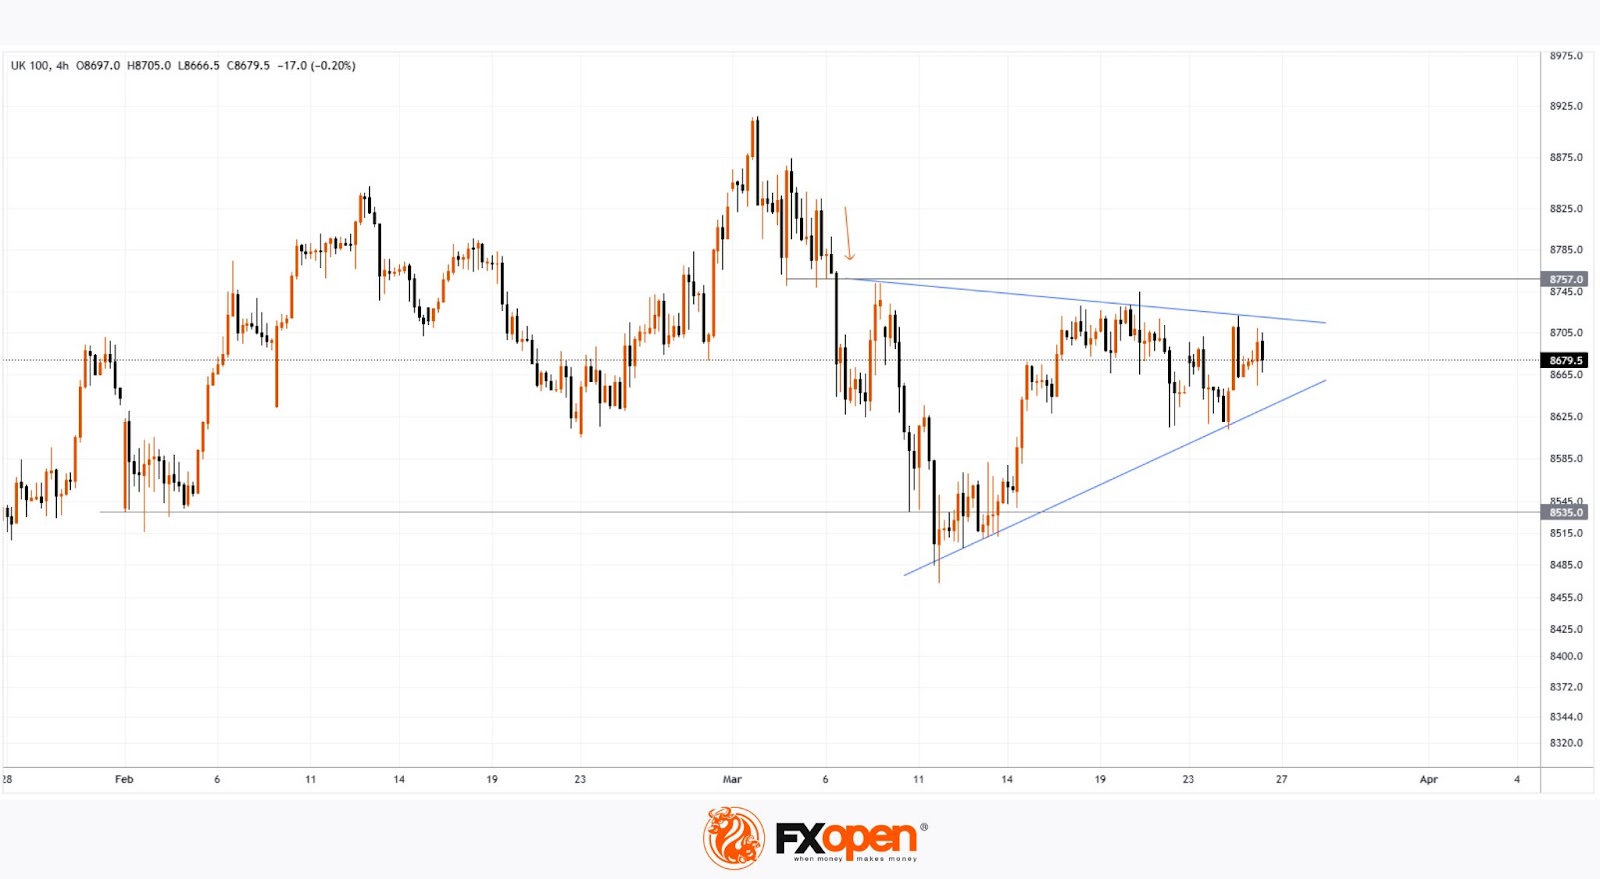
In early March, bearish activity (indicated by an arrow) led to a break of the support level around 8757, which then acted as resistance.
However, as soon as bears pushed the price below the February low, bulls stepped in.
Currently, the UK stock index chart is forming a narrowing triangle, which can be interpreted as a sign of equilibrium between supply and demand. However, this pattern will eventually be broken.
It is possible that the release of significant news—such as developments in international trade tariffs—could disrupt the balance of supply and demand, triggering a trend movement for the FTSE 100 index (UK 100 on FXOpen).
Trade global index CFDs with zero commission and tight spreads. Open your FXOpen account now or learn more about trading index CFDs with FXOpen.
This article represents the opinion of the Companies operating under the FXOpen brand only. It is not to be construed as an offer, solicitation, or recommendation with respect to products and services provided by the Companies operating under the FXOpen brand, nor is it to be considered financial advice.