Sample Category Title
GBPUSD: UK Inflation Shock & Dollar Resilience Shape Market Outlook
Fundamental Analysis: UK Inflation and Monetary Policy Expectations
Key Takeaways:
- UK inflation miss (2.8% YoY) pressures GBP, but sticky services inflation (5%) tempers BoE rate cut bets.
- Fiscal policy in focus: UK Spring Statement's spending cuts may limit growth, keeping GBP vulnerable.
- USD resilience persists despite tariff risks, with PCE data as next catalyst.
- Critical technical levels: 1.2850 (support) and 1.2950 (resistance). Breakouts will dictate short-term direction.
- Risk warning: Monetary policy divergence (BoE vs. Fed) and geopolitics fuel volatility.
The British Pound (GBP) faces bearish pressure this Wednesday following weaker-than-expected UK inflation data. February's annual Consumer Price Index (CPI) came in at 2.8%, below the 2.9% forecast and January's 3.0% reading. Core inflation (excluding volatile items) also eased to 3.5%, reinforcing expectations of potential Bank of England (BoE) rate cuts in coming months. However, services inflation—a key BoE metric—remained sticky at 5%, potentially delaying aggressive monetary easing.
Key Short-Term Drivers
Market focus now shifts to UK Chancellor Rachel Reeves' Spring Statement, expected to announce fiscal measures including welfare cuts and a £2.2 billion defense spending boost. Moderate fiscal tightening could cap economic growth and keep GBP subdued. Meanwhile, the US Dollar (USD) shows resilience despite uncertainty over potential Trump tariffs (April 2 deadline), adding volatility to the pair.
USD Outlook
Friday's US Core PCE data (Fed's preferred inflation gauge) will be critical. A persistent print (forecast: 2.7% YoY) may strengthen the USD further, while a downside surprise could revive risk appetite and temporarily relieve GBP pressure.
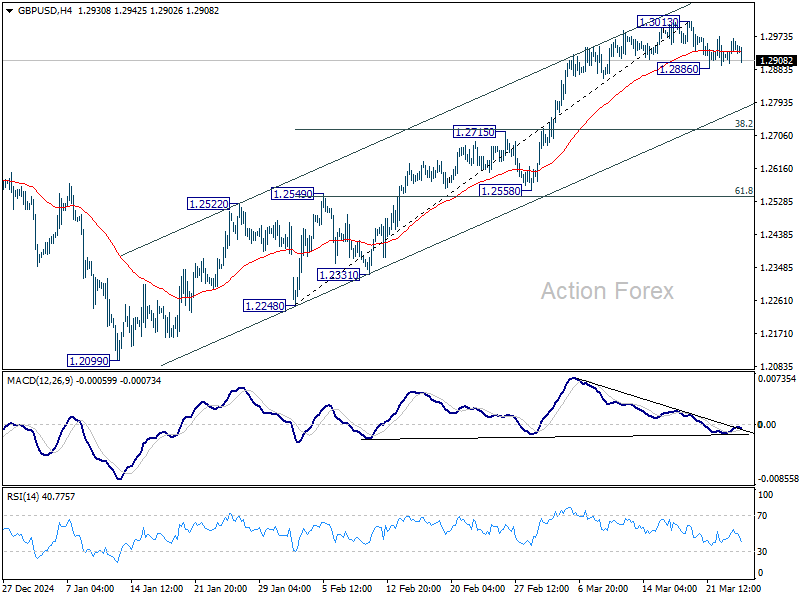
Technical Analysis | GBPUSD, H4
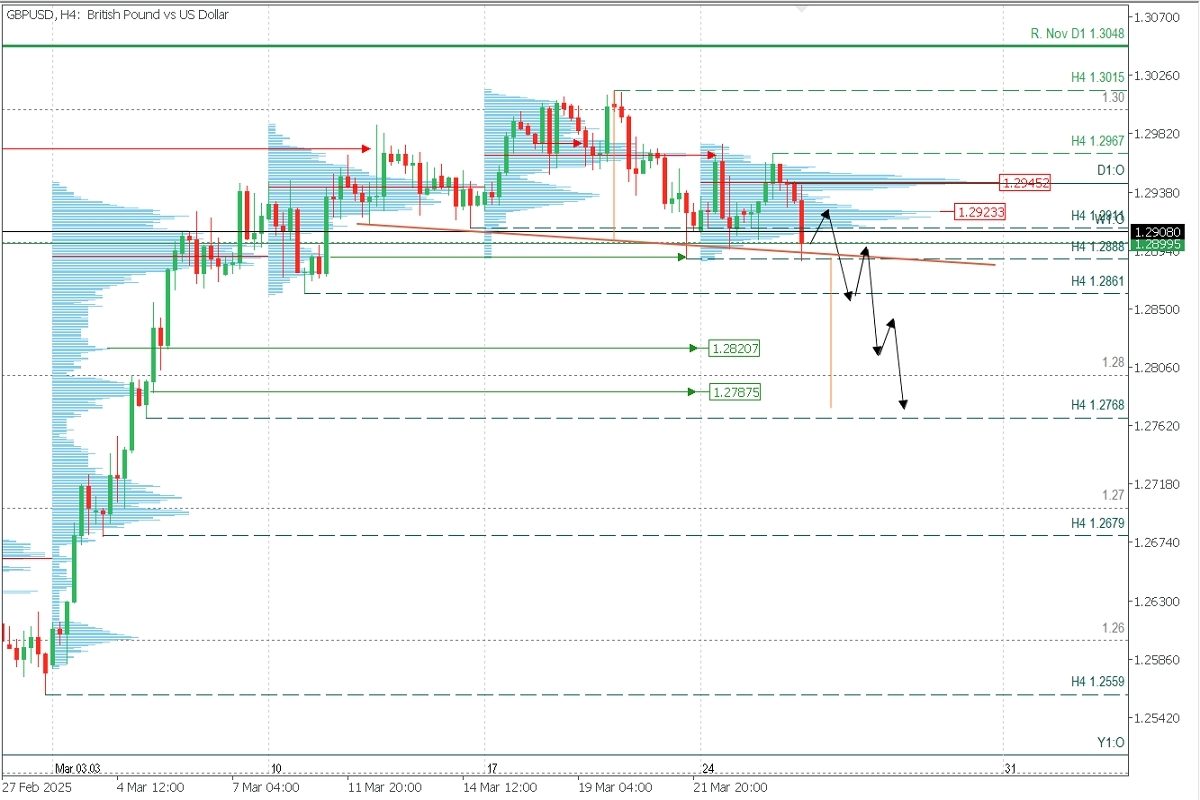
Supply Zone (Sell): 1.2945 || Demand Zones (Buy): 1.2820 / 1.2787
Price opened the session with a -0.40% decline following disappointing UK February CPI data. This activated a head-and-shoulders reversal pattern, with the descending neckline indicating increasing bearish pressure.
The bullish technical structure is challenged by two consecutive (though weak) breakdowns below the key H4 support at 1.2911. This latest low establishes 1.2967 as the last validated H4 resistance, which now serves as our reference level for maintaining a bearish bias unless decisively broken.
In this context, we anticipate further downside after a potential pullback toward 1.2927-1.2930, where fresh selling pressure could emerge. Targets align with high-volume demand zones at 1.2820 and 1.2787, which also match the measured move projection of the reversal pattern.
Trading Scenarios:
- Bearish: Wait for buyers to push the price to 1.2927, then sell below it, targeting 1.2861, 1.2820, 1.2800, and 1.2787.
- Bullish: Only above 1.2787, targeting 1.2860.
Invalidation Conditions: The reversal scenario is invalid if the price decisively breaks above the 1.2945 POC (Point of Control) and the 1.2967 resistance.
Critical Notes:
Reversal/Exhaustion Pattern (PAR): Always wait for M5 confirmation (e.g., pin bars or engulfing patterns) before entering trades at key levels.
POC Significance: The Point of Control marks the highest volume concentration. If the price previously fell from this zone, it acts as resistance; if it rallied, it becomes support.
This technical outlook remains valid unless fundamental catalysts (e.g., US PCE data) override price action.
USD/JPY Rises Again: Yen Lacks Support as Bulls Take Control
The USD/JPY pair climbed to 150.37 on Wednesday, indicating a fading correction from the previous session as trading volumes declined.
Key drivers behind the USD/JPY surge
Investors are shunning risk ahead of potential US retaliatory tariffs, which could weigh on Japanese exports – a key pillar of the economy. Meanwhile, demand for risk assets, including equities and commodities, has further eroded support for the safe-haven yen.
The Bank of Japan’s (BoJ) January meeting minutes, released earlier, revealed policymakers’ willingness to consider further rate hikes, contingent on wage growth and inflation trends. One member even suggested rates could reach 1% in the second half of fiscal 2025.
However, the BoJ’s decision in March to hold rates at 0.5% reinforced its cautious stance, with officials wary of global economic risks, particularly potential US trade measures. Given the central bank’s reluctance to tighten policy soon, the yen lacks a key bullish catalyst.
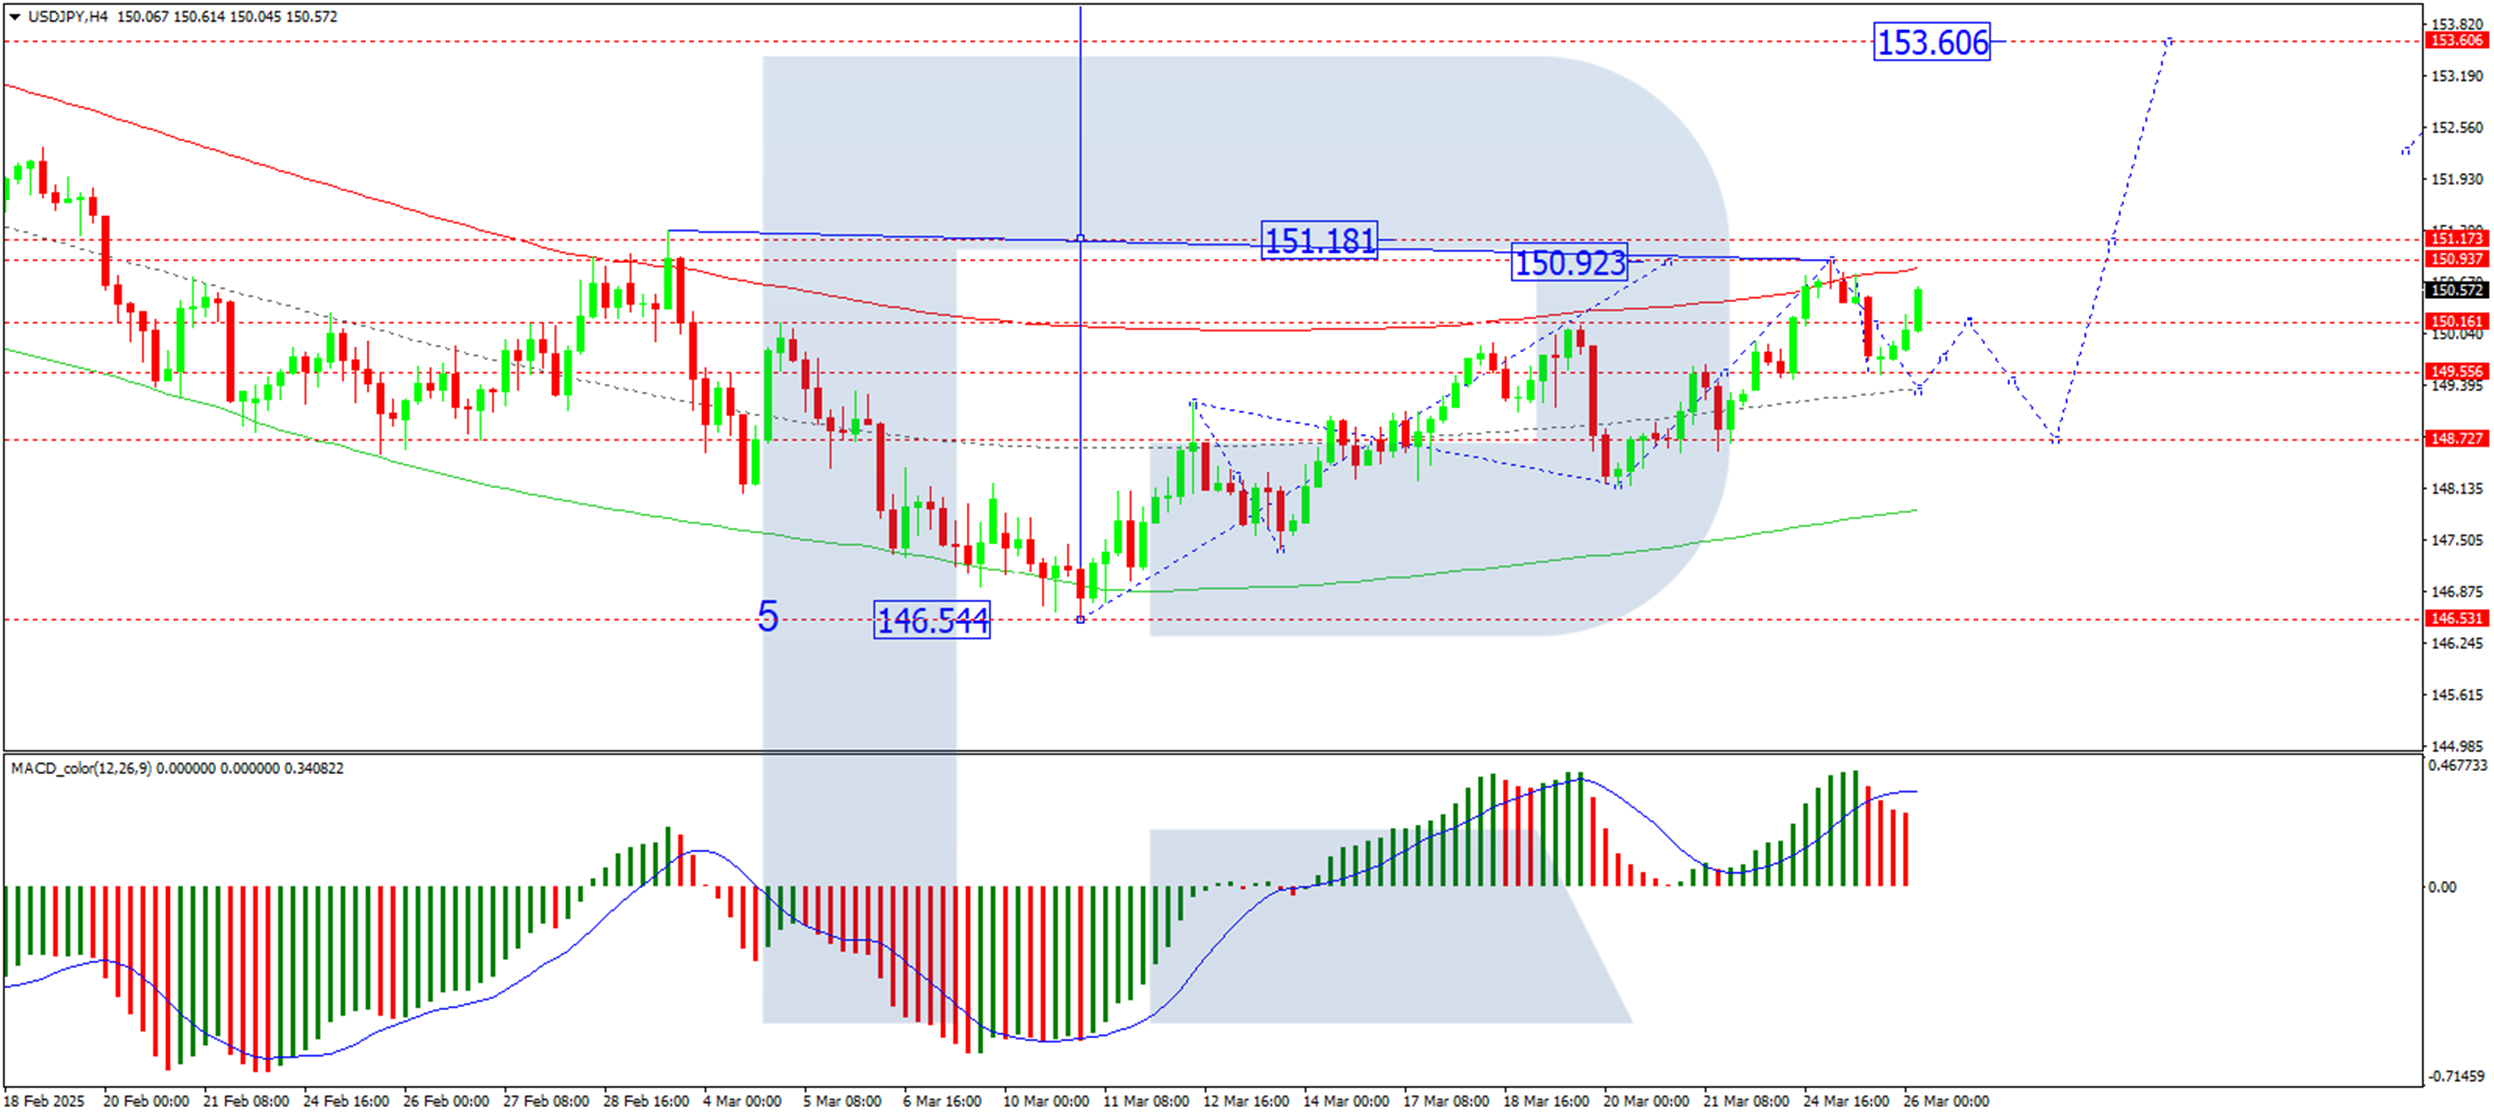
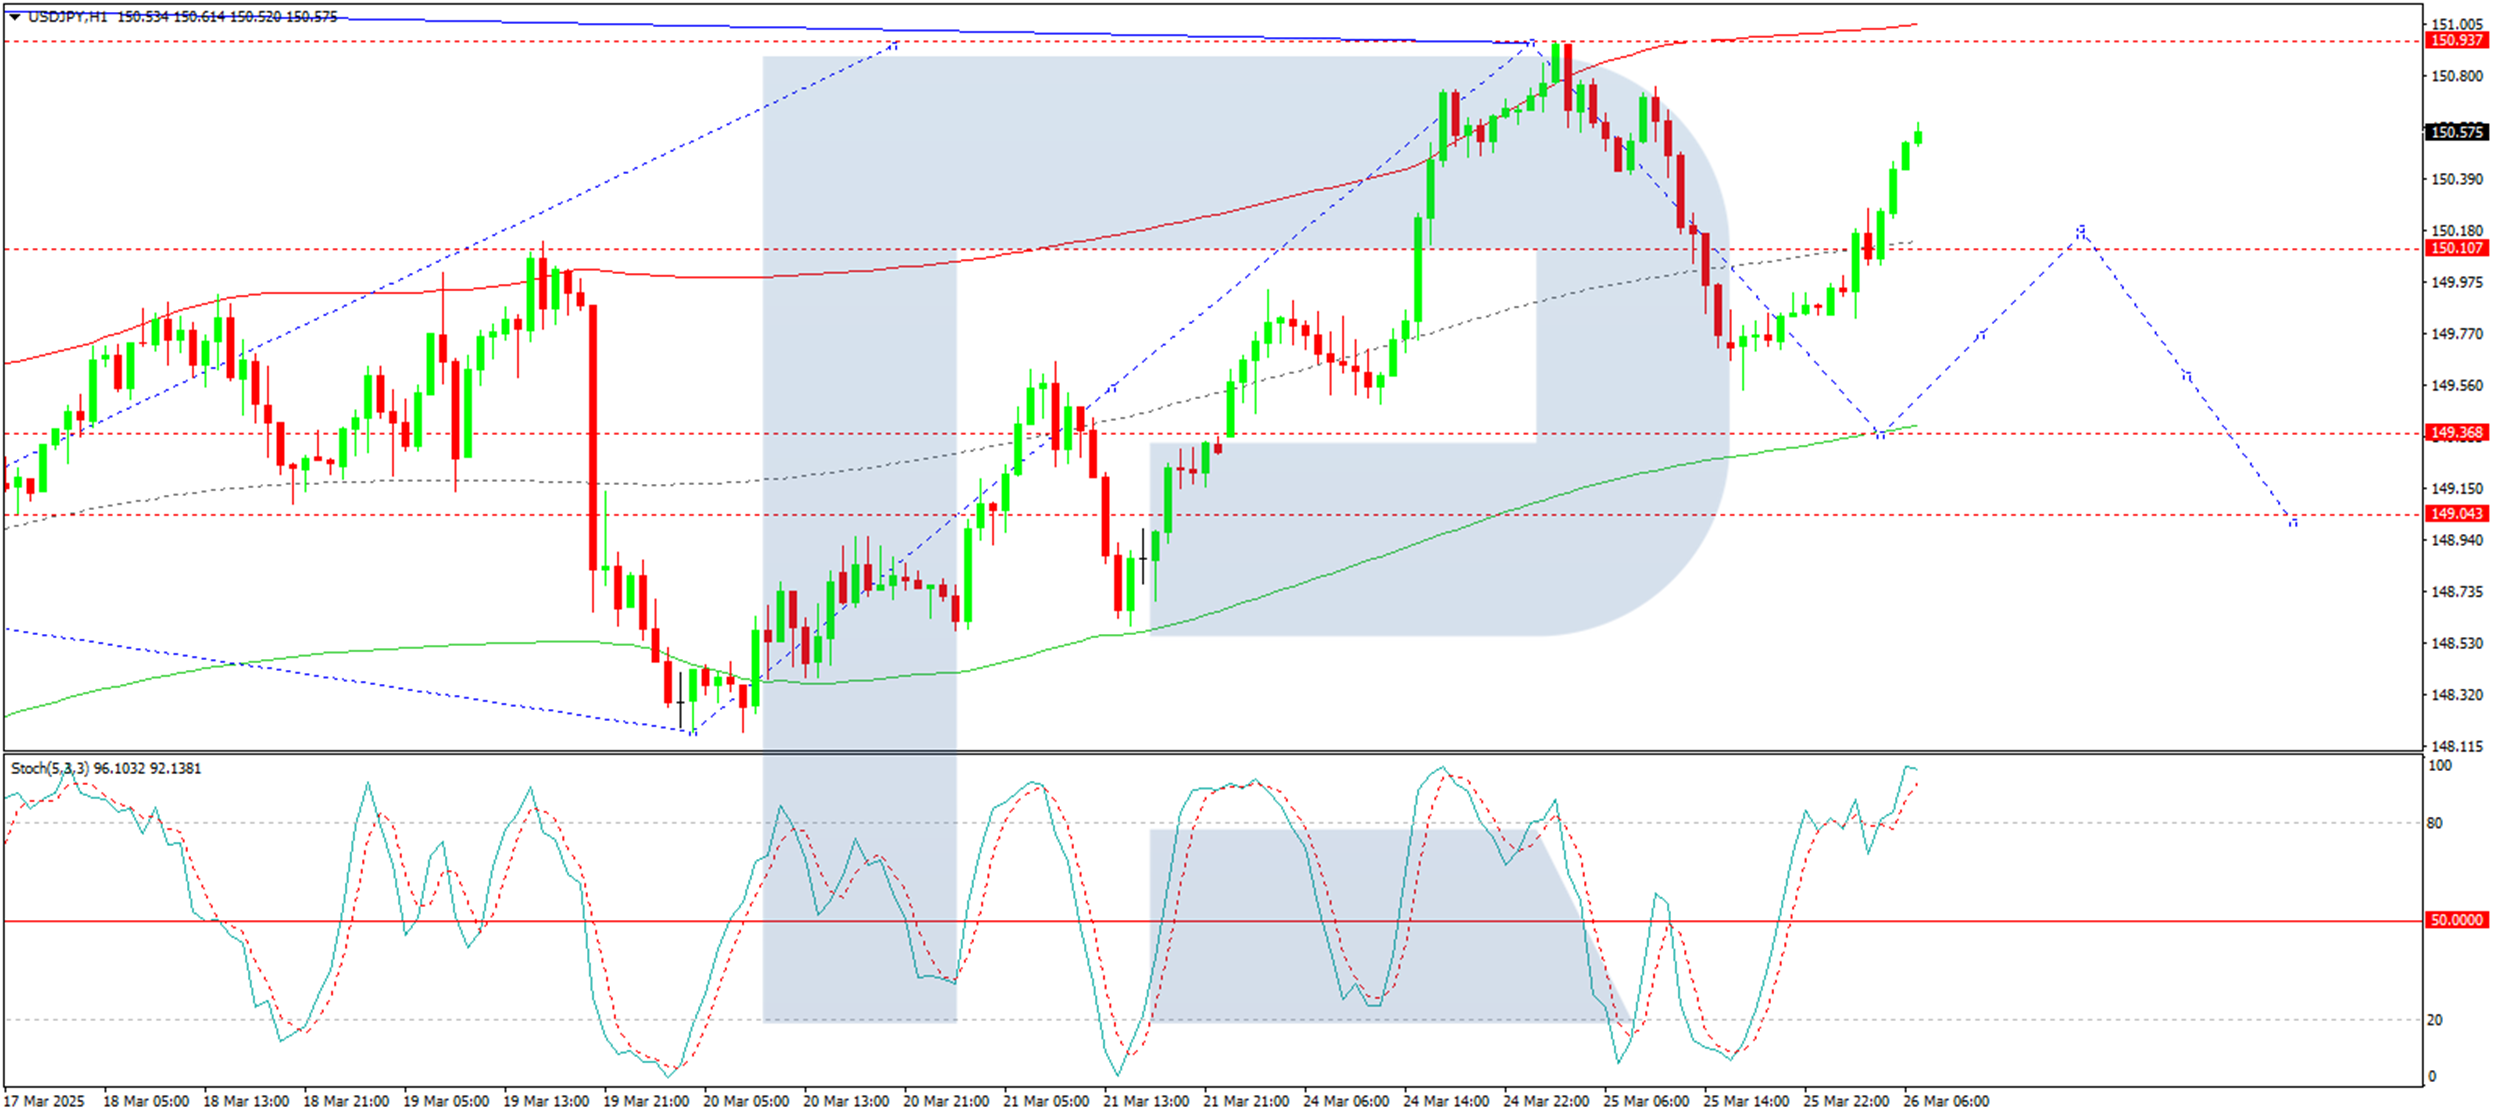
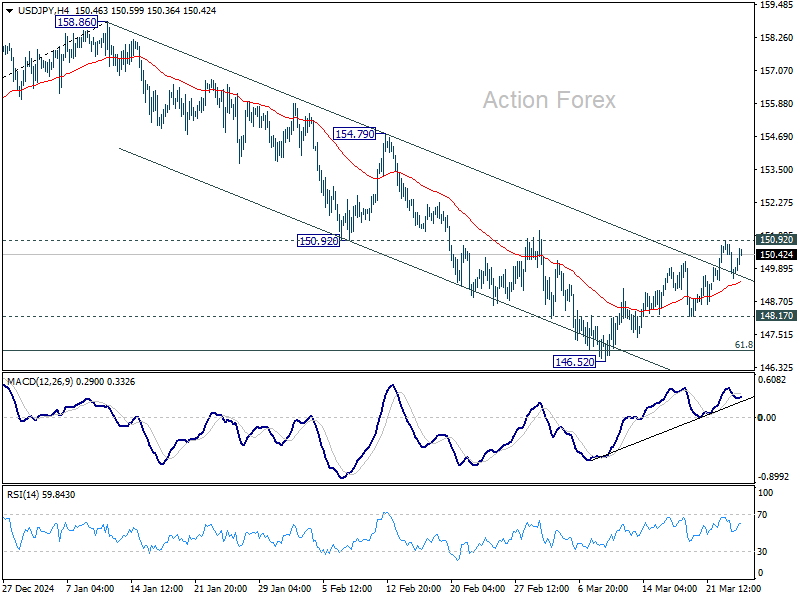
Technical analysis of USD/JPY
On the H4 USD/JPY chart, the market has formed a growth wave structure up to 150.93. After reaching this target, a pullback to 148.73 is possible, effectively marking the consolidation range at the wave’s peak. A breakout to the upside would indicate a continuation of the trend towards 153.60. This is a local target, after which a correction to 151.20 cannot be ruled out. Technically, this scenario is supported by the MACD indicator: its signal line remains above zero and has exited the histogram zone. A decline towards the zero line is expected.
On the H1 USD/JPY chart, the market is forming a correction up to 149.30. Once this pullback is complete, a new growth wave towards 150.97 may begin. This is also a local target. Technically, the Stochastic oscillator confirms this scenario, as its signal line is above 80 and preparing to decline towards 20.
Conclusion
With the BoJ maintaining a dovish stance and risk sentiment weighing on the yen, USD/JPY bulls remain in control. Traders should watch for a breakout above 150.93 to confirm further upside, while corrections could offer short-term pullback opportunities.
EUR/USD Retreats, USD/JPY Eyes Fresh Surge
EUR/USD declined from the 1.0950 resistance and traded below 1.0850. USD/JPY is rising and might gain pace above the 151.00 resistance.
Important Takeaways for EUR/USD and USD/JPY Analysis Today
- The Euro started a fresh decline below the 1.0850 support zone.
- There is a key bearish trend line forming with resistance at 1.0820 on the hourly chart of EUR/USD at FXOpen.
- USD/JPY climbed higher above the 149.55 and 150.00 levels.
- There is a connecting bullish trend line forming with support at 150.30 on the hourly chart at FXOpen.
EUR/USD Technical Analysis
On the hourly chart of EUR/USD at FXOpen, the pair struggled to clear the 1.0950 resistance zone. The Euro started a fresh decline and traded below the 1.0850 support zone against the US Dollar.
The pair declined below 1.0820 and tested the 1.0775 zone. A low was formed near 1.0776 and the pair started a consolidation phase. There was a minor recovery wave above the 1.0800 level. The pair tested the 23.6% Fib retracement level of the downward move from the 1.0954 swing high to the 1.0776 low.
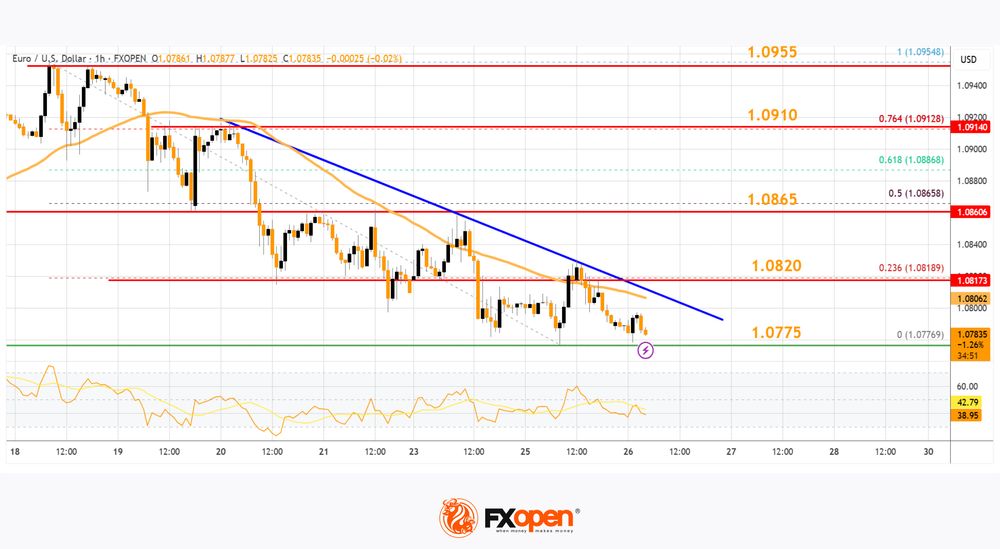
The pair is now trading below 1.0820 and the 50-hour simple moving average. On the upside, the pair is now facing resistance near the 1.0820 level. There is also a key bearish trend line forming with resistance at 1.0820.
The next key resistance is at 1.0850. The main resistance is near the 1.0865 level or the 50% Fib retracement level of the downward move from the 1.0954 swing high to the 1.0776 low.
A clear move above the 1.0865 level could send the pair toward the 1.0910 resistance. An upside break above 1.0910 could set the pace for another increase. In the stated case, the pair might rise toward 1.0950.
If not, the pair might resume its decline. The first major support on the EUR/USD chart is near 1.0775. The next key support is at 1.0750. If there is a downside break below 1.0725, the pair could drop toward 1.0700. The next support is near 1.0650, below which the pair could start a major decline.
USD/JPY Technical Analysis
On the hourly chart of USD/JPY at FXOpen, the pair started a fresh upward move from the 148.20 zone. The US Dollar gained bullish momentum above 148.80 against the Japanese Yen.
It even cleared the 50-hour simple moving average and 149.55. The pair climbed above 150.00 and traded as high as 150.94. It is now consolidating gains and there was a move below the 23.6% Fib retracement level of the upward move from the 148.18 swing low to the 150.94 high.
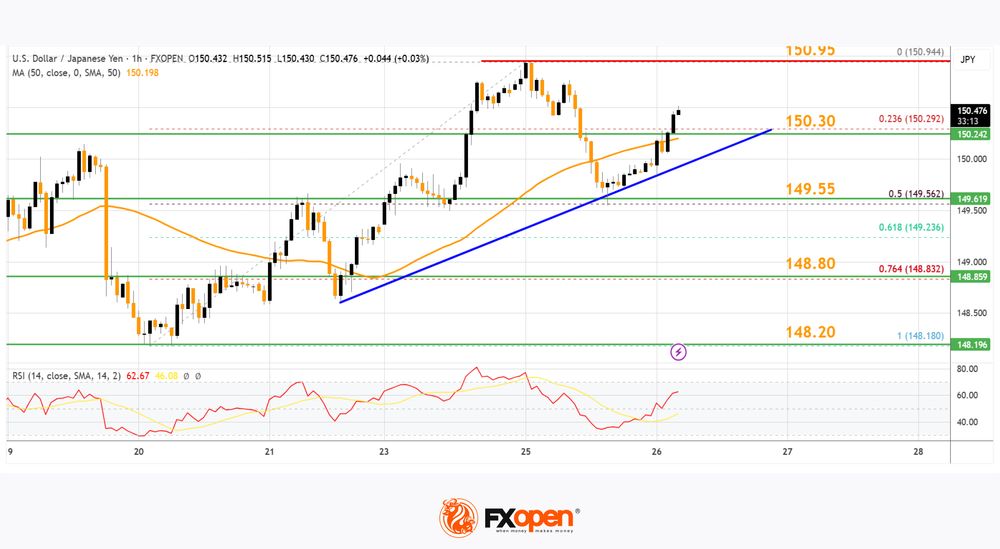
The current price action above the 150.00 level is positive. Immediate resistance on the USD/JPY chart is near 150.95. The first major resistance is near 151.20. If there is a close above the 151.20 level and the RSI moves above 70, the pair could rise toward 152.50.
The next major resistance is near 153.20, above which the pair could test 155.00 in the coming days. On the downside, the first major support is 150.30 and a bullish trend line, below which the bears could gain strength.
The next major support is visible near the 149.55 level and the 50% Fib retracement level of the upward move from the 148.18 swing low to the 150.94 high.
If there is a close below 149.55, the pair could decline steadily. In the stated case, the pair might drop toward the 148.40 support zone. The next stop for the bears may perhaps be near the 147.50 region.
Trade over 50 forex markets 24 hours a day with FXOpen. Take advantage of low commissions, deep liquidity, and spreads from 0.0 pips. Open your FXOpen account now or learn more about trading forex with FXOpen.
This article represents the opinion of the Companies operating under the FXOpen brand only. It is not to be construed as an offer, solicitation, or recommendation with respect to products and services provided by the Companies operating under the FXOpen brand, nor is it to be considered financial advice.
ECB’s Panetta: Focus on inflation, not unreliable neutral rate estimates
Italian ECB Governing Council Member Fabio Panetta urged the central bank to steer its attention toward inflation projections rather than attempting to anchor policy decisions on the elusive concept of the “neutral interest rate” or R-star.
In a letter to the Financial Times, Panetta argued that the neutral rate is an invisible target that can only be approximated using models and surveys that are “riddled with uncertainty,” especially in today’s volatile environment.
Panetta warned against ECB becoming “fixated” on labeling its stance as restrictive based on R-star estimates, calling. Instead, he emphasized that the ECB’s efforts should remain firmly grounded in assessing inflation data and determining whether monetary policy is appropriately calibrated to bring inflation sustainably back to the 2% target.
Moody’s Warned the US for Deteriorating Fiscal Outlook
Markets
After a rather clear, straightforward narrative earlier this month including a presumed European reflation and at the same time risks for the US to slip into stagflation dynamics, global markets this week entered a more erratic wait-and-see pattern. Amongst others, the April 2 ‘Liberation Day’ tariffs are looming large. The March US consumer confidence (Conference Board) confirmed the stagflation mix seen in other sentiment indicators of late. The headline index declined from 100.1 to 92.9, but expectations nosedived (74.8 from 65.2, the lowest in 12 years). Inflation expectations for the next 12 months rose further from 5.8% average to 6.2%. US yields reversed an initial up-tick with yields closing the session lower between 2.6 bps (5-y) and 0.4 bps (30-y). In an FT article this morning, Fed Goolsbee indicated that if market-based long-term inflation expectations would move toward recent rises in survey expectations, this would be a red flag which the Fed would have to address ‘almost regardless of the circumstances’. Overall Goolsbee indicated that wait-and-see remains the preferred approach when ‘there’s a lot of dust in the air’. Equities showed some intraday swings but closed in green on both sides of the Atlantic, Europe this time outperforming (S&P +0.16%, Eurostoxx 50 +1.09%). No clear trend in the dollar. DXY ran into resistance after recent rebound (close 104.18). Even so, also the euro failed to profit (EUR/USD close 1.0791).
This morning, Asian equities mostly show limited gains, but caution prevails going into the end of the quarter and the April 2 deadline. Later today, the eco calendar in EMU is thin. In the US, the February durable goods orders will only be of intraday importance. The US CBO gives an estimate on when the country reaches its debt ceiling. The Goolsbee comments, alongside last week’s Fed dots in theory should help to put a floor for US (ST) yields. EUR/USD struggles to avoid further losses below 1.08. The UK ONS reported UK headline inflation slightly lower than expected at 0.4% M/M and 2.8% Y/Y (from 3.0%). Core inflation also eased to 3.5% from 3.7% (3.6% expected), but services inflation remains elevated at 5.0%. Sterling is ceding modest ground after the release (EUR/GBP 0.8345). Question is whether this provides enough room for the BoE to continue further easing in May. UK Chancellor Rachel Reeves will present the Spring Fiscal update. The Office for Budget responsibility in a new forecast might signal lower growth and higher inflation, further pressuring UK finances. Reeves is expected to respond with additional spending cuts (£10bn?). A restrictive fiscal policy in theory turns the focus to monetary policy (if there is room) and ceteris paribus also shouldn’t be great news for sterling.
News & Views
Moody’s warned the US for a deteriorating fiscal outlook, saying that president Trump’s policies including trade tariffs and unfunded tax cuts could in fact do more harm than good for government revenues. Moody’s is the last of the three major ones to have assigned the US a topnotch AAA-rating. It downgraded the outlook to negative in November 2023 though over entrenched political polarization and worrying fiscal developments. Moody’s said yesterday the situation has only deteriorated further since. “Fiscal strength is on course for a continued multiyear decline” even in very favorable economic and financial scenarios, it added. And while Moody’s assumes a still strong and resilient US economy, it said that these “formidable strengths” may no longer offset widening fiscal deficits and declining debt affordability. The rating agency also warned for the significant long-term consequences that the US policy agenda on trade, immigration, taxes, federal spending and regulations could have as it reshapes not only the US but also the global economy.
The Hungarian central bank (MNB) kept policy rates as expected steady at 6.5%. They won’t be lowered any time soon either with the new governor Varga in his first presser pointing to a deterioration in the inflation outlook. While inflation likely peaked in February (5.6%), strong price dynamics in market services point to higher prices throughout the year, the central bank statement reads. In the upwardly revised projections, CPI won’t return to the central bank 3% +/- 1 ppt tolerance band before the beginning of 2026 and hit the mid-point by the end of that year. Forecasts for this year were put sharply higher, from 3.3%-4.1% to 4.5%-5.1%. Inflation risks remain tilted to the upside. Private consumption is expected to drive economic growth with recovering external demand (exports) adding to that over the medium term. GDP should grow by 1.9-2.9% in 2025 and 3.7%-4.7% in 2026. The forint closed at a slightly weaker level against the euro in volatile trading. EUR/HUF remains just south of 400 though. Hungarian swap yields dropped sharply, up to 20 bps, suggesting the market pricing was getting stretched. Virtually no cuts were priced in for this year prior to the central bank decision..
EUR/USD Daily Outlook
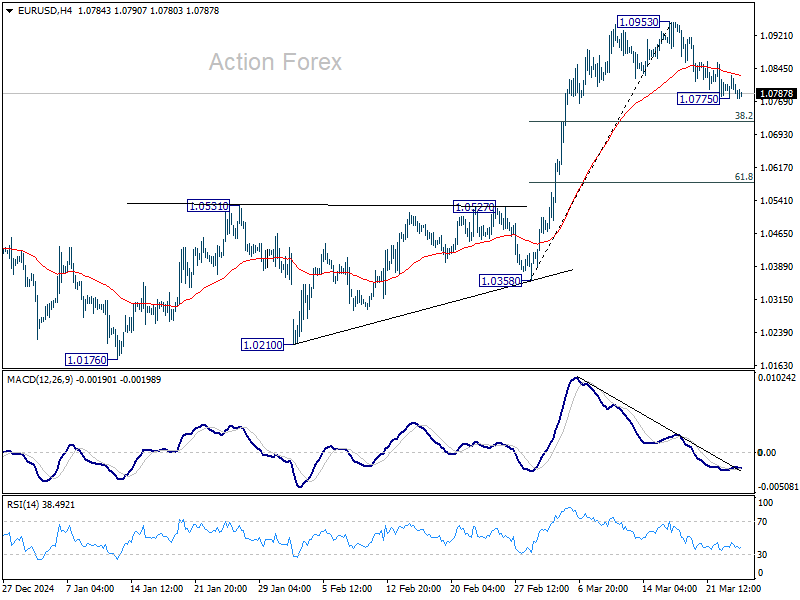
Daily Pivots: (S1) 1.0769; (P) 1.0800; (R1) 1.0822; More...
Intraday bias in EUR/USD remains neutral for the moment. Corrective pattern from 1.0953 could extend with another fall. But downside should be contained by 38.2% retracement of 1.0358 to 1.0953 at 1.0726 to bring rebound. On the upside, break of 1.0953 will resume the rally from 1.0176 towards 1.1274 key resistance.
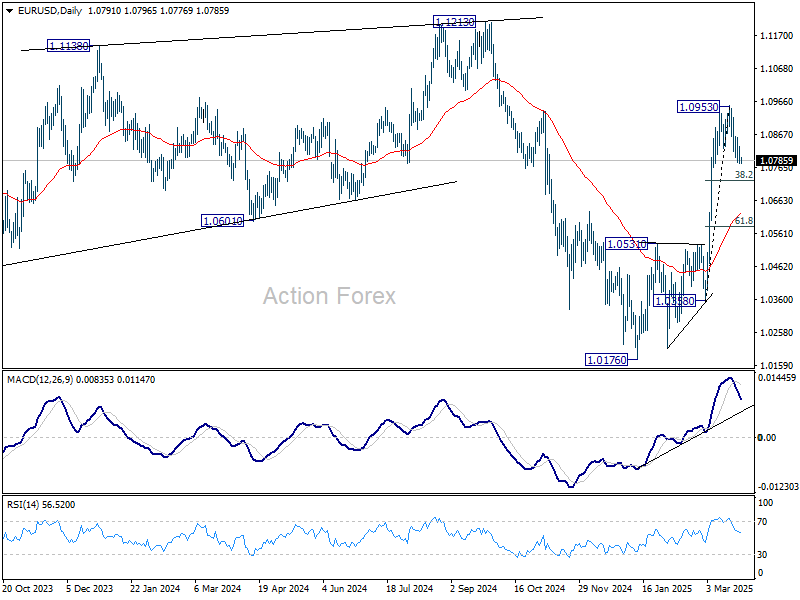
In the bigger picture, prior strong break of 55 W EMA (now at 1.0675) suggests that fall from 1.1274 (2024 high) has completed as a three wave correction to 1.0176. Rise from 0.9534 is still intact, and might be ready to resume. Decisive break of 1.1274 will target 100% projection of 0.9534 to 1.1274 from 1.0176 at 1.1916. Also, that will send EUR/USD through a multi-decade channel resistance will carries larger bullish implication. This will now be the favored case as long as 1.0531 resistance turned support holds.
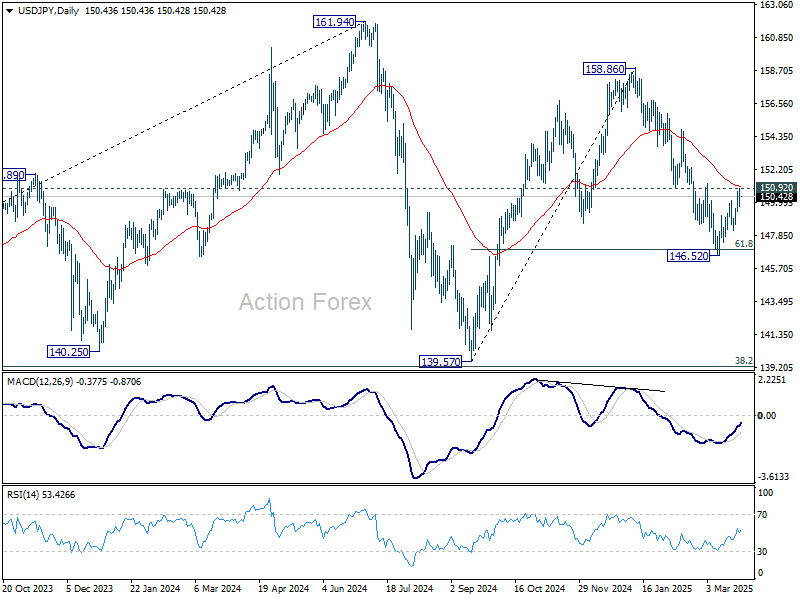
USD/JPY Daily Outlook
Daily Pivots: (S1) 149.33; (P) 150.14; (R1) 150.72; More...
Intraday bias in USD/JPY remains neutral at this point. Strong resistance is still expected from 150.92 to complete the corrective recovery from 146.52. On the downside break of 148.17 support will bring retest of 146.52 first. Sustained trading below 61.8% retracement of 139.57 to 158.86 at 146.32 will resume the fall from 158.86 to 139.57 support. However, firm break of 150.92 will argue that fall from 158.86 has completed and turn bias back to the upside for 154.79 resistance next.
In the bigger picture, price actions from 161.94 are seen as a corrective pattern to rise from 102.58 (2021 low), with fall from 158.86 as the third leg. Strong support should be seen from 38.2% retracement of 102.58 to 161.94 at 139.26 to bring rebound. However, sustained break of 139.26 would open up deeper medium term decline to 61.8% retracement at 125.25.
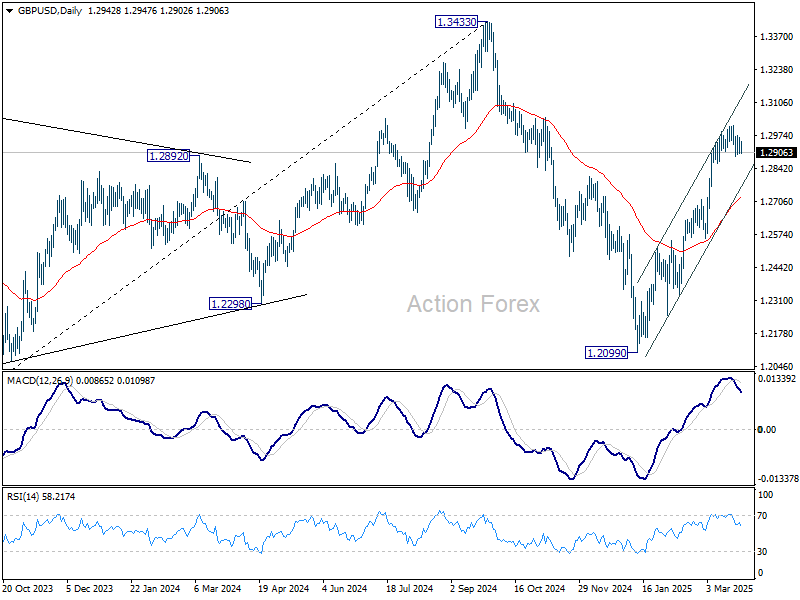
GBP/USD Daily Outlook
Daily Pivots: (S1) 1.2909; (P) 1.2938; (R1) 1.2974; More...
Intraday bias in GBP/USD remains neutral first. On the downside, break of 1.2886 will resume the correction from 1.3013 and turn bias to the downside. But downside should be contained by 38.2% retracement of 1.2248 to 1.3013 at 1.2721 to bring rebound. On the upside, break of 1.3013 will resume the rally from 1.2099.
In the bigger picture, up trend from 1.3051 (2022 low) is not completed. Resumption is expected after corrective pattern from 1.3433 completes. Next target will be 1.4248 key resistance. This will now remain the favored case as long as 1.2099 support holds.
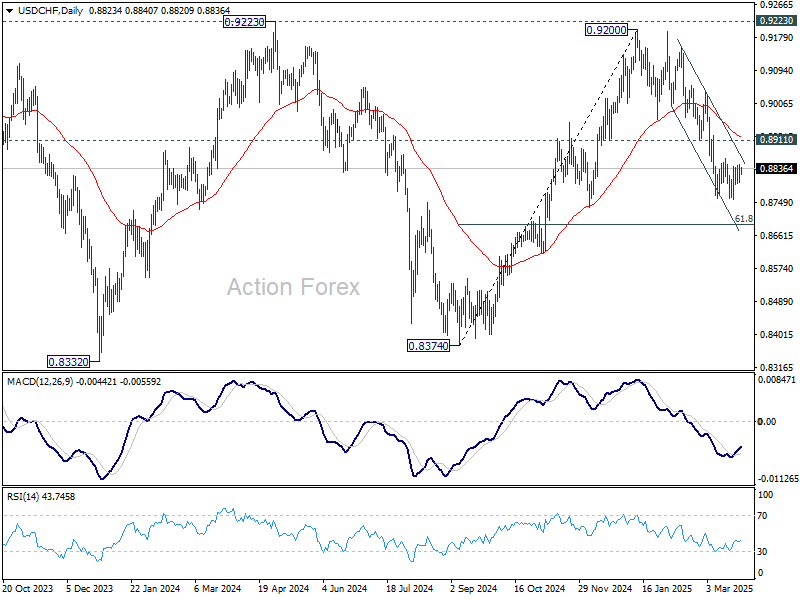
USD/CHF Daily Outlook
Daily Pivots: (S1) 0.8801; (P) 0.8825; (R1) 0.8850; More…
Intraday bias in USD/CHF remains neutral. Consolidation from 0.8757 is still in progress. In case of stronger recovery, upside should be limited by 0.8911 support turned resistance. On the downside, break of 0.8757 will resume the fall from 0.9200 to 61.8% retracement of 0.8374 to 0.9200 at 0.8690. Sustained break there will pave the way back to 0.8374 support.
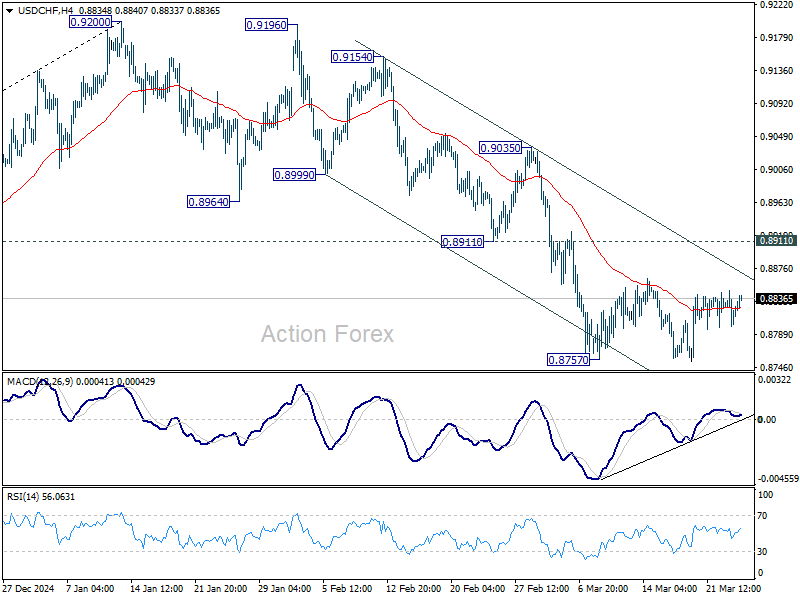
In the bigger picture, rejection by 0.9223 key resistance keep medium term outlook bearish. That is, larger fall from 1.0342 (2017 high) is not completed yet. Firm break of 0.8332 (2023 low) will confirm down trend resumption.
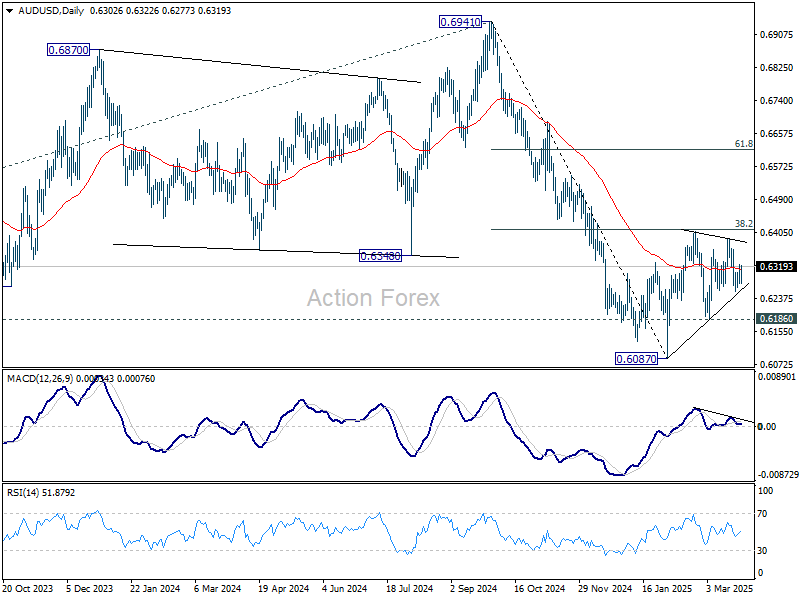
AUD/USD Daily Report
Daily Pivots: (S1) 0.6278; (P) 0.6302; (R1) 0.6327; More...
Intraday bias in AUD/USD remains neutral for the moment. On the downside, firm break of near term trend line support (now at 0.6262) will argue that corrective pattern from 0.6087 has already completed. Intraday bias will be back on the downside for 0.6186 support. Further break there will solidify this bearish case and target 0.6087 low. For now, in case of another rise, upside should be limited by 38.2% retracement of 0.6941 to 0.6087 at 0.6413.
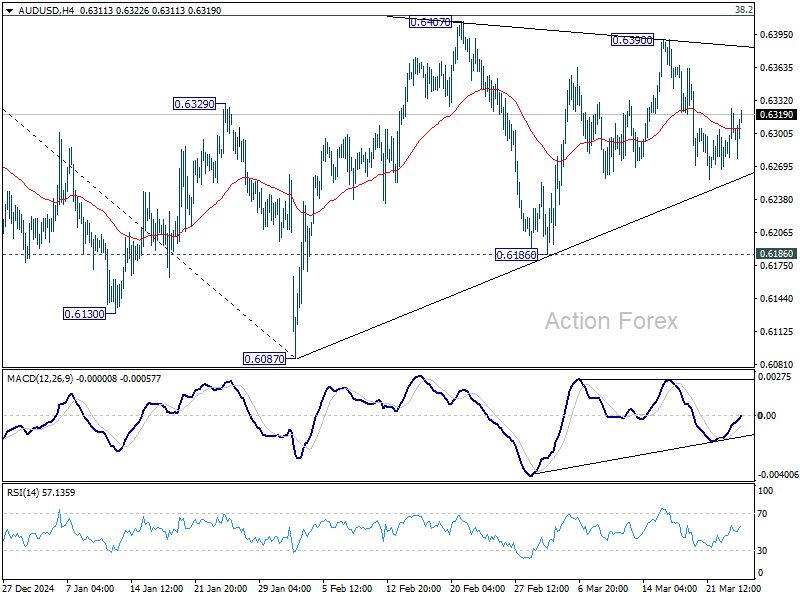
In the bigger picture, fall from 0.6941 (2024 high) is seen as part of the down trend from 0.8006 (2021 high). Next medium term target is 61.8% projection of 0.8006 to 0.6169 from 0.6941 at 0.5806. In any case, outlook will stay bearish as long as 55 W EMA (now at 0.6467) holds.