Sample Category Title
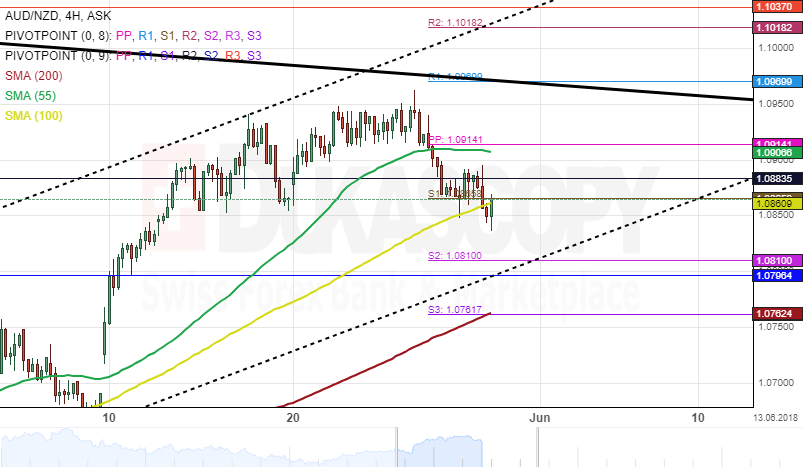
AUD/NZD 4H Chart: Temporary Retracement
The bullish momentum which began mid-April has guided the AUD/NZD exchange rate towards the upper boundary of a dominant descending channel. This scores a 4.48% increase in price within the last month.
After reaching the weekly pivot point near the 1.09 mark, the currency pair reversed south. it seems that this may point to a continuous movement down potentially aiming for the southern border of a junior ascending pattern.
Regarding future trading, the currency exchange rate is likely to continue to decline during the following trading session until the lower boundary of the junior ascending channel is breached.
EUR/USD: US CB Consumer Confidence
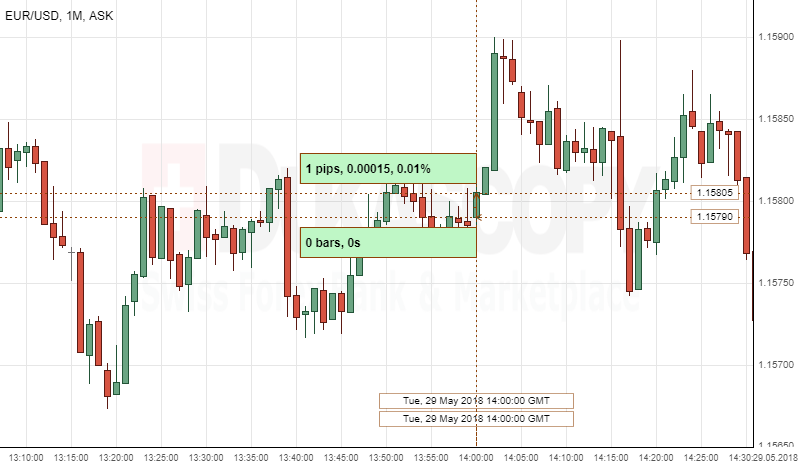
The Greenback weakened against the Eurozones's single currency, following the US CB Consumer Confidence data release on Tuesday. The EUR/USD currency pair gained one pip, or 0.01%, to continue fluctuating in the 1.1567 area.
The Conference Board Inc. released Consumer Confidence data that came out lower-than-expected of 128.0, compared to the 128.7 in the previous period.
'Overall, confidence levels remain at historically strong levels and should continue to support solid consumer spending in the near-term,' Lynn Franco, director of Economic Indicators at The Conference Board, said.
Euro Gripped By ‘Italexit’ Fears, US GDP And ADP In Foc
The past few days have not been kind to the Euro, which has tumbled to levels not seen since July 2017 amid the brewing political chaos in Italy.
With recent media reports stating that Italy’s PM-designate Carlo Cottarellihas simply failed to garner any support from major political parties, President Sergio Mattarella could dissolve Parliament in the coming days. The looming prospect of fresh elections potentially strengthening the position of Eurosceptic parties and resulting in a referendum on the Euro is likely toleave investors on edge. Sentiment remains bearish towards the Euro moving forward and the growing threat of a possible “Italexit” challenging the future of the European Unionmayspell more pain for the single currency.
It is worth noting that a depreciating Euro could somewhat support the ECB’s efforts to hit the 2% inflation target, by making exports more competitive and imports more expensive. However, signs of political instability in Europe negatively impacting growth mayraise the prospect of QE rolling over into 2019.
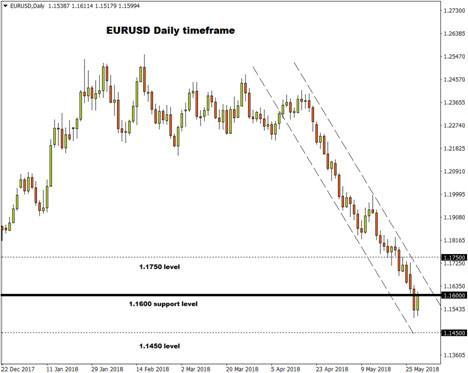
Taking a look at the technical picture, the EURUSD remains bearish on the daily charts despite prices staging a rebound towards the 1.1600 level this morning. Previous support at 1.1600 could transform into a dynamic resistance that encourages a decline back towards 1.1450. Alternatively, a breakout above 1.1600 could invite an incline towards 1.1750.
Dollar eases ahead of ADP and GDP data releases
The Dollar retreated from a six-and-a-half-month high this morning, as investors engaged in a bout of profit taking ahead of the hotly anticipated releases of theADP employment report & Q1 GDP figures.
ADP employment is expected to show a gain of 191,000 positions in May, while the second estimate of the first quarter US GDP is projected to hit 2.3%. Market expectations over higher US interest rates this year are likely to receive a boost if ADP and GDP figures exceed market forecasts.
Taking a look at the technical picture, the Dollar Index remains firmly bullish on the daily charts. Prices are trading above the daily 200 SMA while the MACD trades to the upside. Heightened US rate hike expectations have made the Dollar king against of major currencies. A decisive breakout and daily close above 95.00 may open the gates towards 96.00 and 96.60, respectively. Alternatively, if the Dollar Index fails to push above the 95.00 level, prices could dip towards 94.00.
Currency spotlight – GBPUSD
Sterling has suffered heavy losses against the Dollar thanks to growing fears of a possible Eurozone breakup.
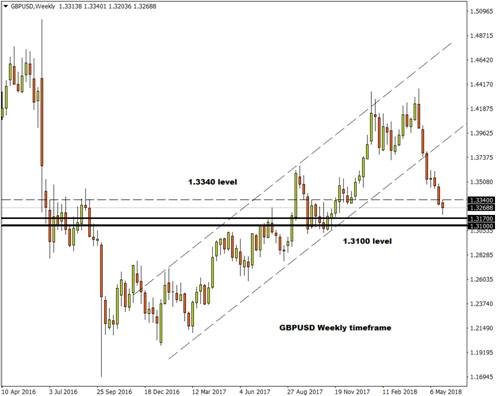
A return of risk aversion amid the political turmoil in Italy simply encouraged investors to rush to safety, weakening the British Pound as a result. With Brexit uncertainty and fading BoE rate hike expectations adding to the Pound’s woes, further losses could be on the cards. Taking a look at the technical picture, the GBPUSD is under pressure on the daily and weekly charts. Sustained weakness below the 1.3340 level could encourage a decline towards 1.3170 and 1.3100, respectively.
Commodity spotlight – WTI Oil
Oil prices witnessed some stability on Wednesday, after depreciating sharply in recent days on prospect that OPEC and Russia will be easing supply curbs in response to falling global crude inventories.
With OPEC and Russia’s plans to boost output potentially scaring oil bulls away and reviving oversupply concerns, WTI Crude remains vulnerable to further losses. It should be kept in mind that geopolitical risk factors in the form of looming sanctions against Iran, falling output from Venezuela and tensions in the Middle East could support oil prices in the short term. However, the possibility of rising output from Russia and OPEC combined with robust US Shale production could create major headwinds for oil further down the road.
USD Trims Gains As Markets Stabilise
A roller coaster ride for the Swiss franc
The FX market continues to be driven by the Italian and Spanish political developments; however, the risk-off sentiment has eased somewhat as investors take a step back to re-evaluate the situation. EUR/USD is up 0.50% this morning as it climbed back towards 1.16 after having reached 1.1510, the lowest level since July 2017. European equities, and more specifically Italian ones, were better bid on Thursday morning with the FTSE MIB rising 0.80%, while the Eurostoxx 600 edged slightly higher by 0.05%. Italian treasuries were also better bid with the 2-year yield easing to 2%, while the 10-year one stabilised around 3%.
Against the backdrop of rising Euroscepticism in the The Swiss franc had a bumpy late European session yesterday as USD/CHF hit 0.9983 before falling 1.33% to 0.9851. The currency pair end up the day around 0.99. EURCHF fell as low 1.1368 before bouncing back to 1.1439. Given the sharp depreciation of the euro of the last few days, a period of consolidation would more than reasonable. Even though investors have taken a more risk-on approach on the FX market, the sentiment on the equity is still mostly negative.
Weak oil
Global risk aversion triggered by political risk mounting in Italy hit crude oil prices hard. Following Friday massive selloff in crude as mixed message from OPEC seem to suggest production cuts might not last. The catalyst for the non-financial markets move was news that Russia and Saudi Arabia had suggested that output quotas might be flexible (however, other producers have voiced opposition). The failure for crude prices to hold the high ground is clearly a bearish indicator in the short run. The liquidation of massive short indicates that downside correction could be significant. Current pricing is more than just extended long trade, but fundamental concern of slowing global demand and higher product from non-OPEC members. Traders will be watching API inventories with expectations of 500k barrel outflow projected. In addition, monthly EIA report will provide details on supply trends. There is increasing evidence that swelling US output will undermine OPEC driven supply cut efforts. Given the current macro backdrop we continued to see downside in crude oil prices.
Bitcoin Crypto Bounce
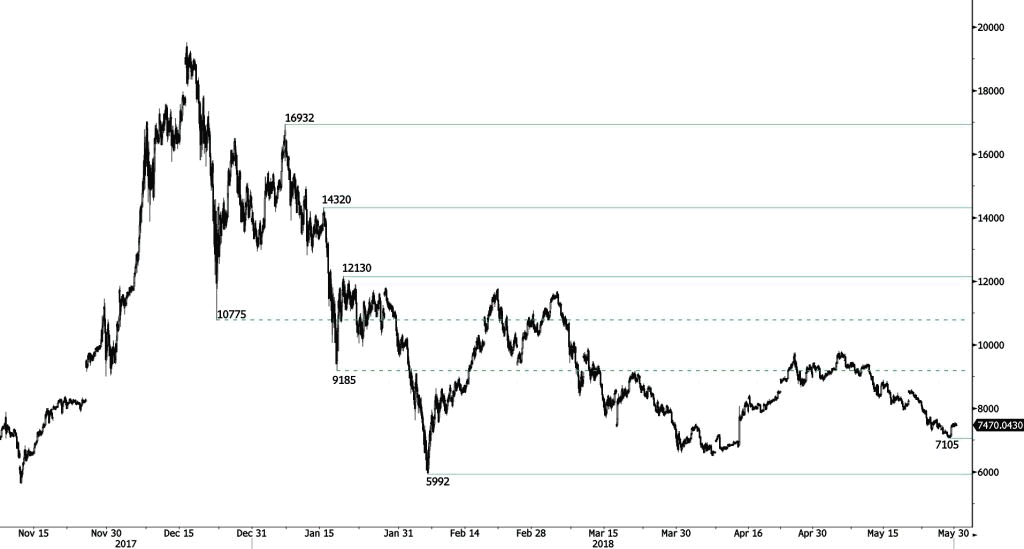
Bitcoin found solid demand on 7105 support. The pair is contained between strong support and resistance given at 6306 (13/11/2017 low) and 10232 (01/02/2018 high). The technical structure suggests short-term decrease.
In the long-term, the digital currency has had an exponential growth but also presented important downturns. There is decent likelihood that the currency could stabilize between 7'000 - 12'000 in 2018. Bitcoin is trading below its 200 DMA (8500 range)..
CRUDE OIL Sideways
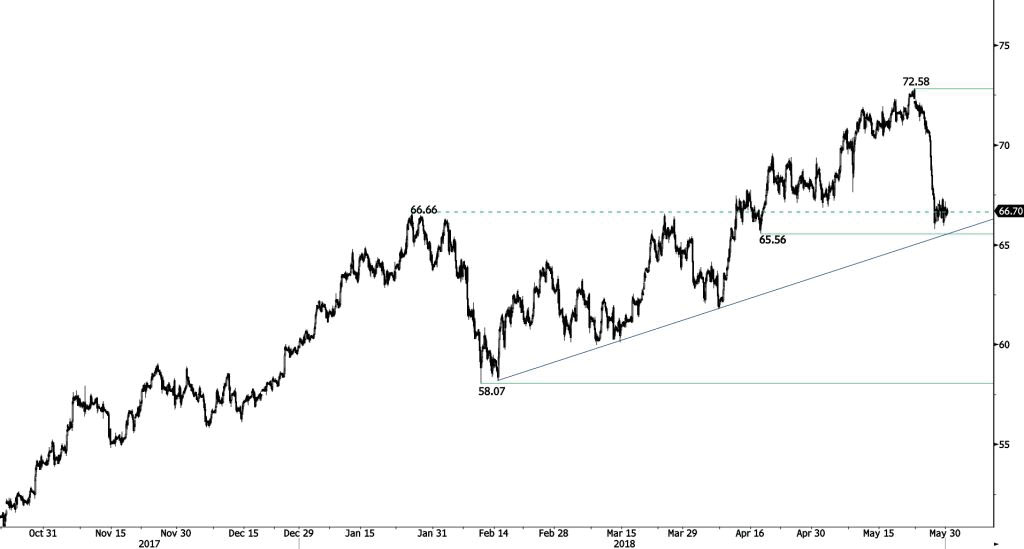
Crude oil is tradign sideways after breaking its support at 66.66 (25/01/2018 high), confirming a strong bearish momentum. Hourly support and resistance are given at 65.56 (17/04/2018 low) and 73.56 (28/11/2014 high). The technical structure suggests further short-term upward moves.
In the long-term, crude oil has recovered after its sharp decline last year. However, we consider that further weakness is very likely. For the time being, the pair lies in an upside trend since June 2017. Support lies at 42.20 (16/11/2016) while resistance is located at 77.83 (20/11/2014). Crude oil is trading largely above its 200 DMA
SILVER Fading Demand
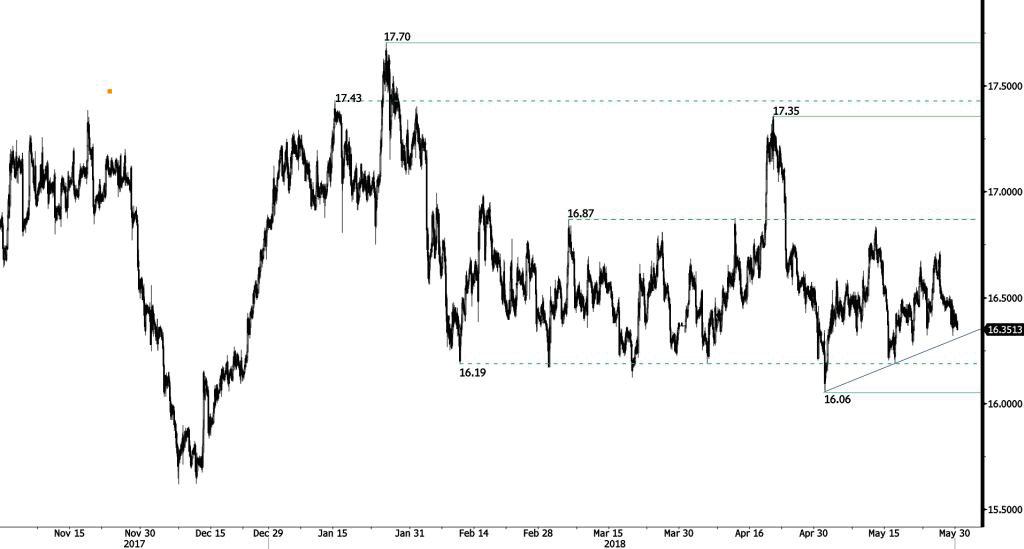
Silver is weakening. However, the short-term succession of higher lows continues to favour a bullish bias as long at uptrend floor holds.. Hourly support and resistance are given at 16.05 (19/12/2017 low) and 16.87 (06/03/2018 high).
In the long-term, the trend remains negative/ sideways. Further downside is very likely. Resistance is located at 21.58 (10/07/2014 high). Strong support can be found at 11.75 (20/04/2009). The pair is trading below its 200 DMA.
GOLD Test Of Downtrend Resistance Successful
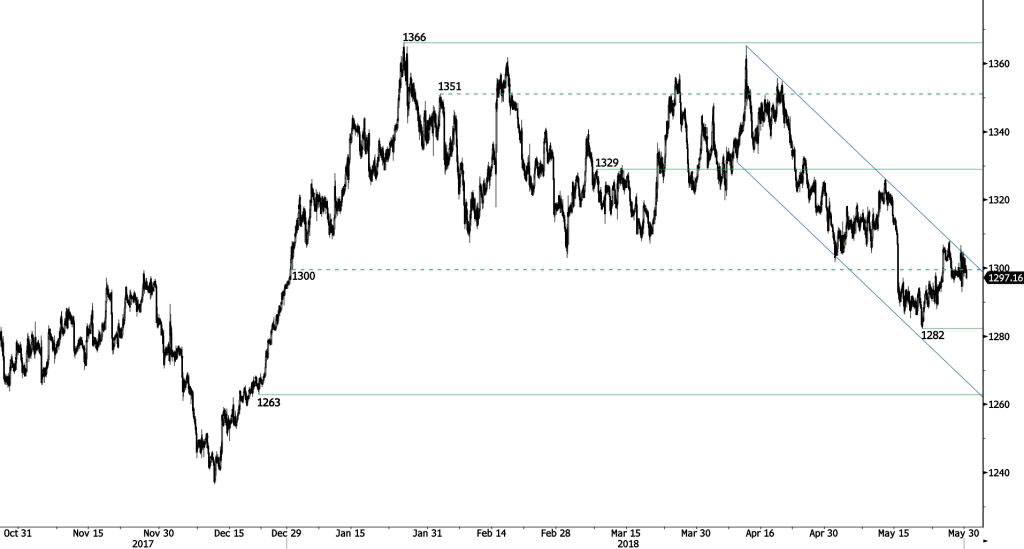
Gold continues to follow downtrend lower. Hourly support and resistance are given at 1263 (21/12/2017 low) and 1329 (08/03/2018 high). The technical structure suggests short-term downward moves.
In the long-term, the technical structure suggests that there is a growing upside momentum. A break of 1'392 (17/03/2014) is required to confirm it. A major support can be found at 1'045 (05/02/2010 low). The pair is trading below its 200 DMA.
EUR/CHF Hard Bounce But Fading
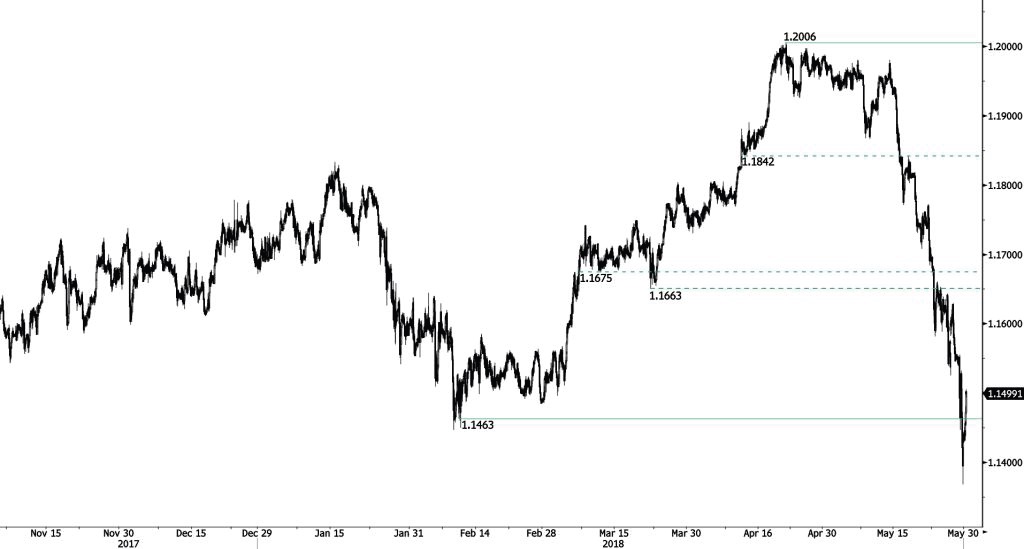
EUR/CHF has made new lows, confirming an underlying bearish trend. Bearish target at 1.1463 was hit, placing the next extension level at 1.1352 (21/08/2017 low). Steep decline puts key resistance at 1.1516 (25/05/2017 low).
In the longer term, the technical structure has reversed. Strong resistance at 1.20 (level before the unpeg) is now at reach. The ECB's slowing QE program is likely to cause buying pressures on the euro, which should weigh in favour of the EUR/CHF. Support and resistance can be found at 1.0624 (24/06/2016 low) and 1.2097 (18/12/2014 high).
EUR/GBP Weak Bounce
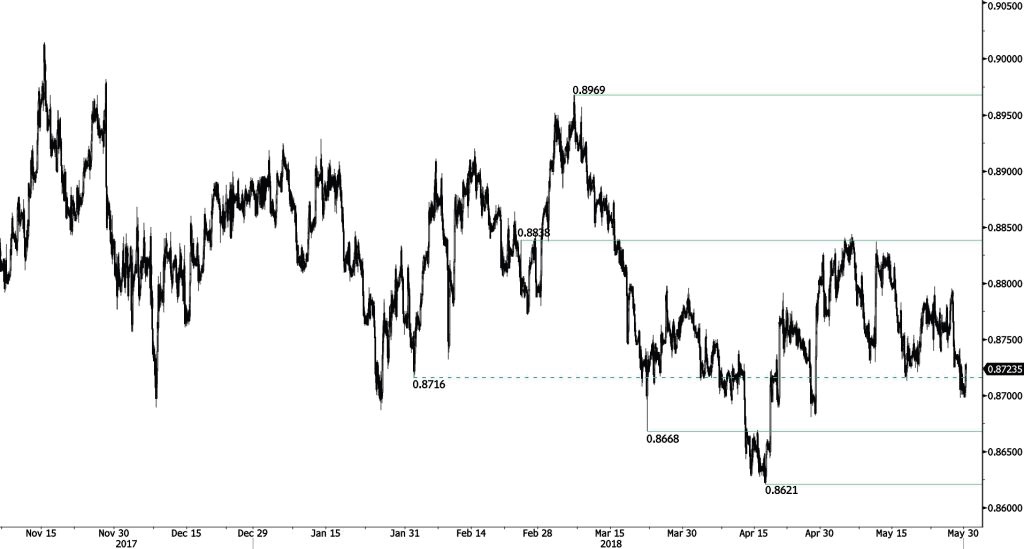
EUR/GBP is testing near downside range. Hourly support and resistance are given at 0.8668 (22/03/2018 low) and 0.8838 (23/02/2018 high). The technical structure suggests shortterm upward moves.
In the long-term, the pair has largely recovered from 2015 lows. The technical structure suggests further upside pressure. Strong resistance can be found at 0.9500 (psychological level) while support remains at 0.8304 (05/12/2016 low). The pair is trading below its 200 DMA.