Sample Category Title
Euro Ticks Higher, German Business Climate Meets Expectations
EUR/USD has posted slight gains in the Friday session, erasing the losses seen on Thursday. Currently, the pair is trading at 1.1705, up 0.23% on the day. On the release front, German Ifo Business Climate ticked higher to 102.2, above the estimate of 102.00 points. In the US, the focus is on durable goods reports. Core durable goods orders is expected to climb to 0.5%, but the markets are braced for a decline of 1.3% from durable good orders. If the latter indicator does record a sharp decline, the dollar could lose ground.
As Italy moves closer establishing a new government, the EU and investors are watching nervously. On Wednesday, President Sergio Mattarella handed a mandate to Giuseppe Conte to form a coalition. Conte is from the Five Star Movement, which plans to govern with the Lega Nord. Both parties are anti-establishment and euro-sceptic. Their platform includes increased deficit spending and a crackdown on immigration, two issues which could put Italy, the third largest economy in Europe, on a collision course with Brussels. Earlier in the week, ECB governing council member Ewald Nowotny admitted that the political situation in Italy had “created a lot of nervousness”, but that the new government would be judged on its actions.
The Federal Reserve released the minutes from its May meeting. In the minutes, some Fed policymakers said they favored removing the phrase that “the stance of monetary policy remains accommodative”. Not surprisingly, the minutes didn’t shed light on the Fed’s plans, saying that another rate hike would occur “soon”, on the assumption that the US economy continues to perform as expected. Still, a quarter-point rate hike in August is virtually a given, with the CME Group setting the odds of a hike at 95 percent. This would mark a second hike in 2018. After that? The Fed projection remains at three rates hikes in 2018, but some analysts are predicting four increases this year.
XAUUSD Analysis – 200SMA Remains Key For Recovery
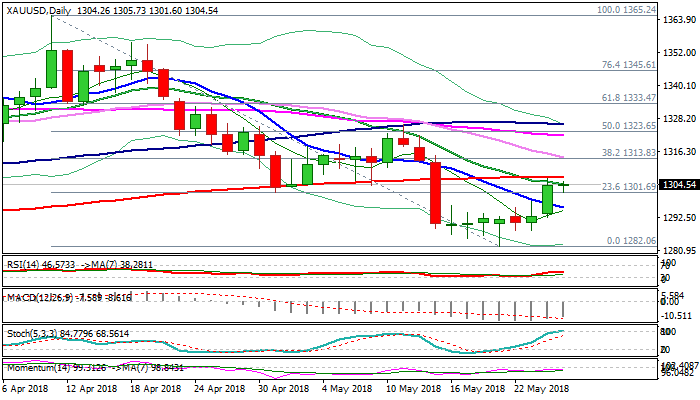
Spot Gold holds within narrow consolidation below new recovery high at $1306 on Friday and maintains firm tone following previous day’s nearly 1% rally.
The yellow metal rose on fresh safe-haven demand on uncertainty over US – North Korea talks and weaker dollar.
Rally was so far capped by 200SMA $1307) and could extend recovery from the base at $1285 zone.
Firm break above 200SMA would expose next pivots at $1314 (Fibo 38.2% of $1365/$1282 descend/falling 30SMA), with strengthening momentum supporting the notion.
On the other side, overbought slow stochastic signals that gold may enter extended consolidation on repeated failure at 200SMA, but needs to hold above psychological $1300 support to maintain bullish bias.
Initial negative signal could be expected on break below $1300 while extension and close below falling 10SMA ($1296) would signal. Lower top and risk of further weakness.
Res: 1307, 1309, 1314, 1322
Sup: 1300, 1296, 1292, 1287
WTI Oil Outlook – Bears Pressure $70 Support And Risk Deeper Fall
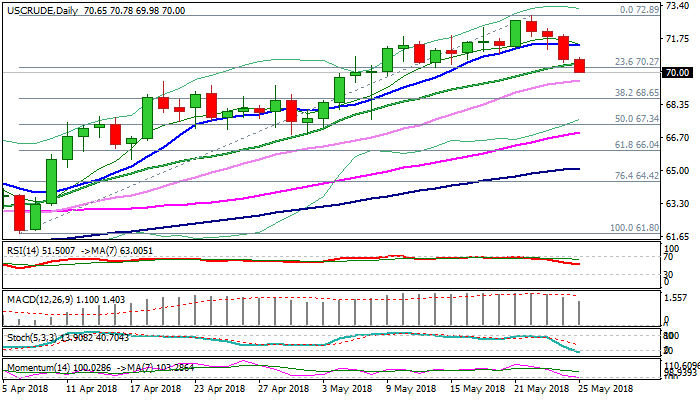
WTI oil remains continues to move lower for the fourth straight day and pressures psychological support at $70 on Friday.
Fresh extension of pullback from $72.89 high which generated initial bearish signal on close below 10SMA on Thursday, broke below 20SMA ($70.45), weekly close below which would generate another negative signal.
Oil price came under pressure on growing concerns over global output as OPEC and Russia signaled they could start easing restrictions on oil production as soon as June, if they see the oil market is balancing.
In addition, comments from the White House that oil prices were too high, contributed to the pressure.
This is forming negative environment for the oil price which could result in further weakening of oil prices.
Extension below $70 handle and violation of 30SMA ($69.59) would risk extension towards next pivotal support at $68.65 (Fibo 38.2% of $61.80/$72.89).
Daily 10/20SMA’s turned to bearish setup and 14-d momentum enters negative territory, maintaining bearish pressure.
Broken 10SMA ($71.40) marks solid resistance which is expected to cap and maintain bearish bias.
Res: 70.45, 70.78, 71.38, 71.96
Sup: 70.00, 69.59, 69.00, 68.65
EMs Struggles To Recover, USD Consolidates
Importance of the next US Federal Open Market Committee Meeting
The US Federal Open Market Committee 12-13 June meeting will be critical. Not only will there be a decision on policy strategy, but Summary of Economic Projections and a press conference by Fed Chair Powell. It's universally expected the Fed will hike rates by 25bp at this meeting, to be followed by two additional hikes in September, bringing the total for 2018 to three. In light of US economic outperformance, after a slow 1Q, there's been a growing expectation of tighter monetary policy. In response, US yields have rallied with 10-year yields climbing above 3.0%, with the USD benefiting from the higher interest rate. Yet, in recent meeting minutes, the Fed gave no indication that they would increase the pace of tightening. Instead they indicate a willingness to allow the inflation rate to rise above 2% for a "temporary period," while the economy continues to grow.
Bitcoin Bouncing
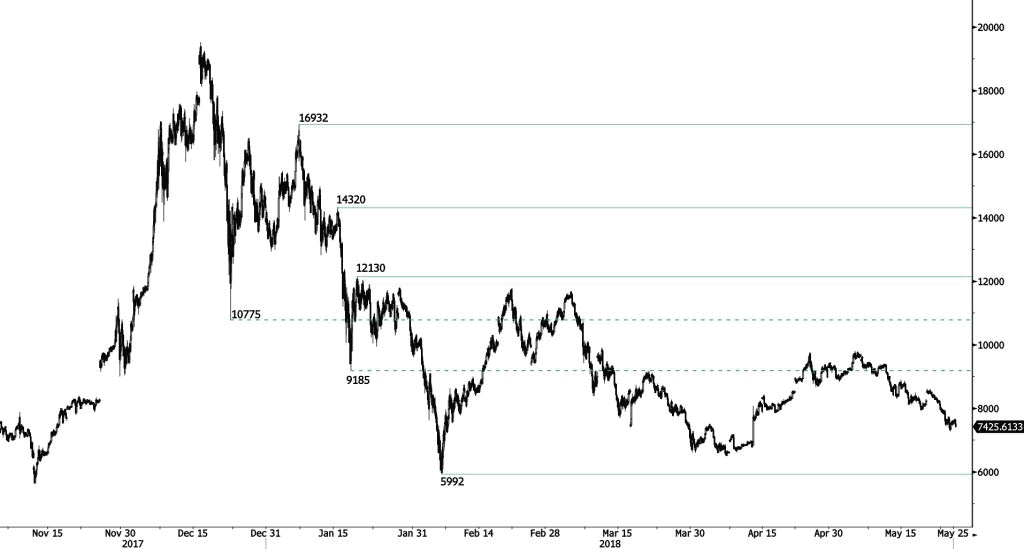
Bitcoin bullish momentum quickly faded suggesting persistent selling pressure. The pair is contained between strong support and resistance given at 6306 (13/11/2017 low) and 10232 (01/02/2018 high). The technical structure suggests short-term decrease.
In the long-term, the digital currency has had an exponential growth but also presented important downturns. There is decent likelihood that the currency could stabilize between 7'000 - 12'000 in 2018. Bitcoin is trading below its 200 DMA (8500 range).
CRUDE OIL Bullish Pause
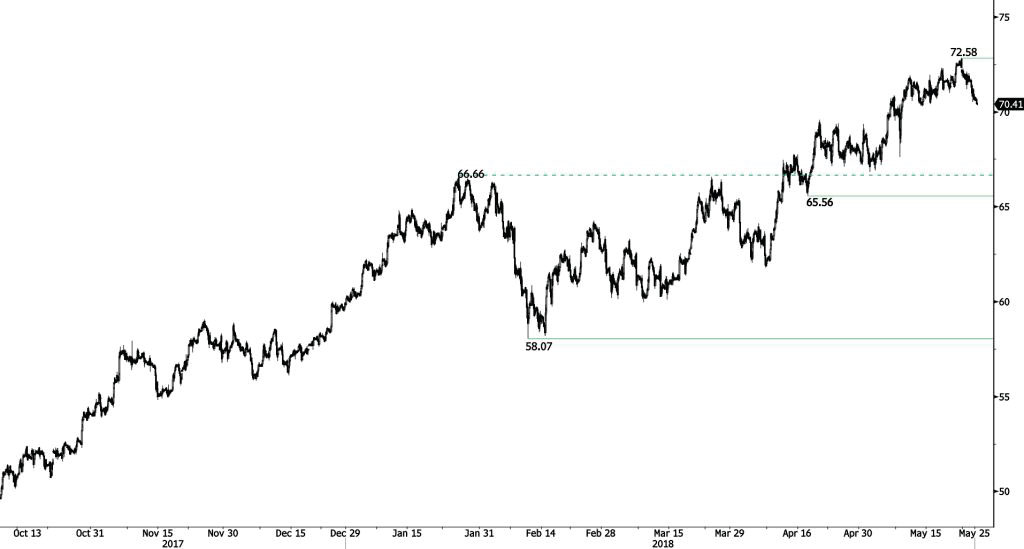
Crude oil has erased most of the gains made this month indicating persistent selling pressures. Yet the bullish pattern started in mid- February 2018 is strengthens. Hourly support and resistance are given at 65.56 (17/04/2018 low) and 73.56 (28/11/2014 high). The technical structure suggests further short-term upward moves.
In the long-term, crude oil has recovered after its sharp decline last year. However, we consider that further weakness is very likely. For the time being, the pair lies in an upside trend since June 2017. Support lies at 42.20 (16/11/2016) while resistance is located at 77.83 (20/11/2014). Crude oil is trading largely above its 200 DMA.
SILVER Mild Bullish Bounce
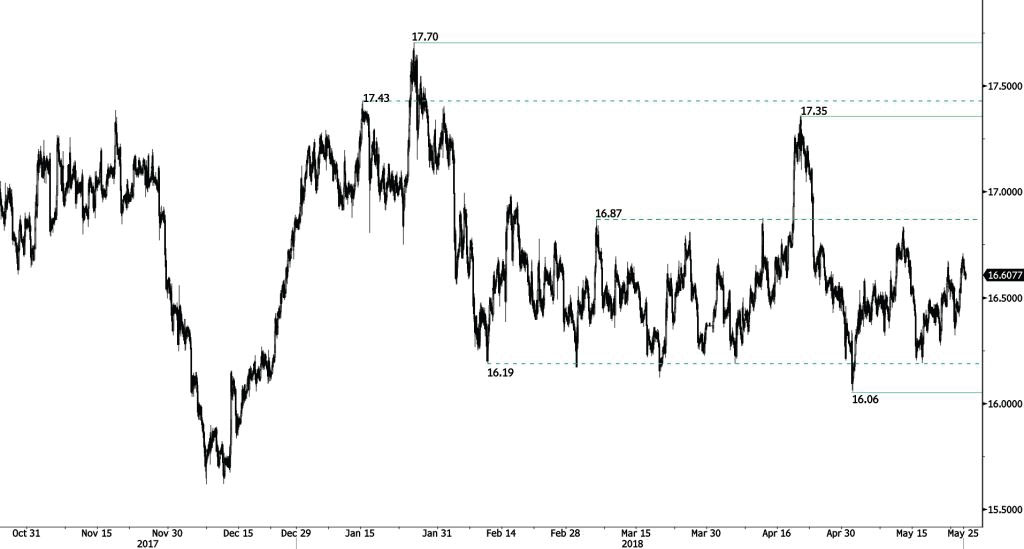
Silver has improved and is now close to the key resistance at 16.87. Hourly support and resistance are given at 16.05 (19/12/2017 low) and 16.87 (06/03/2018 high). The technical structure suggests short-term decrease.
In the long-term, the trend remains negative/ sideways. Further downside is very likely. Resistance is located at 21.58 (10/07/2014 high). Strong support can be found at 11.75 (20/04/2009). The pair is trading below its 200 DMA.
GOLD Strong Bounce
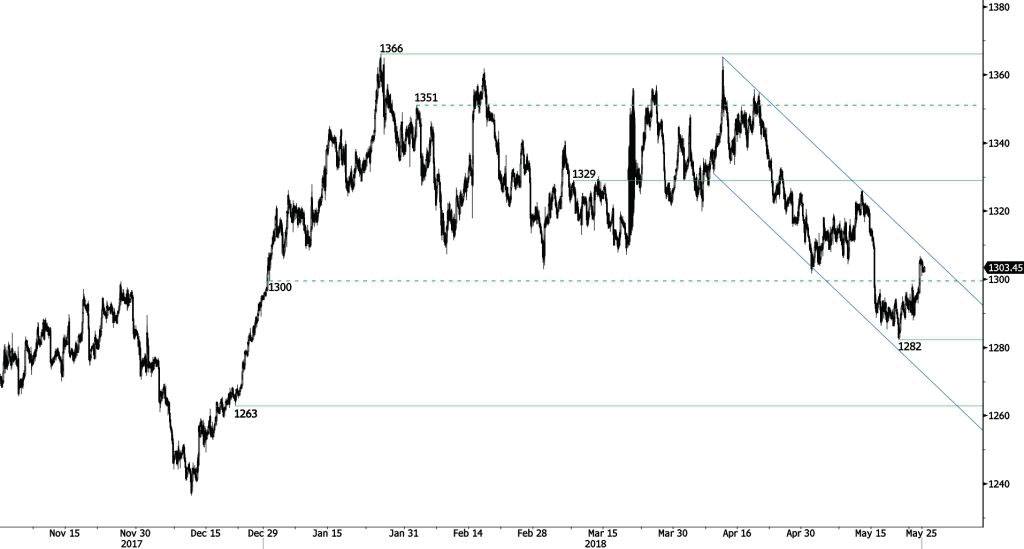
Gold has broken the hourly resistance at 1300 indicating a persistent short-term buying interest. Hourly support and resistance are given at 1263 (21/12/2017 low) and 1329 (08/03/2018 high). The technical structure suggests shortterm downward moves.
In the long-term, the technical structure suggests that there is a growing upside momentum. A break of 1'392 (17/03/2014) is required to confirm it. A major support can be found at 1'045 (05/02/2010 low). The pair is trading below its 200 DMA.
EUR/CHF Approaching The Support At 119.30
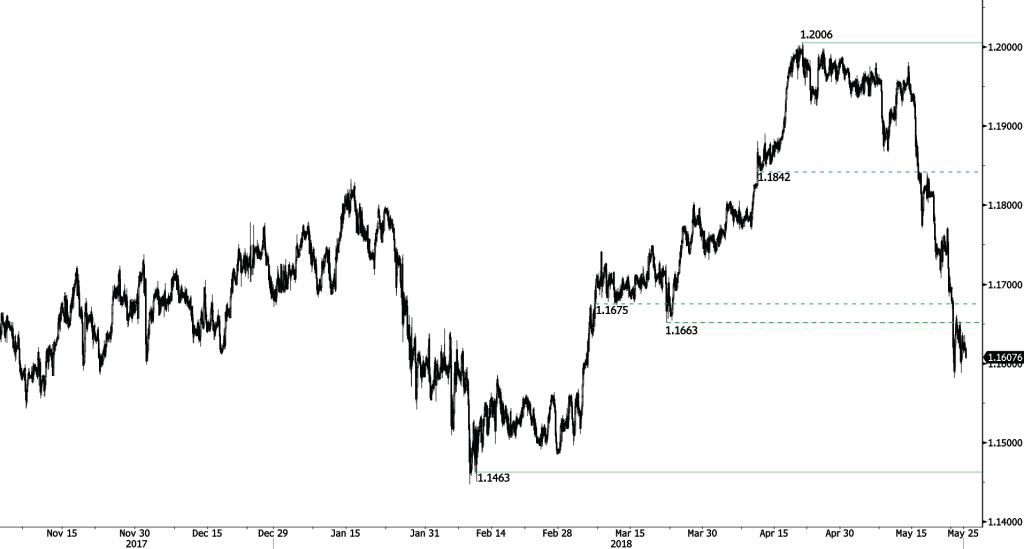
EUR/CHF continues to weaken after the breach of the key support at 1.1581 (23/05/2018 low), confirming increasing selling pressures. Break of support would suggest extension of bearish pressure to key support at 1.1463.
In the longer term, the technical structure has reversed. Strong resistance at 1.20 (level before the unpeg) is now at reach. The ECB's slowing QE program is likely to cause buying pressures on the euro, which should weigh in favour of the EUR/CHF. Support and resistance can be found at 1.0624 (24/06/2016 low) and 1.2097 (18/12/2014 high).
EUR/GBP Consolidation
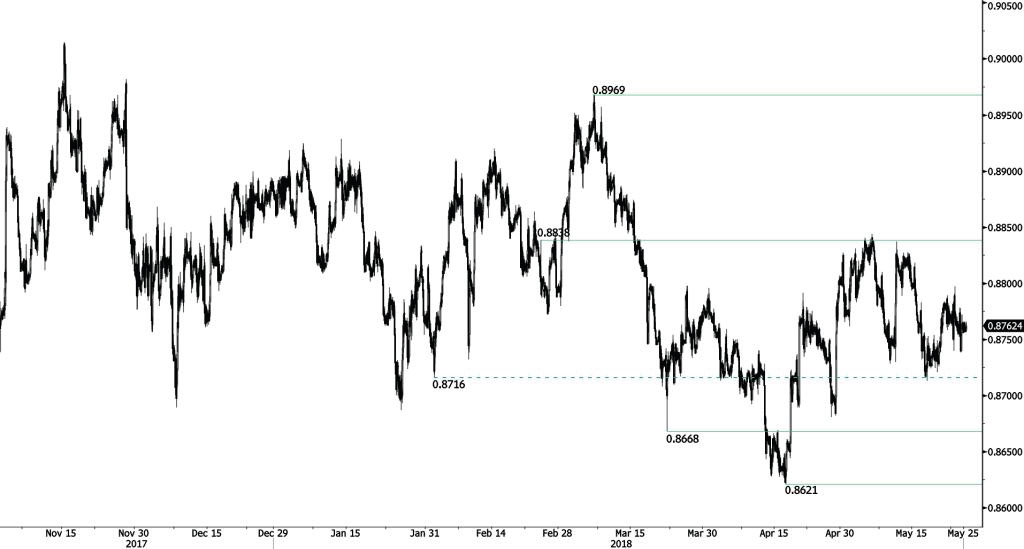
EUR/GBP weakness has shifted into a consolidation pattern. Hourly support and resistance are given at 0.8668 (22/03/2018 low) and 0.8838 (23/02/2018 high). The technical structure suggests short-term upward moves.
In the long-term, the pair has largely recovered from 2015 lows. The technical structure suggests further upside pressure. Strong resistance can be found at 0.9500 (psychological level) while support remains at 0.8304 (05/12/2016 low). The pair is trading below its 200 DMA.