Sample Category Title
Weekly Economic and Financial Commentary: Global Economy Shows Mixed Results at the Start of Q2
Weekly Economic and Financial Commentary
U.S. Review
April Showers on U.S. Home Sales
- New and existing home sales each declined in April. New home sales are up 8.4 percent year-to-date as demand remains solid. The average time for homes on the market has declined by three days compared to last year. Rising mortgage rates and home prices could test buyer resolve, however.
- Durable goods orders disappointed the consensus, falling a greater-than-expected 1.7 percent. A pullback in aircraft orders was the main drag, as core orders rose 0.9 percent. Consumer sentiment fell again in May, but overall consumers remain upbeat about economic conditions.
April Showers on U.S. Home Sales
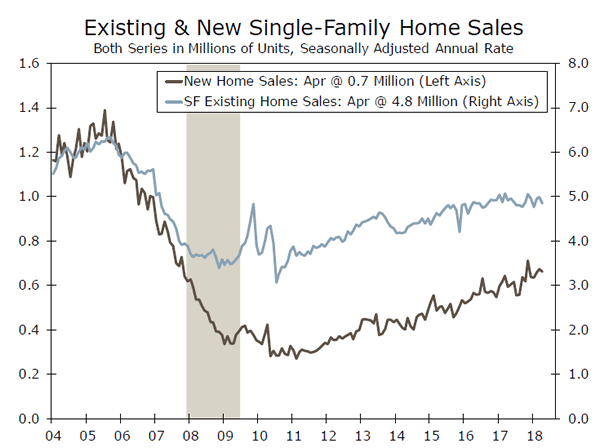
New home sales declined 1.5 percent in April, dropping to an annual pace of 662,000 units. This was better than the consensus estimate of a 2.1 percent decline; however, March new home sales were revised downward to a 2.0 percent monthly gain from a first reported 4.0 percent rise. New home sales are now 8.4 percent higher year-to-date than this time last year. Sales of new homes that have not yet been started jumped 40,000 units in April, the largest jump in five months, to 221,000 units. This increase in sales of homes not yet started points to strength in housing starts in the months ahead. New home sales are off to a solid start in 2018 behind consistently strong demand due to solid job and income growth. While consumers are eager to buy new homes, rising mortgage rates and home prices will likely serve as a headwind to sales of new homes this year.
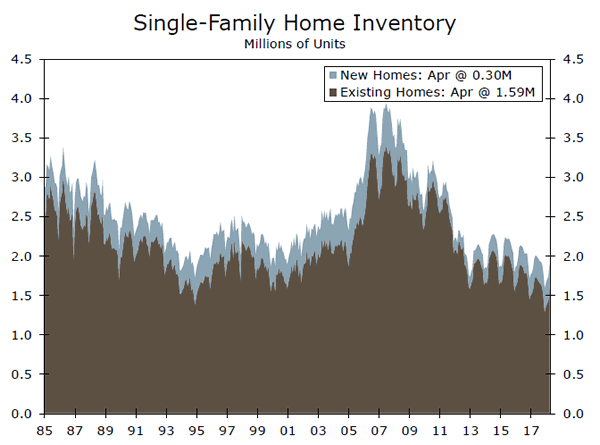
Existing home sales also dropped in April, slipping 2.5 percent to a 5.46-million unit annual pace. The pace of existing home sales came in lower than the 5.55-million unit annual pace expected by the consensus. The entirety of the drop came from a slowdown in single-family homes, which were down 3.0 percent on the month, while condos and co-ops picked up by 1.6 percent. The typical home for sale was on the market for just 26 days before being sold in April, down from 29 days a year ago. Homes are selling quickly, which is capping inventory growth. Prices also continue to rise along with mortgage rates, which could dampen demand and price potential buyers out of the market.
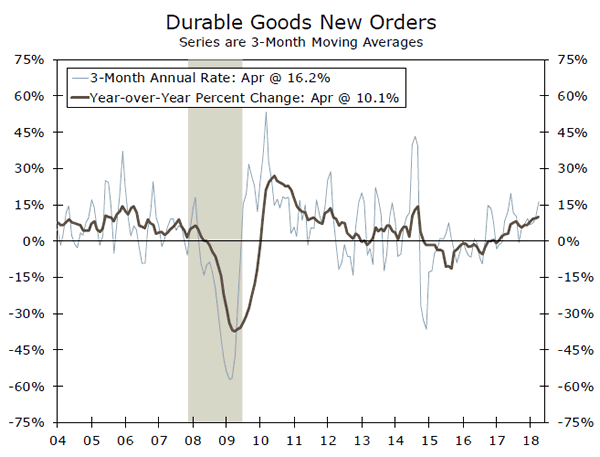
Durable goods orders retraced in April following consecutive months of gains. Orders fell 1.7 percent on the month, which was worse than consensus, but more in line with our call for a 2.0 percent drop. Transportation orders fell 6.1 percent as aircraft orders declined a whopping 29 percent. Transportation spending has been a key driver of fixed investment, and backlogs in the sector are rising, which bodes well for future transportation spending. Core capital goods orders, which exclude defense and aircraft orders, rose a solid 0.9 percent on the month. Purchasing manager surveys indicate sustained growth throughout all regions in May, and we expect that the gap between the soft and hard data will converge in coming months.
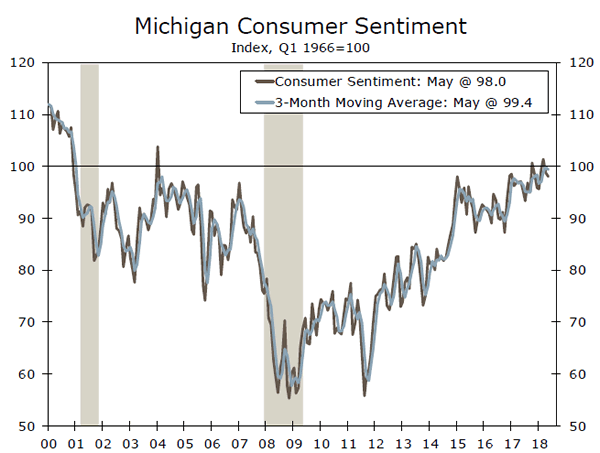
Consumer sentiment fell once again in May according to the University of Michigan; however, high overall levels of consumer sentiment since the presidential election are consistent with improving economic growth and consumer spending figures. Current economic conditions were responsible for the entirety of the drop in May, driven by rising gasoline prices. Consumers expecting gas prices to rise over the next year jumped 15 points. Consumers are also concerned about household finances as the run-up of asset prices could be reaching their peak in their view. The outlook on business conditions is still generally positive, up 7 points compared to a year ago. Plans for major household appliance and vehicle purchases each dropped. Housing purchase plans continued falling, likely reflecting concern behind rising prices and rates.
U.S. Outlook
Personal Spending • Thursday
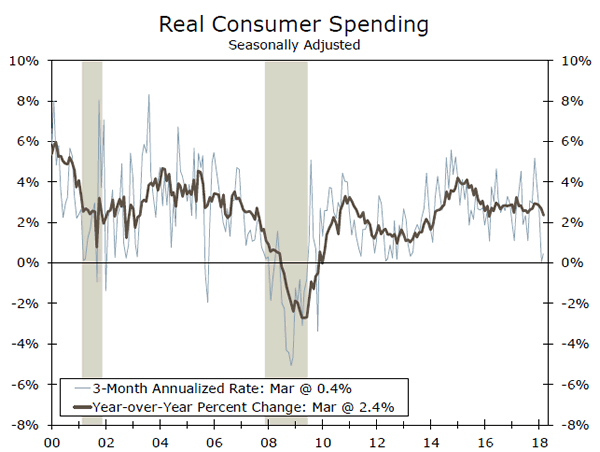
Consumption growth began the year on a soft note in Q1, growing just 1.1 percent annualized. That said, March personal spending data showed that the quarter ended fairly strong with growth climbing 0.4 percent on a month-over-month basis. Looking ahead to April, we expect effects from the tax cuts to start providing greater support to disposable income growth and thus boost spending. April retail sales rose 0.3 percent following a robust 0.8 percent month-overmonth rise in March. We estimate that personal spending will rise 0.4 percent for April. In total we are forecasting real consumer spending to rise 2.9 percent annualized in the second quarter and remain robust through the end of the year. Taking into consideration our outlook for inflation, one of the main risks to our consumption outlook remains a potential erosion of purchasing power due to higher prices.
Previous: 0.4% Wells Fargo: 0.4% Consensus: 0.4% (Month-over-Month)
ISM Manufacturing • Friday
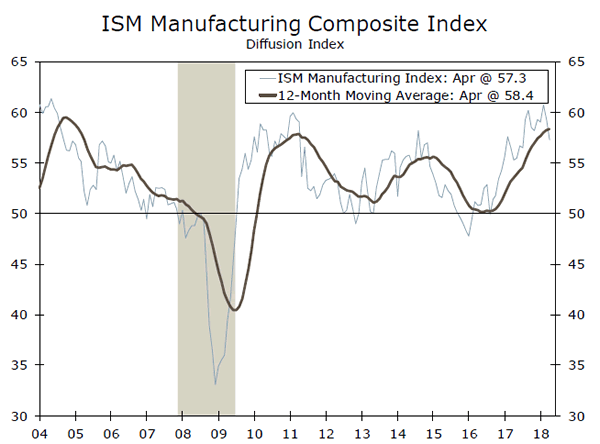
Manufacturing activity as measured by purchasing managers' responses to the ISM manufacturing survey pulled back slightly in April but remained high at 57.3. The more forward-looking new orders component remained relatively unchanged at 61.2 for the month, while the employment component tumbled over the month to 54.2. One of the areas that we have been watching closely has been the prices paid component which has climbed to 79.3 from 68.3 back in December. The consistent price pressures reported by purchasing managers is in-line with our view for continued upward price pressure through the end of this year. We look for the ISM manufacturing index to rebound slightly, rising to 57.5 in May. With global demand improving and domestic demand remaining robust, the outlook for manufacturing remains positive over the next several quarters.
Previous: 57.3 Wells Fargo: 57.5 Consensus: 58.0
Employment • Friday
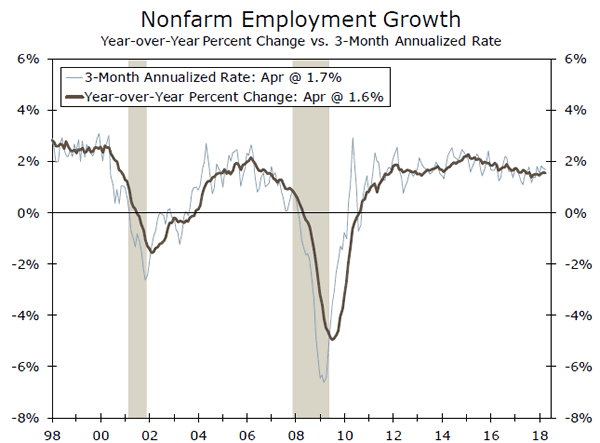
Nonfarm employment rose by a disappointing 164,000 in April to start the second quarter, but the unemployment rate still fell to 3.9 percent. Job gains remained broad-based with the exception of wholesale trade and government. The focus remains on average hourly earnings for signs of inflation pressures. The earnings measure was up 2.6 percent on a year-over-year basis as of April. For May's nonfarm print we suspect that 180,000 jobs were added for the month, and the unemployment rate is likely to remain stable at 3.9 percent. We expect the pace of job growth to gradually decelerate as the year progresses and the labor market continues to tighten. After averaging 212,000 jobs per month in the first quarter, we see the pace of job gains downshifting to around 170,000 in the second and third quarters. Another byproduct of the tighter labor market conditions should be higher average hourly earnings in the coming months.
Previous: 164K Wells Fargo: 180K Consensus: 190K
Global Review
Global Economy Shows Mixed Results at the Start of Q2
- According to recently released data, Q2 started with mixed results after a relatively weak first quarter. Although data on consumption seem to have picked up a bit at the start of Q2, data on production seemed to have continued to weaken from the highs seen at the end of 2017.
- U.K. retail sales increased 1.6 percent sequentially in April, the strongest monthly print since the 2.5 percent increase recorded in April of last year. In the Eurozone, the manufacturing sector continued the weakening trend it has shown since December 2017 as the Markit/BME manufacturing PMI printed 55.5 in May compared to 56.2 in April.
Global Economy Shows Mixed Results at the Start of Q2
According to recently released data, the second quarter started with mixed results after a relatively weak first quarter. Although data on consumption seem to have picked up a bit at the start of Q2, data on production seemed to have continued to weaken from the highs seen at the end of 2017.
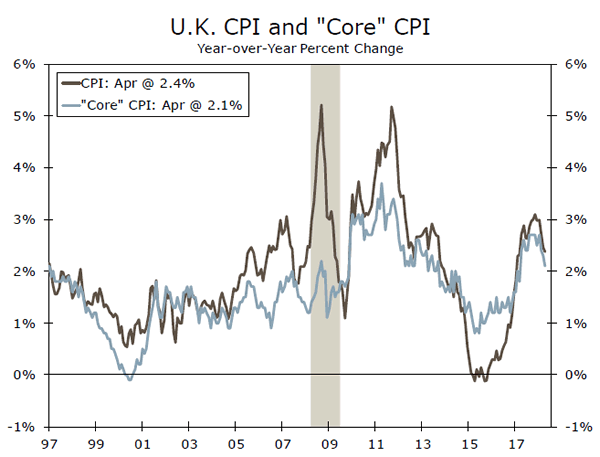
Consumer prices in the U.K. increased a less-than-expected 0.4 percent in April, but they were up compared to an increase of 0.1 percent in the previous month. However, the year-over-year rate came in a bit lower than expected, at 2.4 percent versus 2.5 percent for the year ending in March. The core CPI was also lower than expected, up 2.1 percent on a year-earlier basis compared to 2.3 percent for the year ending in March. Both measures point to continued disinflation after CPI inflation hit a year-over-year high of 3.1 percent in November of last year. This will probably give pause to some of the speculation regarding the Bank of England needing to start increasing rates sooner rather than later.
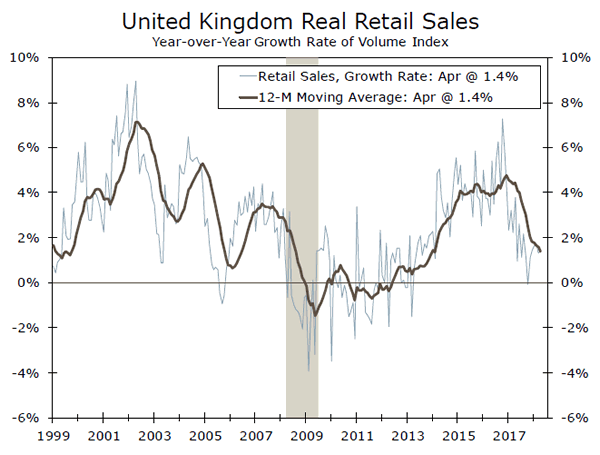
On the other hand, retail sales in the U.K. increased 1.6 percent sequentially in April, the strongest monthly print since the 2.5 percent increase recorded in April of last year. Meanwhile, the detailed demand-side data on Q1 GDP showed a relatively weak economy in Q1, but for the same reasons as in Germany (see below). The external sector was weak, while private consumption was a bit stronger, up 0.2 percent versus expectations of a 0.1 percent increase, sequentially and not annualized.
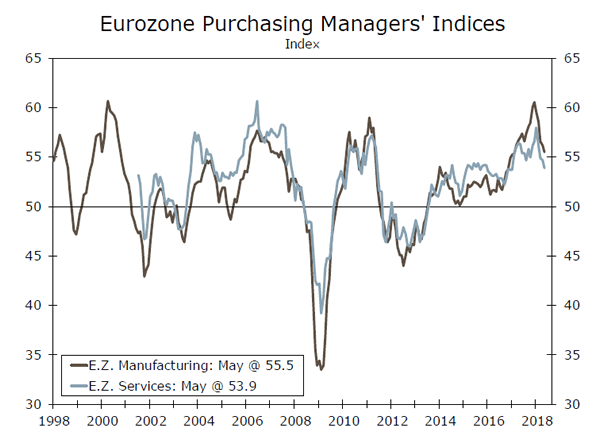
In the Eurozone, the manufacturing sector continued the weakening trend it has shown since December 2017, as the Markit/BME manufacturing PMI printed 55.5 in May compared to 56.2 in April. Meanwhile, the German manufacturing PMI was down more than the Eurozone aggregate in May, down to 56.8 compared to 58.1 in April. Furthermore, detailed demandside GDP numbers were released for Germany in Q1 showing a relatively strong consumer compared to expectations, up 0.4 percent not annualized, while government spending was down a larger-than-expected 0.5 percent and capital investment up a more-than-expected 1.7 percent, sequentially. The weakest sector during Q1 was the external sector, with real exports of goods and services declining 1.0 percent while imports of goods and services declined 1.1 percent. Meanwhile, Germany's GfK consumer confidence index for June weakened a bit, from 10.8 to 10.7 in May, while the IFO index came in mixed. The business climate index was flat in May at 102.2; the expectations index was slightly lower, 98.5 compared to 98.7 in April, while the current assessments index was up 106.0 compared to 105.8 in April.
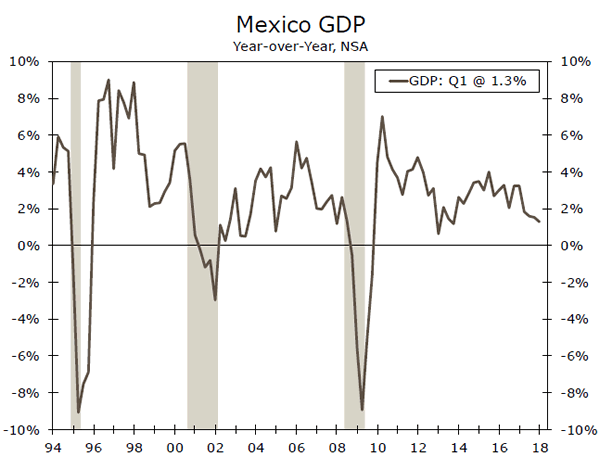
In Mexico, revised data for Q1 GDP showed a weak economy on a year-earlier basis, not seasonally adjusted, up 1.3 percent, while up a relatively strong 1.1 percent sequentially and not annualized. As we argued before in previous reports, there is lots of noise in this release due to the difference in occurrence of the Easter season compared to last year. However, what is clear from the information on Q1 is that domestic consumption continues to drive economic growth while the industrial sector remains relatively weak.
Global Outlook
Bank of Canada Policy Meeting • Wednesday
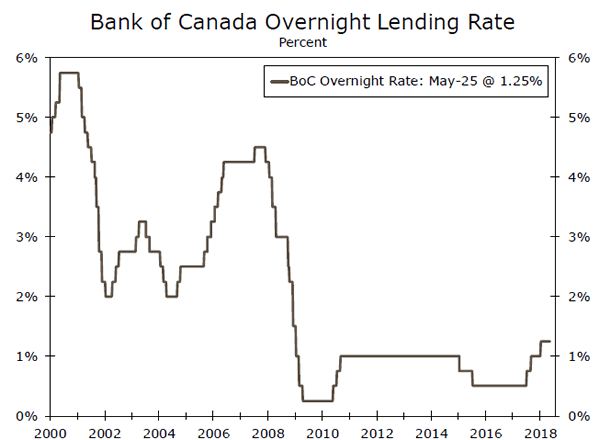
The Bank of Canada holds a regularly-scheduled policy meeting on Wednesday. After hiking rates in January, the BoC subsequently remained on hold in March and April and we, and most other analysts, expect that the BoC will keep policy unchanged again on Wednesday. Policymakers did not express any particular urgency to raise rates in the statement they released after the last policy meeting in April, although they did seem to indicate that further tightening will be appropriate later. Indeed, we look for the BoC to raise rates again in the third quarter.
Canada will release GDP data for the first quarter on Thursday. Real GDP rose at an annualized rate of 1.7 percent in Q4-2017, and we project that the economy grew at a roughly similar rate in Q1. Rates remain low in a historical context, and we believe that the BoC will eventually need to tighten further to return rates to a more "neutral" (i.e., neither stimulating nor restraining the economy) setting.
Previous: 1.25% Wells Fargo: 1.25% Consensus: 1.25%
Japan Industrial Production • Thursday
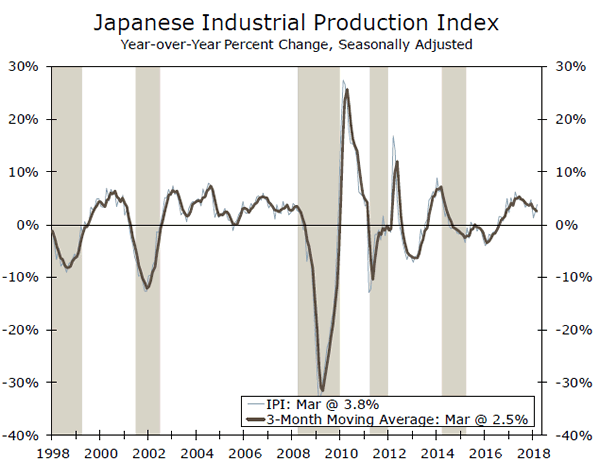
Real GDP in Japan edged down at an annualized rate of 0.6 percent in Q1-2018, the first contraction on a sequential basis in more than two years. Some of the decline in real GDP reflects the 5.3 percent nosedive in industrial production (IP) that occurred during the quarter. IP ended the quarter on a strong note, however, and most analysts look for IP to post another strong rise in April. If it does, then the recent momentum in IP should go a long way toward returning overall GDP growth to positive territory in Q2.
We will get more information on Tuesday through Thursday about the current state of the Japanese economy via April data on retail spending, unemployment and construction orders. Even if growth returns to positive territory, however, Japan is not likely to experience meaningful inflation anytime soon, which should induce the Bank of Japan to refrain from tightening policy.
Previous: 1.4% Consensus: 1.4% (Month-over-Month)
Eurozone CPI Inflation • Thursday
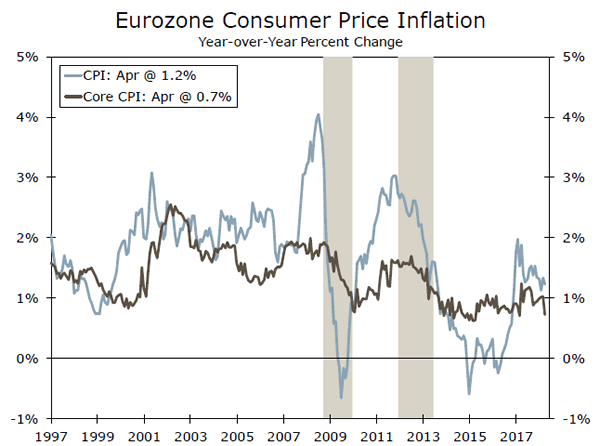
The European Central Bank attempts to keep CPI inflation "below, but close to, 2 percent over the medium term." However, inflation has generally been well below the ECB's target since early 2013. The overall CPI inflation rate was only 1.2 percent in April; preliminary data that will be released on Thursday likely will show that inflation has remained below target in May. Although the recent rise in gasoline prices likely will push up the overall rate of inflation in coming months, the "core" rate of inflation probably will not move significantly higher anytime soon.
There are also some indicators of real economic activity on the docket next week. Germany will release retail spending data in April at some point during the week, and the labor market report will print on Wednesday. In France, data on consumer spending in April are slated for release on Wednesday.
Previous: 1.2% Consensus: 1.6% (Year-over-Year)
Point of View
Interest Rate Watch
Fed Minutes: Something for Everyone
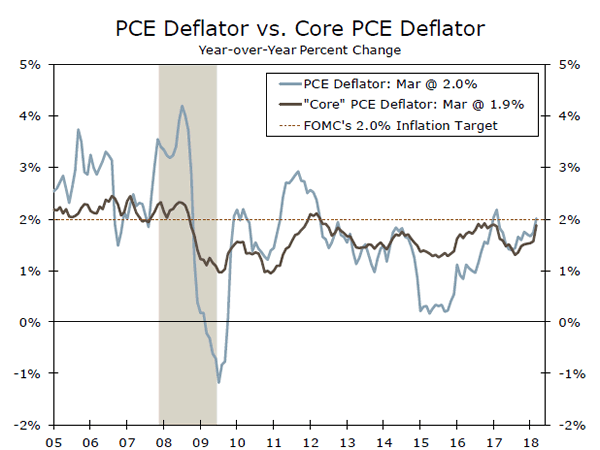
The minutes from the May FOMC meeting, which were released on Wednesday, had a little bit of something for everyone. For the hawks, the use of the word "soon" in reference to the next tightening move suggests a June rate hike is a lock. For the doves, committee members once again signaled their willingness to let inflation drift a bit above 2 percent, even suggesting that allowing it to do so "could be helpful in anchoring longer-run inflation expectations at a level consistent with that objective [2 percent inflation]." Trade war concerns were top of mind for some participants as a potential risk to the outlook.
IOER: Getting Technical
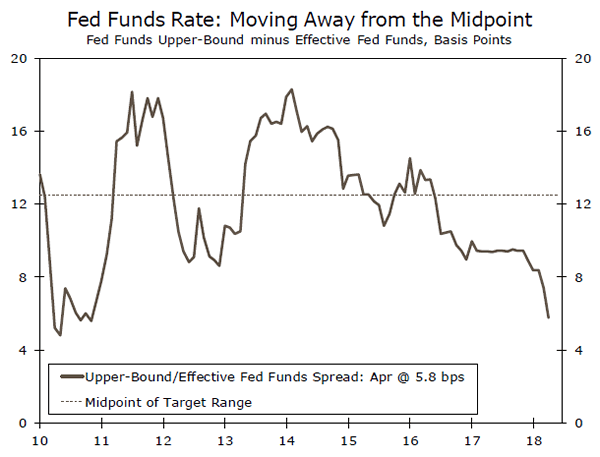
Perhaps the most intriguing development in the minutes was the suggestion that at some point in the near future the Fed might not hike the rate paid on interest on excess reserves (IOER) one-for-one with the fed funds rate. Currently, the Fed sets IOER in line with the upper bound of the fed funds target range. By paying IOER, the Fed effectively creates a floor under short-term interest rates, as lenders have little incentive to lend excess reserves in the fed funds market at a rate much below IOER.
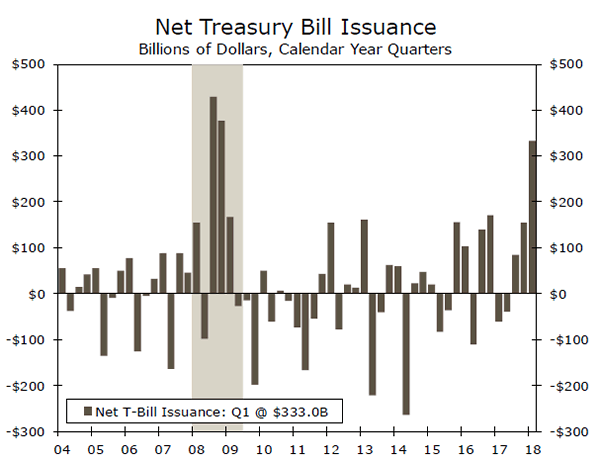
Recently, however, the effective fed funds rate (which should sit roughly between the lower and upper-bound of the target range) has moved ever closer toward the upperbound of the range (middle chart). Without delving too deeply into the weeds, the main culprit seems to have been the surge in short-term government borrowing that occurred to start the year (bottom chart).
From an economic standpoint, this move by the FOMC is more of a technical adjustment than a material change to monetary policy. More broadly, however, this tweak hints at a much deeper question the Fed faces in the years ahead. As balance sheet normalization continues, will the Fed eventually return to the pre-crisis method of implementing monetary policy through minimal excess reserves and open market operations? Or will the Fed stick to its current method of maintaining a historically large balance sheet and utilizing IOER to influence shortterm interest rates? Only time will tell.
Credit Market Insights
Bank Assets Show Stable Conditions
The Federal Reserve's H.8 release, which estimates the assets and liabilities of commercial banks in the United States, showed steady credit growth in April. After starting the year at a relatively slow pace, total bank credit was up at an annualized rate of 2.9 percent last month.
Much of the gain had been fostered by stronger growth in commercial and industrial (C&I) loans. C&I loans rose 14 percent in April, on an annualized basis, which was the fastest print since March 2015. As companies typically borrow to meet future demand, we would expect that businesses are optimistic about future consumer appetites. Similarly, financial conditions appear to remain supportive of business spending, as the Fed's, separately released, Senior Loan Officer Opinion Survey shows banks on net easing standards on business loans over the past year.
The consumer segment also added to bank credit growth in April, with credit cards and other revolving plans up 4.8 percent, annualized. While income gains remain subdued, we expect this sector of borrowing to continue to rise in coming months, as consumers utilize alternative means to fund their spending habits. These conditions favor our outlook of a rebound in personal consumption in the second quarter, after temporary weakness experienced in the first.
Overall, bank credit growth remains stable, as it appears businesses and consumers are continuing to fuel this expansion.
Topic of the Week
Treasury Financing: A Tough Road Ahead
On April 9, the Congressional Budget Office (CBO) released its annual Budget and Economic Outlook, stepping through its projections for the economy, the federal budget and the deficit outlook for the next 10 years. Much of the recent attention has been on the short-term challenges in Treasury financing, but CBO's report highlights that the long-run outlook remains grim.
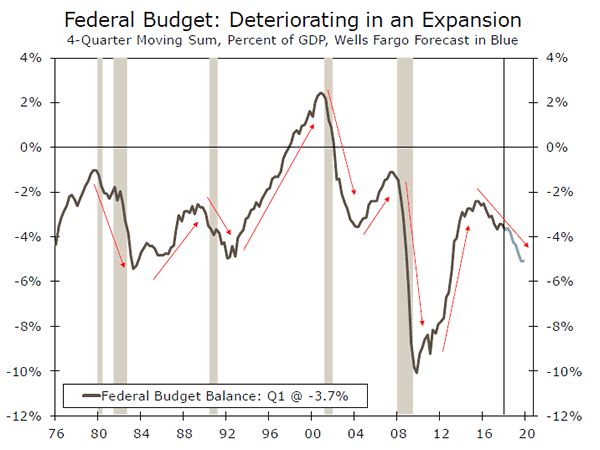
Despite stronger predicted economic growth in the short term, a combination of tax cuts and surging spending have led the budget deficit to widen as a share of GDP, with more deterioration expected over the next year or two. This pattern is historically unusual, as budget deficits typically expand during recession, gradually close during the recoveries and then begin widening again at the next onset of economic weakness (top chart).
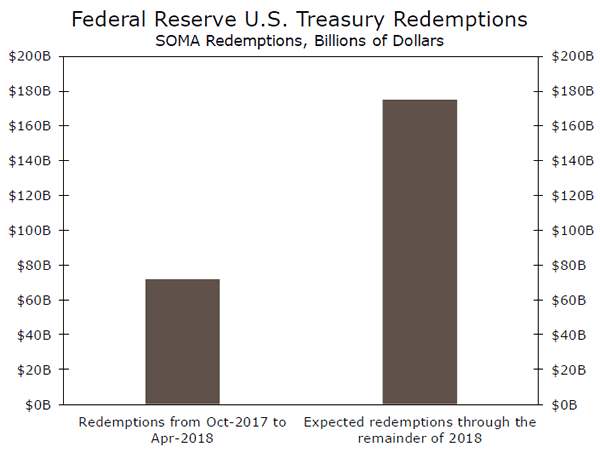
Over the long run, swelling mandatory outlays and mounting interest payments are expected to outpace future revenue gains, thus widening the federal deficit. CBO expects that mandatory spending, which includes outlays for the major healthcare programs and Social Security, will eclipse 64 percent of total federal spending by 2028. This grim fiscal outlook is playing out as the Fed normalizes its balance sheet, requiring the Treasury to issue even more debt to the public (bottom chart).
In the wake of CBO's report, the yield on the 10-year Treasury climbed 35 bps, reaching a high of 3.11 percent on May 17 before receding back to about 2.93 percent as of today. To what extent the run up in the 10-year Treasury has been attributable to CBO's report is difficult to quantify. However, concerns about widening deficits are certainly playing a role in rising yields, and with the story unlikely to change in the near future, we continue to believe interest rates will continue rising the remainder of the year. The challenges associated with debt financing are a reminder that first order effects on the economy from a policy move (e.g. a boost to growth from tax cuts) can be partially offset by second and third order fallout (e.g. growth challenges from higher interest rates).
ECB Research – In the mind of Draghi
Being ECB President Mario Draghi these days may not be as easy as in previous years. The monetary policy blueprint has been laid out years ahead ever since the crisis started and we are now approaching a focal time when markets firmly expect the end of APP. At the same time, growth dynamics are moderating, the economy is hitting capacity constraints, inflation is disappointing and a new (potentially) unknown factor in Italy makes Draghi's job more challenging. We outline some of the current challenges below.
Weaker data - growth/capacity constraints
Data has been surprisingly week in the euro area over the past two months. The surprise index is still close to its (negative) two standard deviations level. We see increasing arguments for why the recent moderation is more than just a temporary factor and, as such, more-permanent factors are at play, in particular capacity constraints such as a shortage of skilled labour supply. Different surveys at a European level show that up to 70% of companies point to a skilled labour shortage as the main restraint to growth.
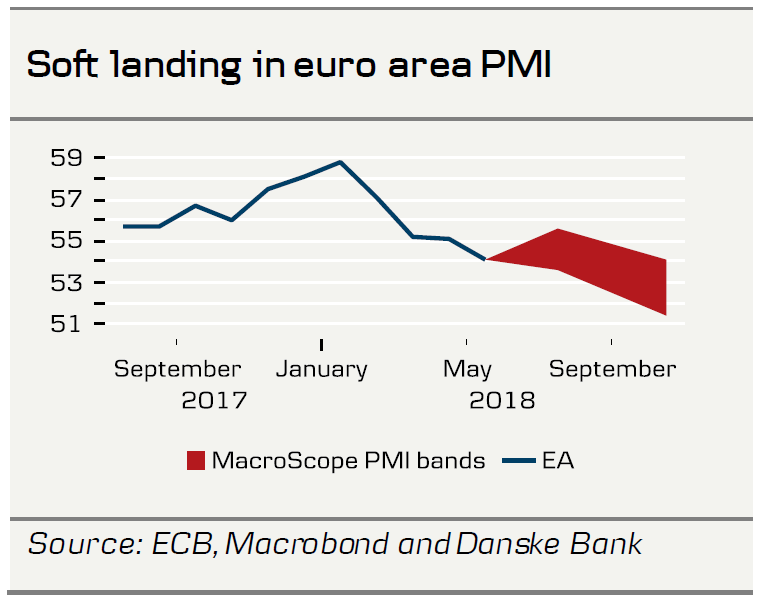
Both hard and soft indicators have declined. In particular, the important PMIs (composite) have declined consecutively for four months now to stand at 54.1 in May. While the soft landing from the very high PMI levels late in 2017 was expected, our MacroScope model points to further moderation in the late summer/early in Q4. The model points to PMIs printing in the 54 area during the summer period and settling slightly lower around 53 towards the end of the year. Overall, we still expect euro area growth this year to be around 2%, somewhat lower than pointed to by the ECB's staff p rojections in March.
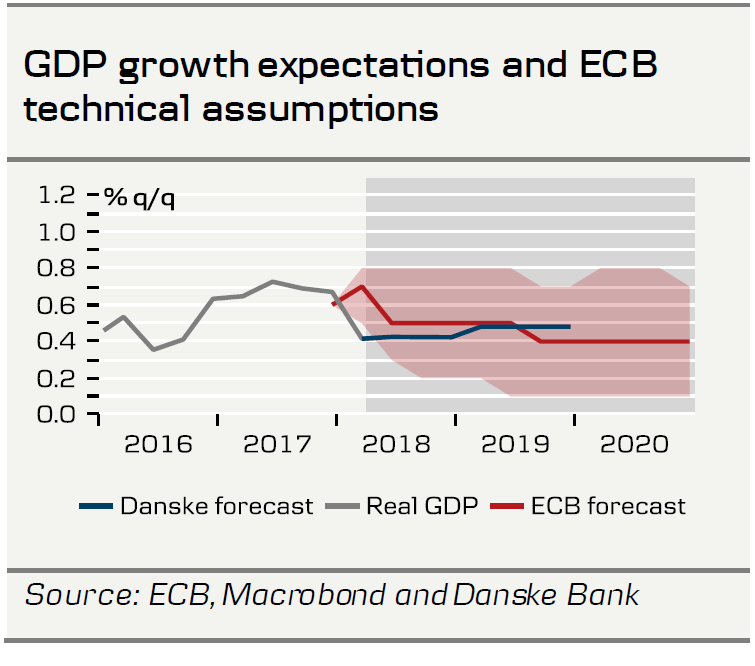
As already discussed in our ECB Preview - Not on Draghi's watch, 20 April, we expect the ECB to revise down its growth forecast in June, on the back of the moderation in data. In M arch, the ECB's governing council termed growth to be 'strong'. However, in April, it struck a slightly more gloomy tone of growth being 'solid' (which was also used in January's introductory statement). Given that euro area Q1 GDP came in at 0.4% q/q while the ECB assumed 0.7% q/q in its March staff projection, the lower Q1 print suggests a marked downward revision of the 2018 growth estimate to c.2.2% to come in June (2.4% in March).
Inflation and wage growth - gradual upward trend set to resume
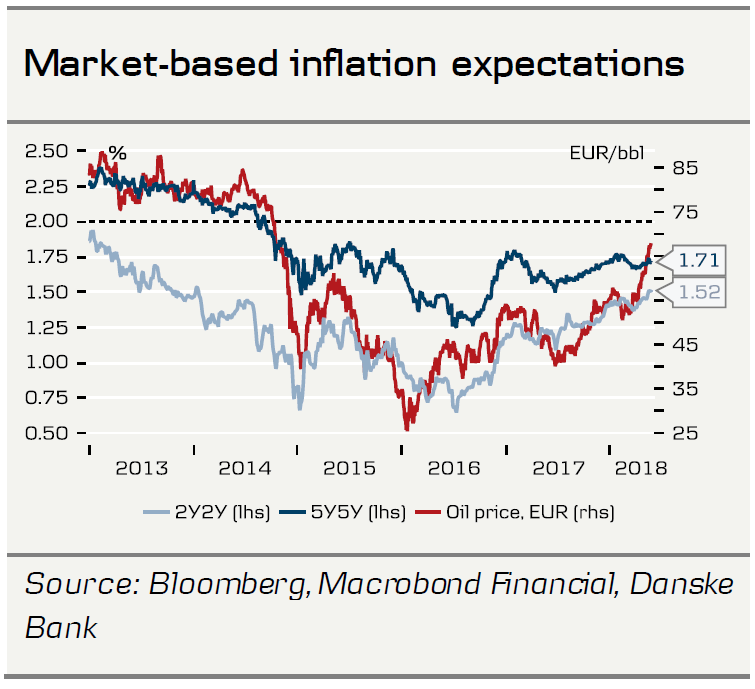
Both core and headline inflation fell short of market expectations in both March and April but as the trajectory for, in particular, core inflation is still upward sloping, it should not be an imminent worry for Draghi. The minutes from the April meeting revealed that the ECB has unchanged confidence in the convergence of inflation towards its aim, despite the growth moderation as of late, not least because of encouraging signs from a pickup in wage dynamics in some euro area countries - namely Germany, where negotiated wages have started to rise. Market-based inflation expectations have also risen, likely driven by the recent oil price rise, but long-term inflation expectations (5Y5Y) remain below the 2% target.
We expect Draghi and company to watch closely whether core inflation rebounds to previous levels in May (we get the flash release on Thursday 31 May ahead of the 14 June meeting). This will also have important implications for the timing of the next change in the forward guidance, which we expect to come in July. Our view remains t hat core inflation will rise only very gradually in 2018, averaging 1.1% before accelerating to 1.4% in 2019 on the back of rising wage growth and service price inflation. Although headline inflation will pickup towards the summer due to oil price base effects, we expect the ECB to look through these temporary factors and focus on the underlying price pressures.
Market pricing - we'll cross the bridge when we get there
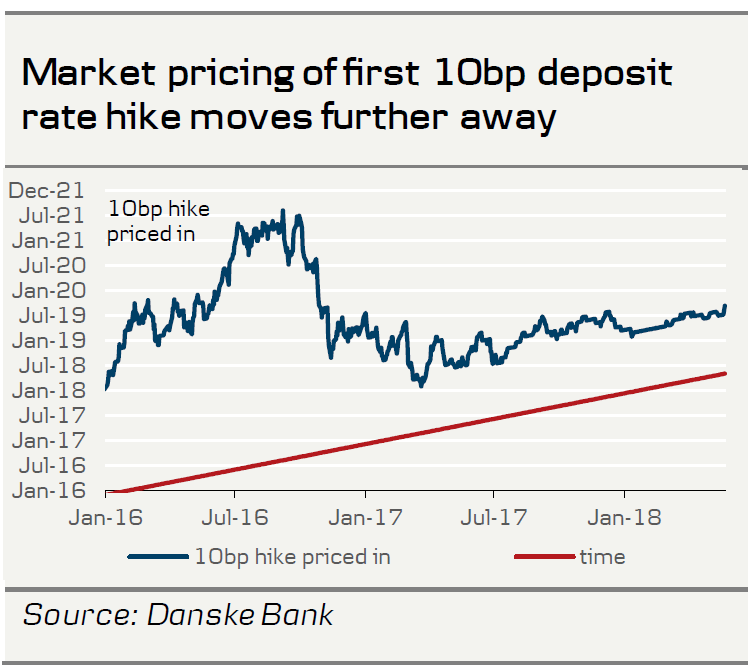
Markets are currently pricing a first 10bp deposit rate hike in September 2019 and a 20bp hike in January 2020. Expectations on the timing of the first hike have been pushed out recently on the back of Italian worries and market participants buying into the slow policy normalisation response. While the Italian worries may abate at a later stage, the reactiveness (contrary to proactiveness) is still visible within the ECB, just as Draghi said in the March press conference. Further, we emphasise that the ECB ending QE does not automatically imply a rate hike after a given period (see more below). The size of the first hike is still uncertain, as mentioned by several Governing Council members, and any discussion on this is seen as 'p remature' by the ECB. We believe the idiom 'we'll cross that bridge when we come to it' applies very well to this. We discussed the elements feeding into the discussion in ECB Research - 10bp, 20bp or ...? ECB in uncharted waters, 20 March.
Monetary policy - not leaving policy rate hike open
Our long held conviction that QE can be ended as growth is good and deflation risk is gone, while rate hikes are linked to inflation dynamics, was again supported on Wednesday night. When talking QE, Slovakian Governing Council member Jozef Makúch said 'Now we can afford to wind it down, GDP is at nice levels', yet on inflation 'From a medium-term perspective, we are convinced that this goal is being met and we expect that nominally, we'll be at the goal in 2020-21'. We believe that Draghi shares this view.
We do not believe the moderation in growth dynamics has altered expectations that QE will come to an end this year, as growth is still 'solid', above p otential. Therefore, unless we see a significant fall in both hard and soft indicators, we intend to keep to our call of ending bond purchases by the end of the year, c.f. balance of risk assessment below.
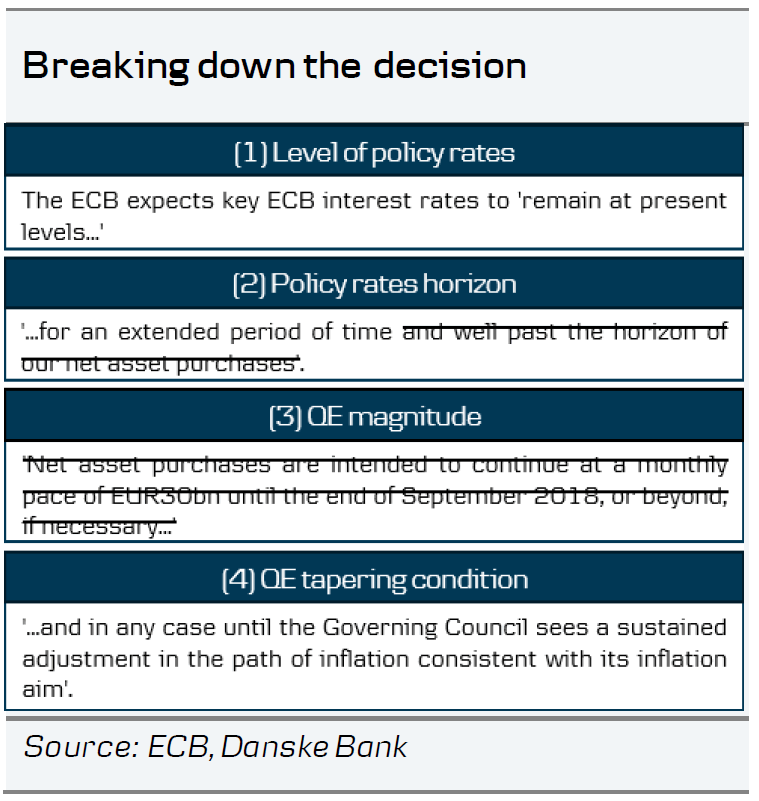
We expect Draghi and the ECB to make sure the prospect of the first rate hike is well communicated and anticipated by markets. Therefore, we are convinced that once APP comes to a halt and reinvestments continue, the language surrounding the first rate hike will not be left open or without proper guidance. In our view, we expect the current decision to record only marginal changes to reassure the forward guidance on rates. In the breakdown of the decisions in the table on the right, we have crossed out the parts to which we expect to be removed once APP comes to a halt and the guidance on interest rates to gain increasing importance on the inflation dynamics/outlook (or as Draghi and company call it SAPI = 'sustained adjustment in the path of inflation'). Therefore, we see the balance of risks as skewed to a longer than three months extension compared with a sudden stop.
For any extension/tapering of QE, we still expect a three-month extension into Q4 18 for the APP (of EUR15bn per month). This said, we recognise that the balance of risk is for a longer than three months extension, as already communicated by Draghi (and most recently Benoît Coeuré): the 'baseline expectation is, as Mario Draghi has said, that there will be no sudden stop '.
When should next change come - we expect July
We expect the next change in forward guidance to be announced at the 26 July meeting, as we believe the June meeting is likely to be dominated by sources of uncertainty regarding moderation, downward growth revisions and the ECB's lack of urgency to announce changes. Generally, we do not see the 'risk/reward' of the ECB acting pre-emptively compared with post-fact as being balanced, or as Draghi said in the March press conference 'the policy continues to remain reactive and not proactive'. Therefore, we do not rule out the possibility of a 13 September announcement, although it all depends on the communication that will be conducted in July.
Italy - a concern in the medium term for monetary policy
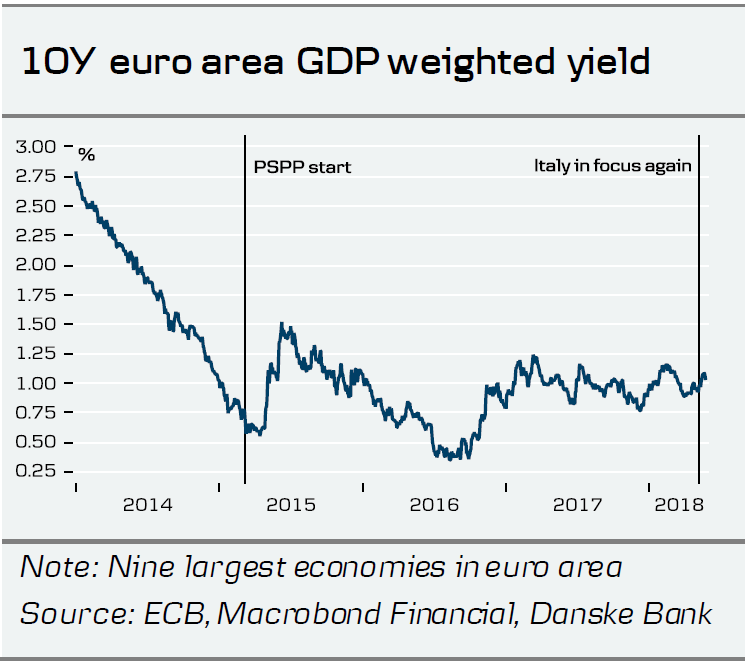
For monetary policy, the Italian election should not cause big worries for the ECB at this stage. Slight market pressure may even be welcomed in Frankfurt. As a metric on which to gauge the degree to which the ECB should be worried about financial markets developments is the GDP-weighted 10Y yield. While the GDP-weighted 10Y yield cannot be observed, it is, nevertheless, computed and monitored by the ECB (the staff projections even have reference to this measure). The 10Y yield has increased by only around 10bp to 1.08% over the past two weeks, during which time the market has renewed its focus on Italy. In the grand scheme of things, the rise is therefore modest and significantly below the level at the time of PSPP expectations were built in H2 14, albeit still around 50bp higher than at the start of QE. It currently 'trades' at the top end of its range over the past 1.5 years. We expect the ECB to become significantly more worried about Italian market developments at a much higher spread level to Germany than its current 195bp level.
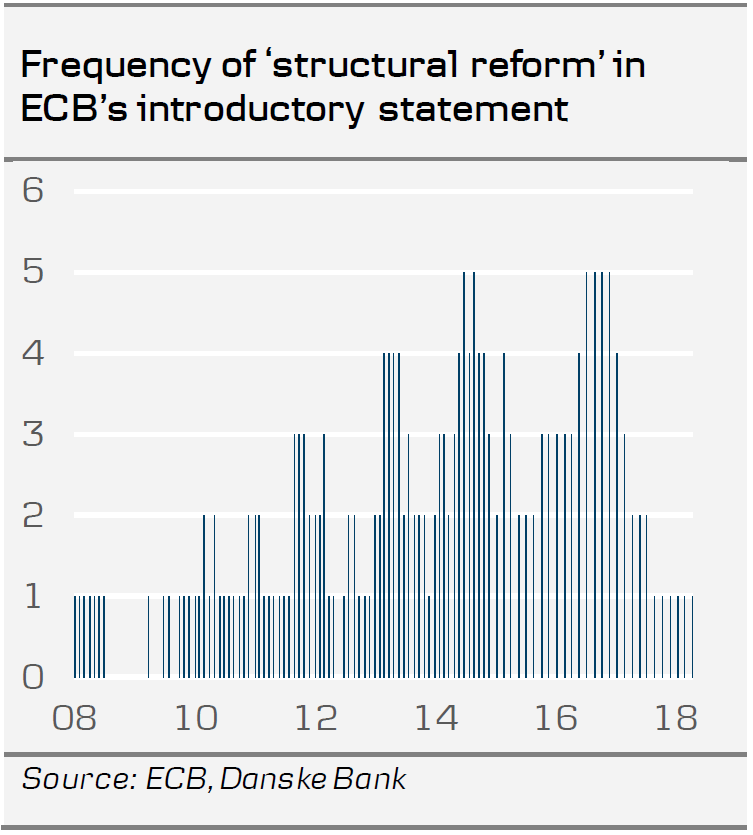
While a sharp sell-off in BTPs should cause concern for ECB monetary policy at the current juncture, the lack of reform willingness in Italy should create concern for the ECB, in the medium term. Indeed, the ECB has been calling for structural reforms (more or less) continually since 2009, although it is to a much lesser extent now than just 1.5 years ago.
In conclusion
While the euro area outlook is more 'clouded' (as ECB Chief Economist Peter Praet said yesterday) and the uncertainties have increased for the ECB and Draghi, no new information has forced them to change their stance at the current juncture but close monitoring is warranted on several fronts. Therefore, bond purchases are likely to end by the end of the year, with a rate hike only once inflation is 'SAPI'.
Dollars and Sense: Bond Yield Kinks
Highlights
- Sovereign 10-year bond yields in the U.S. and Canada have risen dramatically over the last month in comparison to their global market peers. This is largely due to improvements in inflation that are solidifying the upward path for central bank policy rates and increasing pressure on the term premium.
- At the same time, we are seeing a continuation of the flat yield curve. Contrary to what you may have been hearing, a flat yield curve in the middle of a rate hiking cycle is normal. Over the coming years, we would expect the curve to flatten even further as central banks raise policy rates.
- In the environment of a flat yield curve, it is not surprising that we are experiencing kinks in various tenors. This was on full display last week when the Canadian 30-year inverted with the 10-year. Flatness across the entire curve means that supply and demand factors can put pressure on yields, causing them to cross one another temporarily. What is important is that this is not a recession warning, yet.
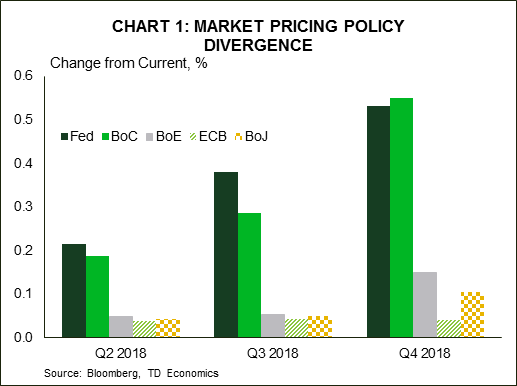
Over the last month, we have seen a weakening in the typically parallel moves in international bond yields relative to the U.S., with the exception of Canada. A tight correlation typically exists with Canada, but it’s being reinforced this year by the fact that the two countries share similar economic backdrops. They are two of the few countries where inflation has already moved towards their central bank 2% targets, where central banks are engaged within an active rate-hiking cycle (Chart 1), and where economic slack is at a minimum, if there is any at all. In contrast, international peers like Germany, the U.K., and Japan are lagging on some or all of these fronts. This has caused their long-term sovereign yields to not rise in step with their American counterparts. This separation reflects the fact that investors are applying a more discerning lens to unique country data and risks. Recent poster-children of this lens are Argentina and Turkey, where heavy foreign indebtedness and insufficient foreign reserves have left them exposed to capital outflow. Readers should take comfort in the fact that the return to volatility more broadly since the start of the year results in exactly this behavior. Importantly, it’s not a bad thing to see, as it ensures complacency does not set and cause market risks to become magnified down the road. We draw comfort from a discerning investor, provided capital movements are not rooted in a fear-based reaction that is blindly applied to a broad swath of undeserving countries.
Inflation driving yields
Markets have been responding in recent months to inflation returning back to central bank targets in the U.S. and Canada. The Federal Reserve’s (Fed) preferred metric, core PCE is at 1.9% and the average of the Bank of Canada’s (BoC) three core inflation measures is at 2.0%. Market pricing around rate increases has solidified for these central banks, which has translated in an upward shift in the short-end of the yield curve (i.e., 2-year tenors). At the same time, softer data in Europe has eased market expectations around rate hike timetables for the European Central Bank (ECB) and the Bank of England (BoE). Consequently, sovereign 2-year yields have failed to follow their North American peers. This is also one reason why the Canadian dollar has held within a firm range against the greenback, while the euro and the pound have broken down, depreciating over 5% from recent peaks versus the USD.
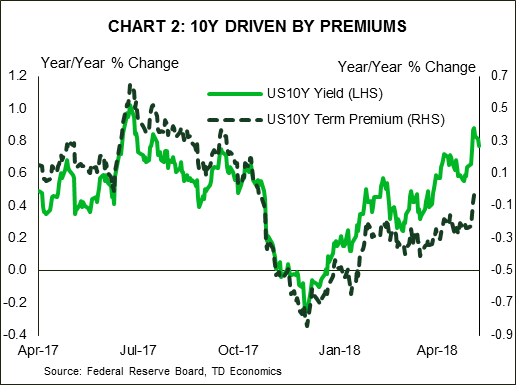
An inflation story is playing out in longer tenor yields as well. Both U.S. and Canadian 10-year yields have jumped more than 30 basis points since the start of April. The move has caused the UST 10-year to break confidently through the psychological 3% barrier. With inflation higher, investors are demanding a greater premium for locking into 10 years of fixed cash flows. Though still low, this term premium has accounted for nearly three-quarters of the UST 10-year’s increase over the last two months (Chart 2). With inflation pressures unlikely to abate (and in fact skewed to the upside), and central banks expected to move interest rates higher through 2019, term premiums should continue to edge higher. This would translate into 10-year yields moving towards 3.3% in the U.S. and 2.8% in Canada by the end of 2019.
The slope of the yield curve to remain flat
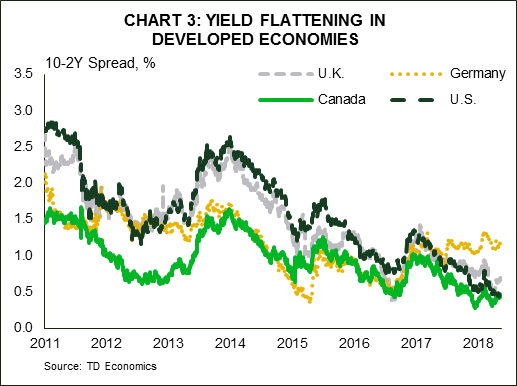
Putting the pieces together, rate hike cycles correspond to flatter yield curves. The U.S. 10-year and 2-year spread has shrunk from roughly 133 basis points at the beginning of 2017 to around 40-50 basis points today (Chart 3). And, we suspect it will slim down further to within a 30-35 basis point range. Our clients often ask whether the narrowing spread is signaling recession. It is not, at least, not yet. Spread narrowing is a very common, and a necessary, facet of a rate hiking cycle for two reasons:
1. The response of long-tenors:
The 10-year yield is a reflection of market expectations 10 years out for the policy rate. For this reason, the forward-looking market typically causes the 10-year yield to make its largest adjustment at the beginning of the rate hiking cycle, and then grind up more slowly as the central bank continues raising rates. That’s why we see a smaller step-up from here for the UST 10-year yield now that it’s already crossed 3%. This would place long-yields at what we call a “terminal yield”, which is rooted in our view of the endpoint for the Fed policy rate (inflation and r*) and a normalization of the term premium (interest rate risk and supply/demand factors). Differences in 10-year forecasts across countries will reflect our view of these factors. For example, we believe that the UST 10-year will end the cycle at a higher level than the Canada 10-year because the running speed for economic growth is a bit higher in the U.S (amongst other factors).
2. The response of short-tenors
During this hiking cycle, shorter tenors that closely reflect the policy path (i.e., the UST 2-year) will steadily rise. The 2-year will typically peak when the central bank has stopped raising policy rates. The 10-year/2-year spread will narrow as the 2-year catches up to the 10-year. The current narrowing in the spread is what we would expect. With the Fed, BoC, and BoE all having initiated rate hiking cycles, the yield spreads for the associated sovereigns have narrowed significantly. In the case of the U.S. and Canada, the 10-year/2-year spreads for both sovereigns have narrowed the most and should remain narrow over the next twelve-to-eighteen months.
Supply and demand cause kinks in the yield curve
As the curve flattens, there is less margin for error when supply factors enter the equation. In other words, oddities may appear with greater frequency. Case in point, up until two weeks ago, the Canada 30-year yield relative to the 10-year was separated by a mere 8 basis points. So, when the 30-year yield actually inverted with the 10-year a week ago, this caused media headlines to flash…”yield inversion takes hold in Canada”. Naturally, this raises a red flag in the mind of investors as to whether this is an early warning signal of recession. The answer is no. Supply side factors are at work here, and recession signals generally hail from an inversion of the 10yr-2yr spread, not just the long end. On that note, the spread remains healthy at around 40-50 basis points, similar to the United States.
The long-end inversion likely occurred due to high demand for long duration assets at a time when supply is not keeping up. The 30-year spread to the 10-year in the U.S. has also flattened dramatically due to issuance preference by the Treasury towards short duration. But, given that the U.S. government is running sizeable deficits relative to Canada, the U.S. Treasury will have to ramp up supply in the market. As a result, it is no wonder that U.S. spreads are a little wider. In addition, for the Canada 30-year, there may be seasonal, technical factors at work in the months of May and June, when history has shown demand and supply to be particularly uneven due to timing of bond issuance. The bottom line is that narrow spreads between short and longer tenures can cause misleading signals on data quirks, and so this too will require a more discerning eye from the investor.
Expect more of the same with bond yields
Looking forward, as central banks continue the normalization of interest rates, we expect the continued flattening of yield spreads and for media headlines to remain fixated on whether warning signals are being flashed. We too will be scrutinizing the data because yield inversions are indeed good leading indicators of recessions, albeit imperfect. That said, when certain parts of the curve are at such narrow spread levels already, issuance preference can cause volatility. Just looking at yields may cause one to think that governments would desire to issue in the long tenors of the yield curve, but the trend has been towards short duration. This preference limits upside for the 10 and 30-year, but increases the ceiling for the 2 and 5-year. Until this changes, expect spreads to remain tight.
Australia & New Zealand Weekly: Prospects for the Australian Economy; Markets; and Global Risks
Week beginning 28 May 2018
- Prospects for the Australian economy; markets; and global risks.
- Australia: business capex, CoreLogic home prices, dwelling approvals, private credit.
- NZ: RBNZ Financial Stability report, terms of trade, residential building consents, business confidence.
- Euro Area: CPI, unemployment, Bank of Italy Governor speaks.
- US: nonfarm payrolls, PCE deflator, Beige book, Memorial day.
- G7: finance ministers and central bankers meeting.
- Key economic & financial forecasts.
Information contained in this report current as at 25 May 2018.
Prospects for the Australian Economy; Markets; and Global Risks
As we contemplate the remainder of 2018 and 2019 there are a number of key themes that we believe will dominate economic and market developments. Our advice to customers throughout 2017 has been to expect Australia's growth rate to likely be anchored below trend in both 2018 (2.7%) and slowing to 2.5% in 2019. That has contrasted with official forecasts (Reserve Bank and Treasury) which anticipate growth picking up to 3.25% in both 2018 and 2019.
We have recognised a solid ongoing boost to growth from non-residential construction; government investment (especially at the state level) and exports. However we are much more cautious than official forecasts on the consumer; residential construction and equipment investment.
Slowing household incomes
Signals from the December quarter national accounts are more encouraging for the official view. Household spending has been revised up from an expected 2.1% to 2.9% following the release of the December quarter national accounts. This picture of households has changed from "lacklustre" to "slightly below trend".
However this was associated with a weak savings rate of 2.7% despite a boost in nominal labour income growth to 4.8% for the year largely due to an extraordinary lift in hours worked of 3.5%. With hours worked increasing so rapidly, labour income growth should have been boosted further but was constrained by wages growth and a drift to lower paid jobs - non-farm compensation per employee remained flat in the December quarter to be up an insipid 1.8% for the year.
Labour productivity fell over the year with GDP per hours worked falling by 1% over the year and unit labour costs growth lifting to 2%. This adverse development in labour productivity is tempering the recent strong demand for labour we experienced in 2017. In the four months to April the annualised employment growth rate has slowed to 1.3%.
There will clearly be a slowdown in the 2017 break neck pace of growth in hours worked over the course of 2018 and into 2019. Weak wages growth and the drift to lower income jobs looks set to continue putting downward pressure on growth in labour incomes. With the savings rate now probably at its lows, another year of below trend consumer spending growth can be expected.
Business investment
New business investment lifted by 5.8% over the past year, a sharp turnaround from a 6.2% decline over 2016. Over the year, infrastructure work fell 1.2%; non-residential building advanced 12.3% and equipment investment spending increased by 8.4%.
Mining equipment investment lifted by 31% over the year, reflecting the final fit out of three major projects. It is more encouraging that non-mining equipment investment lifted by 6.2% over the year following a slowdown in 2016 partly associated with the uncertainty around the 2016 election.
With another Federal Election due by May 2019 and even greater uncertainty associated with that election (conservative government was expected to win the 2016 election whereas the Labour opposition is ahead in the current opinion polls), we may start to see equipment investment run into some headwinds from that political uncertainty from the second half of 2018. A less upbeat outlook for consumer spending in 2018 and 2019 is also likely to discourage equipment investment.
Housing downturn
Dwelling investment contracted in 2017 by 5.8%. Based on the downturn in the trend in high rise approvals and a flat outlook for detached housing, we expect this downturn has further to run with the contraction accelerating into 2019. Oversupply and a marked slowdown in sales to foreigners are weighing on the outlook for residential building. House prices are now falling. On a six month annualised basis, prices are now falling in Sydney (-7.3%); Melbourne (-1.2%); Perth (-0.4%) and Brisbane (-0.1%).
The regulator's macro prudential policies are restricting interest only loans and tighter guidelines for all new loans are slowing house prices and credit growth. In previous cycles the authorities have relied on raising interest rates to slow the highly cyclical housing market. This time, the same effect has been achieved by the regulator as banks have independently raised loan rates; foreign demand has slowed; and regulations have significantly squeezed the availability of credit. This process will continue for the foreseeable future and the supply of credit is expected to tighten markedly.
On the demand side the attractiveness of investment properties has diminished. Land taxes and lacklustre rental growth have tightened rental yields. Prospects of adverse tax changes in the event of a change of government are also impacting investor confidence. All major banks (with the exception of Westpac) are predicting rate increases out to end 2019. New lending to investors tumbled by 9% in April to be down 26% over the course of the last year.
The current fall in investor loans is comparable to the fall in 2015/2016. That subsequently reversed in the aftermath of the May and August rate cuts - prospects for a repeat of rate cuts seem unlikely.
We expect an extended period of falling house prices (up to 10% over the course of the next two years) with weakness particularly centred on the Sydney and Melbourne markets. This will represent a considerable change in the "atmospherics" around housing wealth and may weigh further on prospects for consumer spending.
While the wealth effect was modest in the period of rising house prices it is reasonable that there will be a more marked effect through the downswing.
Inflation below target
Inflation is also likely to remain benign holding a little below the bottom of the Reserve Bank's 2-3% target band. In this regard we are in broad agreement with the Reserve Bank which is forecasting that underlying inflation will hold at around 2.0% in 2018 and 2019. Note that underlying inflation has held below the 2-3% target band in 2015; 2016 and 2017.
With underlying inflation likely to therefore register five consecutive years at or below the bottom of the target range it is reasonable to argue that Australia is experiencing a structural fall in inflation. Arguably, without the risk of overheating the housing market (as would have been a concern through 2016 and 2017), interest rates would have been even lower in Australia in recognition of this structural fall and the disappointing progress in restoring inflation to the target range.
Interest rate outlook
Throughout 2017 and 2018 we have been of the view that the official cash rate will remain on hold in both 2018 and 2019. With rates on hold in Australia and the US Federal Reserve continuing to raise rates, Australia's cash rate has now fallen below the Federal funds rate. By end 2018, it is set to be 63 basis points below the Federal Funds Rate, and by end 2019, 112 basis points below the Federal Funds Rate.
Sustained period of negative Aus-US rate spreads
The US economy is operating with much less 'slack' in its labour market (unemployment rate of 3.9% compared to an estimated full employment rate of 4.5%) than Australia (unemployment rate of 5.6% compared to a full employment rate of 5.0%) but, to date, wage pressures have only recently emerged (six month annualised pace for the wages component of the ECI has lifted to 2.9%)
Of most concern to markets has been the planned lift in government spending ($300 billion over 18 months) and the Tax Cuts ($1.5 trillion over 10 years) in the US. These policies are likely to boost the Budget deficit by around 2% of GDP providing a solid boost to demand when the economy is already operating at full capacity in the labour market.
We expect two 25 basis point hikes in June and September from the FED. That would see the USD/AUD yield differential in the overnight market contract to minus 63 basis points - a situation we have not seen since early 2000. Two further FED hikes are expected in the first half of 2019.
AUD/USD Bond Spread
Back in August 2017, Westpac had been forecasting that AUD cash rates would fall below the US Federal Funds Rate by around 40 basis points by end 2018. That, in turn, would drive the 10 year bond spread to zero, from around 60 basis points. At that time markets were priced for the US fed funds rate to be around 35 basis points below Australia.
But now markets are expecting a yield differential of around minus 75 basis points by year's end. We now expect RBA rates to be even lower than Federal Funds at minus 63 basis points by end 2018 and minus 112 basis points by mid-2019. The likely result is that AUD 10 year bonds will trade around 40 basis points below US bond rates by mid-2019.
Commodity Prices; China; and the Australian Dollar
Recent general euphoria around the global economic outlook has changed to caution. Uncertainty around trade; falling PMI's in Europe; Japan and Korea and rising bond rates in the US all signal caution. Growth in the Chinese economy is expected to slow as consumption and net exports are unable to compensate for the ongoing slowdown in investment. However, the big uncertainties and risks centre around the Chinese financial system.
China realises that it must move away from its growth model based on credit fuelled exports and investment. In particular the role of the financial sector must change from channelling high savings at low cost to strategic sectors, to facilitating China's economic transformation to a more sustainable model based on services and consumption. But the "old" model has resulted in financial assets growing from 260% of GDP in 2011 to 470% in 2016 (IMF, 2017). The excessive growth (around 30% per annum over the last 10 years) has been in the largely unregulated non- bank sector.
President Xi has nominated poverty; pollution and financial leverage as his key "challenges". The "shadow banking sector" particularly funds property development and speculation; local governments (which explain 80% of infrastructure investment); and commodity speculators. All these users of funds expect excessive returns and can service higher loan payments . The sector is beginning to be squeezed.
We are already seeing some evidence of this squeeze on the non-bank sector. Banks are no longer allowed to guarantee wealth management products; entrusted loans (corporates borrowing to lend to other corporates with banks operating as agents) have been banned; rapid growth in short term interbank funding has been slowed; and general funding for wealth management products is being restricted. Growth in the nonbank sector is severely lagging the pace of 2017.
These forces are likely to weigh on iron ore and coking coal prices. Some lift in supply from Australian producers is also expected to lower prices. These atmospherics for commodity prices along with the widening interest rate differential; and more appetite for the USD in an uncertain world are eventually expected to weigh on the AUD. We target AUD at USD 0.74 by end 2018 and 0.70 by 2019.
The week that was
The past week has been short on data, but long on policy speak and politics. Other than to say that considerable uncertainty remains around the US/China trade relationship and geopolitical tensions with North Korea, herein we focus on the economics.
Of the commentary to hand, that from the FOMC is most notable. The minutes from their May meeting caught the market off guard, with the 10-year US yield falling from 3.06% ahead of the release to 2.98% the day after - the cancelation of the US/ North Korea summit was also a factor here. The surprise for markets (or at least those talking up inflation risks of late) was the calmness shown by the Committee. Rather than seeing the risk of a break higher in PCE inflation above 2.0%yr towards the CPI's 2.5%yr current level, the Committee instead held that it was "premature to conclude that inflation would [even] remain at levels around 2 percent". This view is seemingly based on "some of the recent increase in inflation" being representative of "transitory price changes" and as "various measures of underlying inflation, such as the 12-month trimmed mean PCE inflation rate from the Federal Reserve Bank of Dallas, remained relatively stable at levels below 2 percent". To see upside inflation risks build, a stronger wage pulse is necessary. At present the employment cost index is only reporting "a gradual pickup in wage increases", while the uptrend in other measures is "less clear".
For those who doubt this view of inflation and instead anticipate it will sustain above 2.0%yr, the use of "symmetric" 10 times in the minutes cautions on the impact such an upside surprise would have on policy. Put simply, even if inflation does surprise to the upside and exceed 2.0%yr for a time, the Committee are likely to look through it, seeing such an episode as transitory and potentially needed to sure up long-term inflation expectations following such a long period of failure in achieving the target.
An acceleration in the pace of rate hikes would only be seen if inflation accelerated away from the FOMC's medium-term target. The second important aspect of recent FOMC communications is their view of financial conditions and neutral. Broadly on financial conditions, these are seen as supportive of growth, with a US dollar well below its 2016 peak and equity markets near highs offsetting a return of the 10-year yield (and thus mortgage rates) back to their 2013 highs. The more significant point is that, now 'neutral' is nearing, the Committee is becoming more concerned over the potential for a non-linear response in financial conditions and/or growth from a rate hike(s). Whereas their longer-run expectation of the fed funds rate is 3.00% (from the March meeting forecasts), speeches made by regional Fed Presidents Harker, Kaplan and Bostic after the minutes release point to neutral currently being around 2.50-2.75%. President Williams of the San Francisco Fed (soon to be the NY Fed) update on R-star this week corroborated this view, seeing it stuck around 2.50%.
A perceived neutral rate of 2.50% and lingering doubts that inflation will run above the 2.0%yr target are supportive of our view that this FOMC hiking cycle will end after four further hikes in mid-2019 at 2.625% - well short of the FOMC's seven hikes to the 2020 forecast, as per the March 2018 meeting forecasts. There is an additional element worth keeping in mind in all of this. The FOMC want to promote confidence in the economic and policy outlook. To do that, a positive sloped yield curve is strongly desired (to stop concerns of a recession developing). As such, expect short-term caution to be strongly emphasised by the FOMC, but those longer-term rate hike expectations to remain in place.
Moving back to Australia, this week we began the run to the March quarter GDP report (due Wednesday 6 June) with the construction work done release. The construction sector will offer a small positive contribution to growth in the quarter, spearheaded by activity in the public sector, particularly on transport projects. Private engineering work was broadly stable, as was new home building after it declined through 2017. Home renovations did bounce in the quarter, but the underlying trend remains subdued. By state, the south-east continues to lead the way; WA (unsurprisingly) lags.
Finally from our NZ economics team comes the latest quarterly outlook. In it they highlight that New Zealand's growth cycle has now matured, with the sector mix shifting away from the consumer towards government spending. The terms of trade remains favourable for national income, though population growth is slowing. On monetary policy, the Westpac view remains that the RBNZ will stay on hold until the end of 2019 - a view that the market is increasingly warming to.
Chart of the week: Euro Area PMI
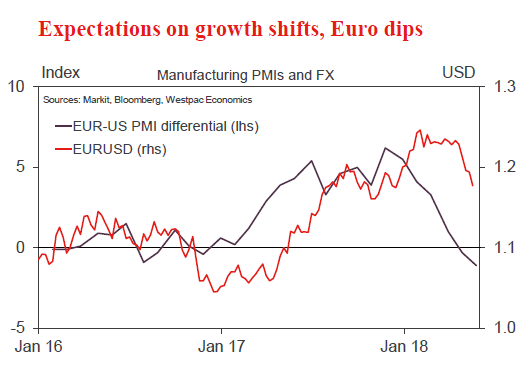
This week, the flash estimate for the Euro Area manufacturing PMI fell to 55.5 from 56.2 while the US manufacturing PMI edged up to 56.6 from 56.5.
The May release extended on April's result which marked the first time the Euro Area PMI had been below the US PMI since late 2016 . Between then and now, the PMI differential and the EUR/ USD cross displayed a strong relationship, largely reflecting the past optimism over the Euro Area growth story. This has since subsided as growth slowed across the continent while political developments in Italy add further uncertainty.
New Zealand: week ahead & data wrap
New Zealand's economy aging gracefully
New Zealand's economic expansion has entered a more 'mature' phase. While GDP growth isn't weak, it has slowed from the rates of 3.5% to 4% p.a. that we saw in recent years as earlier drivers of demand have cooled. And as we discuss in our latest Economic Overview1, we expect a further moderation over the next few years.
Among the more notable developments has been the slowing in migration led population growth. While net migration remains elevated, it has actually been easing back for around a year now. In fact, the net inflow of 67,000 people in the year to April was the lowest it's been in two years. We expect that net migration will continue to slow as many of those who arrived in recent years on temporary visas depart.
At the same time, the heat has come out of the housing market. After a brief resurgence, house prices have started to fall again in Auckland and Christchurch, and the pace of increase has slowed sharply in Wellington. With a range of significant government policy changes targeting the housing market being introduced (such as the extension of the 'bright line' test for taxing capital gains which came into effect at the end of March), we expect house prices will lose further ground over the remainder of this year.
The slowdown in the housing market will dampen households' spending appetites. In fact, we've already seen softness in the retail sector in the early part of 2018: core retail spending only rose by 0.6% in the March quarter, and electronic card transactions for April point to a soft path for spending.
With the housing market cooling, we could see the RBNZ easing lending restrictions again later this year. We'll be watching the upcoming May Financial Stability Report (due for release at 9.00am on Wednesday 30 May) to see how the RBNZ's thinking in this area is evolving.
Finally, as we discuss below, the construction sector is also taking a breather, with activity set to rise only gradually despite strong demand.
Helping to offset the above headwinds are some positive factors. Along with low interest rates, the terms of trade are strong and government spending is stimulatory. This mixture suggests the economic expansion will age gracefully rather than expire suddenly, with GDP growth of a little below 3% p.a. expected over the next few years.
We expect headline inflation will push higher over the coming year and will briefly reach the 2% mid-point of the RBNZ's target band. That could cause the RBNZ to become a little more hawkish later this year. However, the near-term lift in inflation that is occurring is a result of the recent drop in the NZ dollar and the sharp rise in oil prices. Those factors are only providing a temporary boost to inflation. Under the surface, the factors that have contributed to New Zealand's 'lowflation' environment have not gone away. As a result, core inflation is likely to remain below the RBNZ's 2% target band for some time. Consequently, we still expect that the OCR will only begin rising at the end of 2019, and we are pleased to see that financial markets have largely come around to that view.
Can we build? Yeah…Nah.
There's been a lot of debate recently around how much residential construction we'll see over the next few years, and what role the Government's flagship KiwiBuild program will play. KiwiBuild aims to provide funding to support the construction of 100,000 affordable homes over the next decade. In the May Budget, the Treasury changed some of its assumptions regarding how this would play out, and it now forecasts that the boost to construction will occur later than they had previously assumed. In fact, their forecast for the additional nominal residential investment that KiwiBuild will generate by 2022 is now around half of what they forecast back in December, with the bulk of activity expected to occur beyond that date. This forecast change stemmed from updates in the assumed timing of capital expenditure on KiwiBuild. In addition, the Treasury has continued to stress that capacity constraints mean that KiwiBuild spending and private demand could crowd each other out. That means that the overall increase in total home building will be smaller than the number of KiwiBuild homes implies.
In contrast, the Ministry of Business, Innovation and Employment (MBIE) expects a much faster lift in KiwiBuild related building. In fact, a recent MBIE report suggest that between 2018 and 2022 additions to residential building as a result of KiwiBuild could be around two to four times as large as the Treasury assumed in the May Budget. MBIE's report highlights a range of financial constraints that KiwiBuild funding could help alleviate to support building.
Crucially, however, MBIE's report noted that: "our estimates did not discount for capacity constraints or substitution." To put that differently, MBIE's forecasts provide an indication of how many homes might be built under the KiwiBuild banner. But they don't really give us an indication of what the overall level of construction activity will look like, or how much private sector activity KiwiBuild might displace. In contrast, the softer forecasts from the Treasury explicitly allow for such constraints, and assume that they will be even more of a drag on home building over the next few years.
Capacity constraints are really what is at the heart of the outlook for construction. After large increases in recent years, the sector is encountering some strong headwinds, including rising costs and shortages of skilled labour. That means the KiwiBuild program will be one more buyer in an already constrained market. Even allowing for an increase in the size of the labour force over the coming years and a shift to smaller, higher density homes, the building sector is going to be wrestling with constrained capacity for some time yet. This means that, even if KiwiBuild related construction does pick up (and we have our doubts), this would likely result in private sector construction being crowded out.
We expect that KiwiBuild will help to offset some of the financial headwinds in the construction sector over the next few years. And longer term, KiwiBuild related efforts to increase construction sector capacity could also increase building activity. Nevertheless, it will be a slow grind higher, and more gradual than even the Treasury's forecasts assume.
Data Previews
Aus Apr dwelling approvals
- May 30, Last: 2.6%, WBC f/c: -3.0%
- Mkt f/c: -3.0%, Range: -7.0% to 7.3%
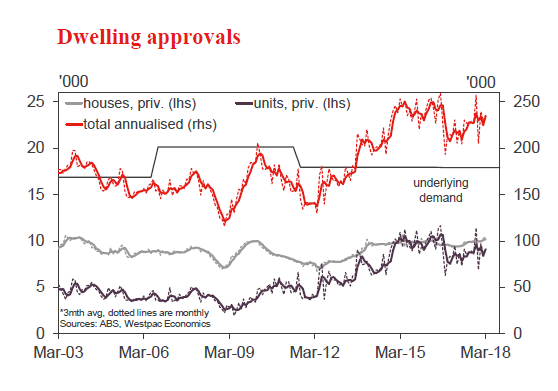
Dwelling approvals firmed in March, rising 2.6% to be up 14.5%yr (albeit with the annual gain exaggerated by monthly volatility affecting the base period). The March rise was led by a solid +6.1% rebound in units, led by high rise, and a reasonably firm 1.1%mth gain for private detached houses.
Lead indicators continue to point to softening approvals in the months ahead. As we have highlighted for some time, a sharp fall in site purchases last year suggests the pipeline of new high rise projects is set to take another leg lower. Meanwhile, a fall off in construction-related housing finance approvals - which had firmed through the six months to March - is also pointing to a move lower for non high rise approvals. Neither of these indicators are precise enough to pin point the often large monthly swings in approvals. Nonetheless the weakening theme is clear. On balance we expect approvals to retrace 3% in the April month, risks as always centring on the volatile high rise segment.
Aus Q1 business capex
- May 31, Last: -0.2%, WBC f/c: -0.8%
- Mkt f/c: 1.0%, Range: -1.0% to 3.0%
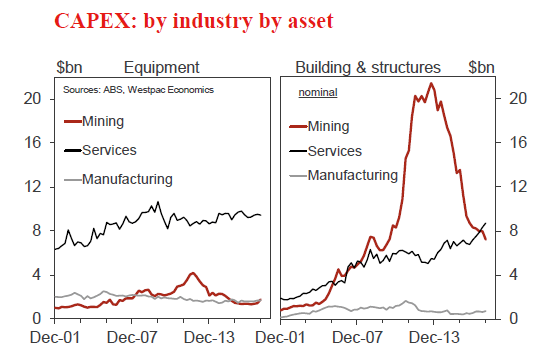
Business capex spending turned the corner in 2017 with the mining investment wind-down largely complete and with the emergence of an upswing in investment by the non-mining economy. Capex rose 4% in 2017 after four years of decline.
Despite this, we anticipate a small pull-back in Q1, forecasting a decline of 0.8%.
Building & structures capex is expected to fall by almost 1.5%. Building activity surprisingly fell, a reported -4.2% (Construction survey), which is likely to be promptly reversed given the strength of approvals. Infrastructure activity edged higher, +0.4% (Construction survey).
Equipment spending is expected to consolidate, with a flat result. This follows a Q4 outcome of 2.2%qtr, 7.2%y, including a 23% jump for mining, likely boosted by the fit out of major projects nearing completion. The risk is that mining equipment spend pulls back in Q1.
Aus capex plans
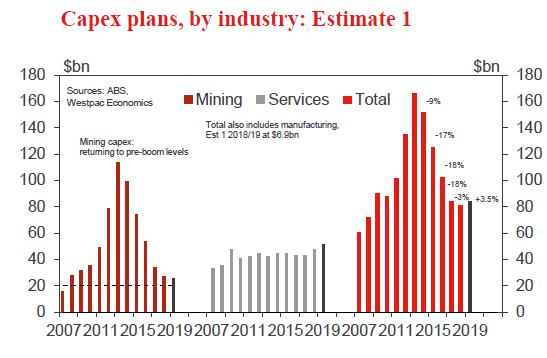
- May 31, Last (Est 1 for 2018/19): $84.0bn, +3.5%
This survey, conducted during April and May, includes the 2nd estimate of capex spending plans for 2018/19. A word of caution, estimates 1 and 2 can be unreliable.
In the previous survey, Est 1 for 2018/19 was $84bn, some 3.5% above Est 1 a year ago. This is the first positive 'Est 1 on Est 1' comparison since 2012/13.
For mining, Est 1 on Est 1 is only a modest negative, at -5%, with the investment wind-down nearing its end.
For services, Est 1 vs Est 1 is +8%, evidence that the investment upswing is set to continue, with strength in buildings reflecting the lift in commercial building activity.
This update is likely to confirm the broad themes evident in the capex survey 3 months earlier.
Potentially, Est 2 will be around $90bn, a 7% upgrade on Est 1, which would have Est 2 on Est 2 at +4%.
Aus Apr private credit
- May 31, Last: 0.5%, WBC f/c: 0.4%
- Mkt f/c: 0.4%, Range: 0.3% to 0.6%
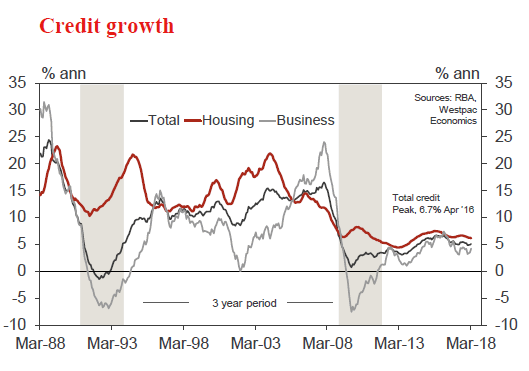
Private sector credit is expanding at a modest pace as the housing sector cools. In 2017, credit grew by 4.9%, slowing from 5.6% for 2016.
For April, we expect a rise of 0.4%, in line with the recent average but a tick down on the March outcome of 0.5%.
Housing credit, at this late stage of the cycle, is slowing in response to tighter lending conditions. In March, housing credit expanded by 0.45%, which is a 5.6% annualised pace, well down from the 6.8% annualised pace of last May.
Business credit, 4.2% above the level of a year ago, is volatile around a modest uptrend as businesses increase investment in the real economy. The segment hit a soft spot at the turn of the year, up only 0.1% in the 3 months to February. This was followed by a 0.8% jump in March, suggesting that the upward trend has resumed.
Aus May CoreLogic home value index
- Jun 1, Last: -0.3%, WBC f/c: -0.2%
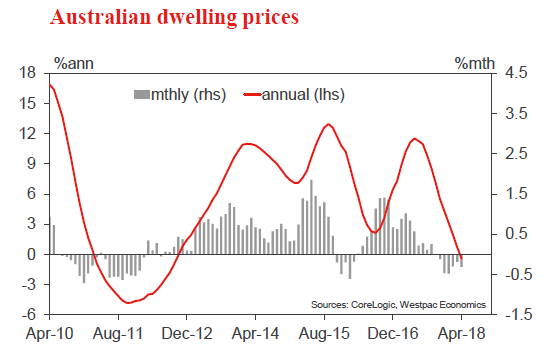
The CoreLogic home value index, covering the eight major capital cities, dipped 0.3% in April marking the sixth successive monthly decline. Prices nationally are down 0.3%yr, the first annual fall since Oct 2012. The most disaggregated price data shows about a third of properties nationally are experiencing annual price declines - a more widespread correction than in 2015-16 but a much lower incidence than seen during the bigger price corrections in 2011-12, 2008-09, the mid 2000s and the mid-1990s.
The daily index points to further 0.1% decline in May that will take the annual rate of decline to -1.1%yr nationally. Auction clearance rates have tracked lower in recent months and are now marginally below long run averages in both Sydney and Melbourne.
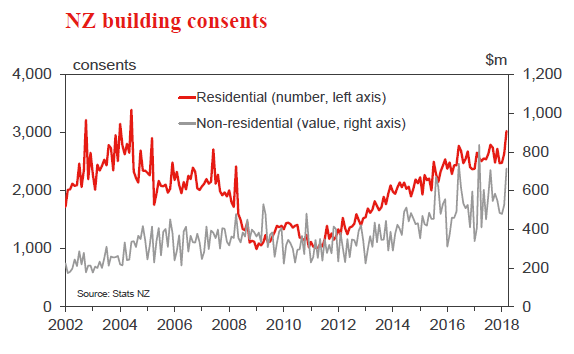
NZ Apr residential building consents
May 30, Last: 14.7%, WBC f/c: -10%
- Residential building consents surged higher in March. This was underpinned by a sharp rise in multiple consents (such as apartment buildings) in Auckland and elsewhere.
- Multiple consents tend to be lumpy on a month-to-month basis, and we expect to see a reversal in April. That would pull overall consent issuance down by 10%.
- Smoothing through the volatility associated with multiple consents, construction activity has flattened off in recent months. Construction firms are highlighting shortages of skilled labour and difficulties with financing as important brakes on the pace of building.
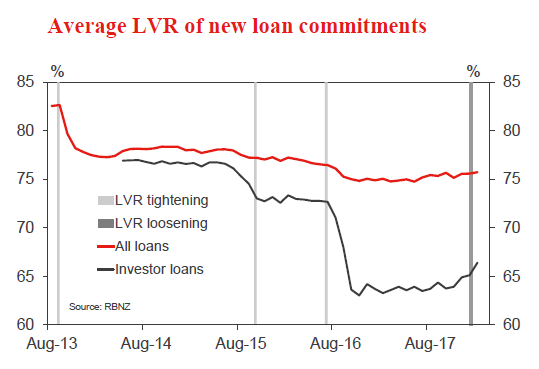
NZ RBNZ Financial Stability Report
May 30
- The RBNZ's six-monthly review of the financial system provides a window of opportunity to review the loan-to- value restrictions on mortgage lending. Last November the RBNZ eased the LVR restrictions, albeit only slightly, and indicated the criteria for a further easing. House price and credit growth would need to slow to more sustainable rates, and the RBNZ would need to be satisfied that an easing wouldn't lead to a resurgence in the housing market.
- House price inflation is running at or below household income growth, and credit growth has slowed. A range of new Government policies aimed at cooling the housing market are in progress.
- Our forecasts assume some further easing of the LVR restrictions over this year. It's quite possible that the RBNZ will move as early as this month, even if it's just an incremental move along the way.
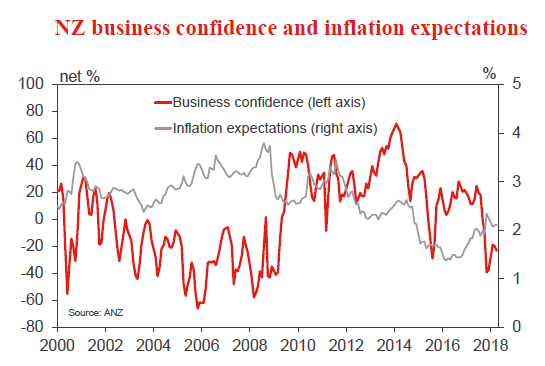
NZ May ANZ business confidence
May 31, Last: -23.4
- Business confidence fell in April, led by a weaker outlook by firms in the construction sector
- The extent of the deterioration in confidence in construction was surprising given the Government's promotion of its Kiwibuild programme and significant housing shortages in the Auckland region. However, it is consistent with other indicators, such as consents, which suggest a lull in building activity in the coming months. It will be interesting to see if the pessimistic outlook of construction firms was maintained in May.
- Inflation expectations were little changed last month despite CPI falling sharply in Q1.
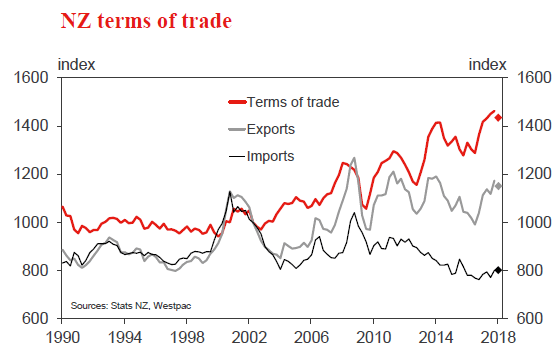
NZ Q1 terms of trade
- Jun 1, Last: 0.8%, WBC f/c: -2.0%, Mkt f/c: x%
The terms of trade reached a new all-time high in 2017. Export commodity prices have held up well, while prices for imported manufactured goods have been trending lower for some time.
We expect the terms of trade to start the new year with a 2% decline, led by a fall in export prices. Prices for dairy, meat and wool were all lower in the March quarter, though we think these declines will be temporary.
We expect import prices to be flat for the quarter. Oil prices rose, but manufactured goods prices are likely to have fallen further, helped by a stronger exchange rate.
US Apr PCE report
- May 31, personal income, last 0.3%, WBC 0.3%
- May 31, personal spending, last 0.4%, WBC 0.5%
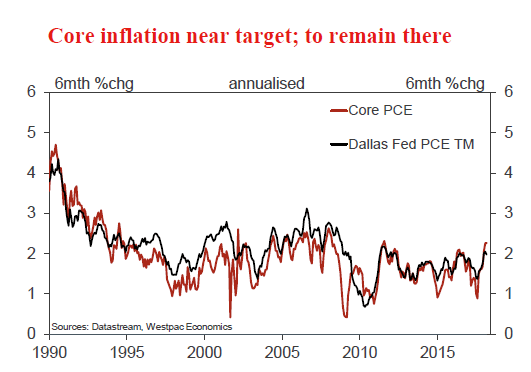
- May 31, core deflator, last 1.9%yr, WBC 1.8%yr
Indicators of wage inflation have been mixed of late, with a clear uptrend yet to be established. We expect some firming over the coming year, but for the employment cost index and other measures to only stabilise around 3.0%yr.
A lack of a material uplift in wages growth and a low savings rate mean that the US consumer is likely to remain constrained. Solid retail sales in the month and further support from services should bring about a decent outcome.
Inflation remains a focus for all in markets. In contrast to the headline CPI at 2.5%yr, measures of PCE inflation remain at or below the 2.0%yr medium-term target. The FOMC expect this trend to persist, and consequently have shown caution towards the pace and extent of rate hikes from here.
US May employment report
- Jun 1, nonfarm payrolls, last 164k, WBC 180k
- Jun 1, unemployment rate, last 3.9%, WBC 3.9%
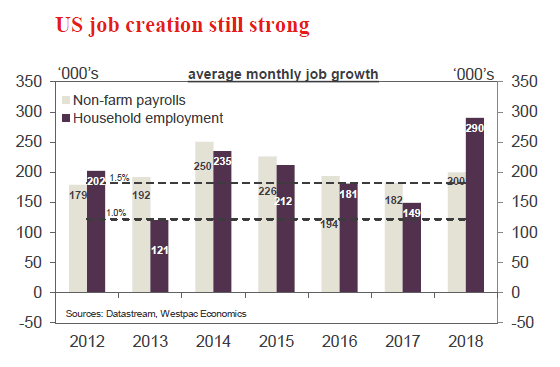
Employment growth remains strong in the US, the yearto- date average being ahead of 2017 and materially above population growth. In coming months, a slight softening is anticipated, bringing 2018 into line with 2017 and 2016.
Still well ahead of population growth, this outcome will see the unemployment rate push lower in coming months from the already historically low 3.9% of April. Importantly, underemployment is also continuing to trend lower, signalling a further taking up of slack in the labour market.
A key reason why this decline in labour market slack has not translated into higher wages growth is because prime-aged individuals outside the labour market continue to return. This is expected to persist over the coming year.
Week Ahead – Dollar Rally Turns to US Jobs Report for Refuelling; Loonie Seeks Direction from BoC and GDP...
US economic data will return to the forefront next week, with the nonfarm payrolls report being the main focal point. The Bank of Canada will be the only major central bank holding a policy meeting, while Canadian GDP figures will keep the loonie under the limelight. The other highlights will come from the Eurozone flash CPI release, Japanese and Australian capex data, and the latest PCE inflation figures out of the US. The week will get off to a slow start though as both US and UK markets will be closed on Monday for a national holiday.
Australian capex eyed for Q1 GDP clue
Investors will be watching key indicators out of Australia next week for clues to first quarter growth as well as to the start of the second quarter. First quarter capital expenditure figures on Thursday will act as a prelude to the quarterly GDP estimate due the following week. Business spending had unexpectedly contracted in the final three months of 2017, weighing on GDP growth. It is forecast to have bounced back by 0.7% quarter-on-quarter in the first three months of this year, which would point to a rebound in growth. Other releases meanwhile will help traders gauge how well the Australian economy performed at the start of the second quarter. Building approvals for April are out on Wednesday and will be followed by private sector lending figures for the same period on Thursday. Positive surprises in next week’s data could give the Australian dollar the impetus it needs to re-challenge this week’s one month high around the $0.76 level.
Across the Tasman Sea, New Zealand terms of trade for the first quarter will provide a barometer for first quarter growth. Following the Reserve Bank of New Zealand’s recent change in stance where it said a rate cut was just as likely as a rate increase, a disappointing set of data could pull the kiwi back towards May’s 5-month lows.
BoC meets but NAFTA complicates outlook
Recent data out of Canada has been mixed, which together with the still uncertain outcome of the NAFTA renegotiation, complicates the Bank of Canada’s rate setting decision on Wednesday. With no timeframe yet as to when the trade talks will conclude, the BoC is unlikely to want to rock the boat and raise interest rates in May, even though there’s been descent progress with inflation accelerating and the labour market improving since the last rate hike in January. There should be some help though for BoC policymakers from new data releases. April producer prices are due the same day, while on Thursday, first quarter GDP numbers will be published (which the BoC should already have its hands on during its meeting).
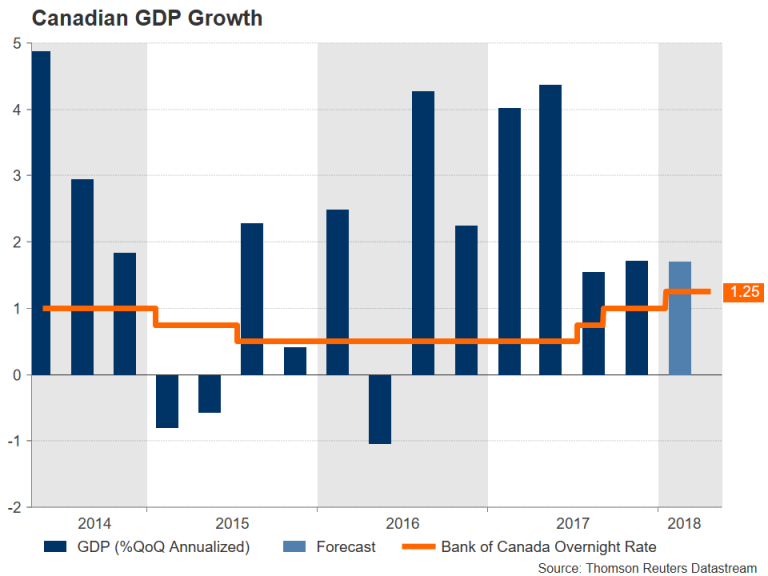
The Canadian economy is forecast to have expanded by 1.7% on an annualized basis in the three months to March, unchanged from the prior quarter’s rate. A stronger figure could prompt the BoC to signal a rate hike at its next meeting in July. A hawkish shift would also help the Canadian dollar break below recent resistance at the C$1.2725 level.
Eurozone inflation expected to bounce back
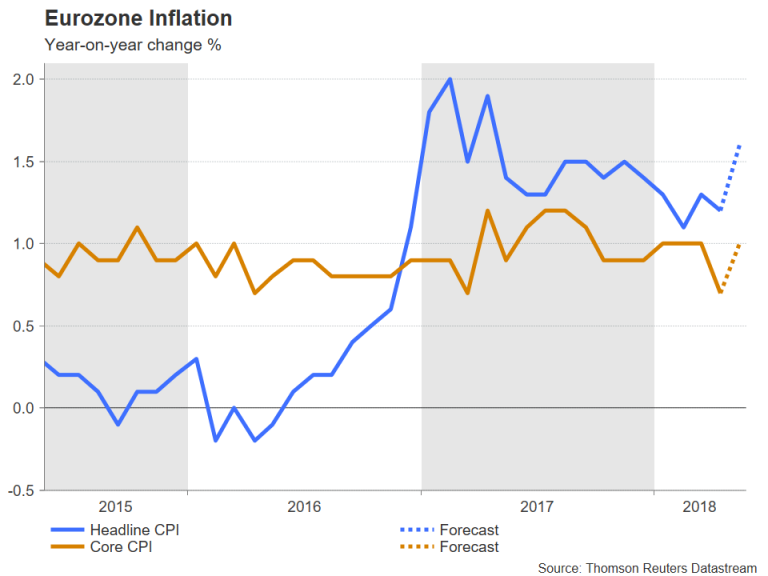
Inflation in the euro area likely turned higher in May, though the degree of any rebound will be under watch as it could determine the pace at which the European Central Bank decides to wind down its stimulus program in upcoming meetings. The preliminary reading for May due on Thursday is expected to show the 12-month CPI rate rising to 1.6% in May from 1.2% in April. The core rate that excludes food, energy, alcohol and tobacco prices, is forecast to firm to 1.0% year-on-year from 0.7% previously. The euro remains susceptible to additional losses if the inflation numbers point to persistent weakness in price pressures. But if the data comes in as expected or stronger, it would add confidence to the ECB’s outlook that inflation will return to the target of just below 2% in the medium term as per the Bank’s latest assessment in the May meeting minutes. Other data out of the Eurozone will include the economic sentiment index on Wednesday and the region’s unemployment rate on Thursday.
Busy week for Japanese data
It will be a fairly packed calendar for Japan next week, though none of the releases are expected to be market moving. The jobless rate for April is out on Monday, to be followed by retail sales on Wednesday and the preliminary industrial output reading on Thursday, also for April. However, Friday’s data on first quarter capital expenditure will probably attract the most attention as it would indicate whether the first quarter GDP data, which showed a bigger-than-expected contraction, is likely to get revised.
China and UK get their turn of the manufacturing PMIs
After this week’s flash releases, Japan, the Eurozone and the US will get the final May manufacturing PMIs next week. But these aren’t expected to attract as much attention as the UK and Chinese PMIs, which will get their first and only release. China’s two measures of the manufacturing PMI from the country’s National Bureau of Statistics (NBS) and Caixin/Markit have been hovering between 50-52 since late 2016. This trend isn’t expected to change in May, highlighting the lack of momentum but also the sustainability of the expansion in the sector during the period. The official NBS manufacturing and non-manufacturing PMIs are due on Thursday, with the Caixin manufacturing PMI coming up on Friday.
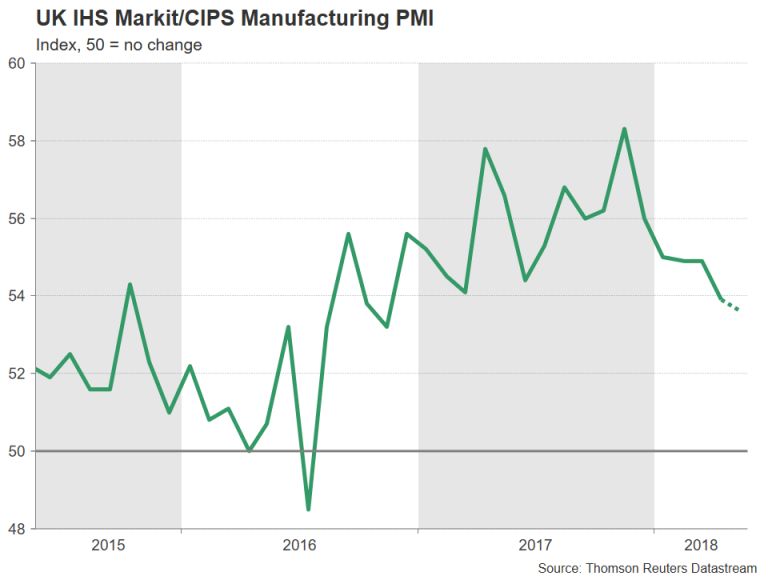
In the UK, like in the Eurozone, there’s been a marked slowdown in manufacturing activity since the start of the year. The index fell to a 17-month low back in April, raising concerns about the depth of the slowdown in UK growth. It is expected to decline further to 53.6 in May from 53.9. A weaker figure would further cut the odds of a Bank of England rate hike by the year-end, which have now fallen to around 75%. There could also be more bad news for the pound if Brexit headlines suggest the UK and the EU are heading for a showdown at the end of June EU summit.
US jobs report and PCE inflation could make or break dollar rally
The US dollar upswing may have lost some momentum this week but there will be plenty of data in the coming days that could provide a lift to fresh multi-month highs. Focus at the start of the week will be on the Conference Board’s consumer confidence gauge. The index is forecast to ease slightly from 128.7 to 128.0 in May. On Wednesday, the second estimate of first quarter growth will be published. GDP growth is expected to remain unrevised at 2.3% on an annualized basis.
The personal consumption expenditures (PCE) report will be the highlight on Thursday, as it will include the Fed’s favourite inflation measure. Personal income and consumption are both forecast to maintain the prior month’s pace of growth, increasing by 0.3% and 0.4% respectively in April, in a further sign the US economy remains well supported by rising household incomes and spending. However, despite the solid fundamentals, inflationary pressures look set to remain moderate for yet another month. The core PCE price index is expected to miss the Fed’s 2% inflation target once more, slipping to 1.8% y/y from 1.9% before.
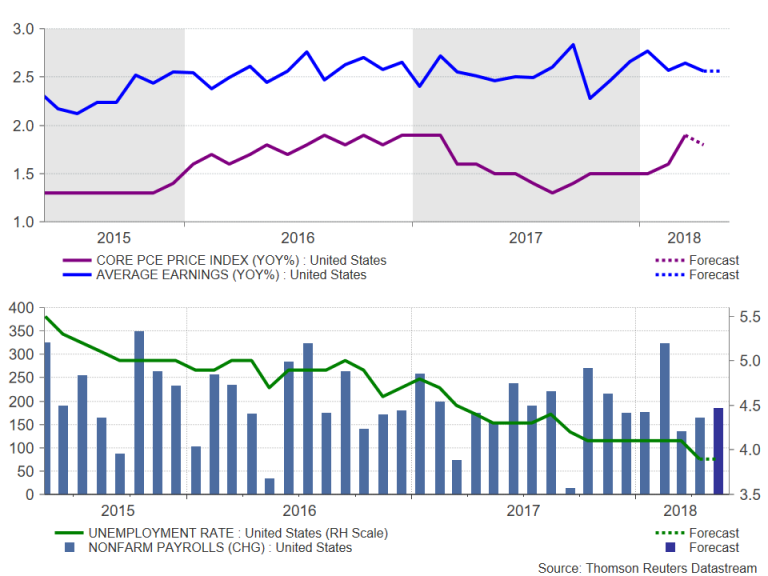
Friday’s nonfarm payrolls report will round up the week and be eyed by investors for fresh evidence of wage pressures. The US economy is expected to add 185k jobs in May, improving on April’s figure of 164k. The jobless rate is forecast to remain unchanged at a 17½-year low of 3.9% and average hourly earnings are also anticipated to stay steady at 2.6% y/y in May. A stronger wage reading could invite the dollar bulls back into the market, driving dollar/yen back above the key 111 level. Another important item on the calendar on Friday is the ISM manufacturing PMI. The index is forecast to increase in May, from 57.3 to 58.4.
Weekly Focus: Politics Still Setting the Tone
Market Movers ahead
- In the US, the jobs report for May is in focus, with average hourly earnings as the most interesting part.
- In the euro area, we look for a rebound in HICP inflation in May, while Italian political developments will also be in the spotlight.
- In Japan, labour market data for April is on the agenda, which will be important for the outlook for wages and private consumption.
- In the Scandies, we will get more insight into the Q1 growth figures.
Global macro and market themes
- The new Italian government implies market uncertainty for now, but we do not see the debt issue leading to a new euro crisis.
- USD strength could stick around near term as the US still holds a favourable cyclical position, but should abate further out.
- Emerging markets are set to remain wobbly near term, although we do not see a contagious situation. However, the dust has not settled in Turkey yet.
Sunset Market Commentary
Markets
Today, the rally in core bond markets continued. Both fundamental and technical considerations were in play. Uncertainty on Italy continues supporting a bid for safe haven German Bunds. However, Italy isn’t the only factor of uncertainty for European investors to worry about. In Spain, PM Rajoy is also at risk of losing the support in Parliament. The centrist party, Ciudadanos, is said to consider a no confidence vote. Spreads on Spanish bonds also widened on this growing political event risk. On the German/safe haven side of the equation, German bunds already had a strong run this week and came close to important technical levels. Those levels (160 area in the Bund contract and 0.47% in German 10-y yield) were broken today, triggering a broader sharp stop loss repositioning of investors being positioned ‘short Bunds’. US yields follow the rally of their German counterparts. A further correction in the oil price eases inflation fears and probably added to the bond-friendly sentiment in the US. This time, the data were not the blame. German Ifo business confidence was close expectations. So, contrary to what was the case for several other EU sentiment indicators of late, the Ifo at least didn’t provide any additional negative surprise. Headline US durable orders missed consensus expectations, but the underlying series (ex transportation and shipments) were good. At the time writing US yields decline up to 5.5 bps, the 5/10y sector outperforming. The rally of German bunds is even more impressive with yields declining between 3.5 bps and 8 bps. The German 10-y dropped below 0.40%. Peripheral yield spreads versus Germany also show an aggressive blow-out. Spanish, Italian Portuguese and Greek 10-year spreads all widen about 17-20 bps.
The tension as mirrored on the European bond markets are also affecting the single currency. EUR/USD yesterday failed to move away from this week lows. The negative headlines from Italy and Spain triggered a new euro selling wave pushing EUR/USD to a new 2018 low. EUR/USD currently trades in the 1.1660 area. That said, the correction in the euro remains orderly, especially taking into account the sharp repositioning on the (intra-)EMU bond markets. At the same time to dollar looks also quite solid. USD/JPY is holding near the recent lows (currently trading in the low 109 area). However, the yen is making little additional progress against the dollar. So, the dollar probably attracts at least part of the safe have flows moving out of Europe ahead of the weekend.
Today, sterling continued to trade rather weakish. EUR/GBP hovered in the mid 0.87 area. So, the UK currency hardly profited from negative political headlines weighing on the single currency. Yesterday’s comments from BoE government Carney that the BoE could return to a stimulating monetary policy in case of a disorderly Brexit maybe still weighed on the UK currency. The broader USD rally pushed cable back to the 1.3325 area.
News Headlines
In the US, headline durable goods orders disappointed (-1.7% vs. -1.3% expected). However, underlying measures (excluding transportation and shipments) beat consensus thus contributing more to GDP than previously anticipated.
The Spanish Socialist party registered a no-confidence vote against PM Rajoy after his former aides were convicted for corruption but the proposal requires the Ciudadanos party’s backing. The latter also to considers an alternative vote against Rajoy unless he calls for new elections.
The German IFO-sentiment indicator came in close to expectations. The expectations-component (98.5) edged a little lower compared to previous month, while business climate (102.2) and current assessment (106.0) ticked higher.
US: Aircraft Turbulence, but Durable Goods Orders Trending Up
Durable goods orders fell 1.7 percent in April on a drop in aircraft. Transportation orders have been picking up on net, however, while core capital goods orders are also improving.
Beyond April's Drop in Aircraft, Signs of Strengthening Orders After two months of solid gains, durable goods orders reversed course in April. Orders fell 1.7 percent, which was a bit worse than consensus expectations for a 1.3 percent pullback and more closely in line with our forecast for a 2.0 percent drop.
Per usual, the sharp move over just one month can be traced to aircraft. Transportation orders fell 6.1 percent as aircraft orders plunged nearly 30 percent. New orders for motor vehicles and parts, on the other hand, notched a 1.8 percent gain, which was the sector's seventh consecutive monthly increase.
While the volatility of transportation orders often leads us to focus on other sectors on a monthly basis, it is important to not lose sight of the forest from the trees. Through the month-to-month volatility, transportation has been a bright spot in investment spending of late. Year-to-date, transportation spending is up 9.0 percent compared to 7.3 percent ex-transportation. Unfilled orders for motor vehicles & parts are at record highs, while backlogs for nondefense aircraft have been rising over the past year and are only a touch below their 2014 high-water mark. Given the fairly long lead times of transportation orders—specifically aircraft orders—the sector should help underpin a decent rate of equipment spending in the coming quarters.
Ex-transportation, orders have gained some steam since the start of the year and were up 0.9 percent in April. Nondefense capital goods orders exaircraft, our preferred gauge of business spending, also look to be emerging from an early-year slump. Core orders rose 1.0 percent last month. Despite a half-point downward revision to March, core orders have improved to a 6.3 percent three-month average annualized pace. Orders for metals, machinery and electrical equipment have all strengthened since the start of the year. The pickup in core orders suggests equipment spending should continue to rise in Q2 despite nondefense capital goods shipments getting off to a rough start and declining 4.6 percent in April.
Meet in the Middle
More recent readings on the manufacturing sector suggest growth has held up through the second month of the quarter. Four of the regional Fed manufacturing PMIs have already been released for May, and all showed growth accelerating from April. Such broad-based improvement points to the nationally representative ISM manufacturing index also rising in May.
That, however, still leaves a fairly wide gap between the strength indicated by "soft" survey data and the "hard" numbers on orders. We expect to see some meeting in the middle. While business spending is not likely to grow at the booming rate indicated by the PMIs, we anticipate equipment spending will strengthen in the second quarter from the 4.7 percent clip registered in the first quarter.
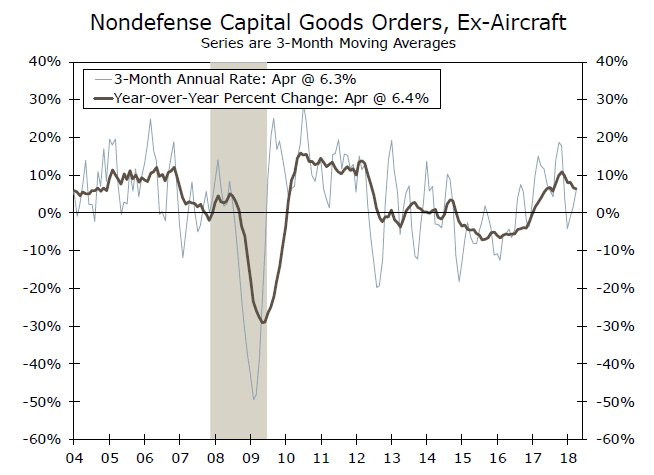
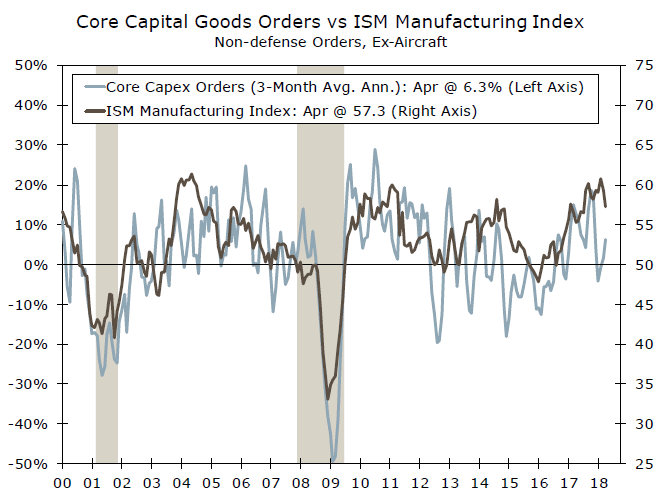
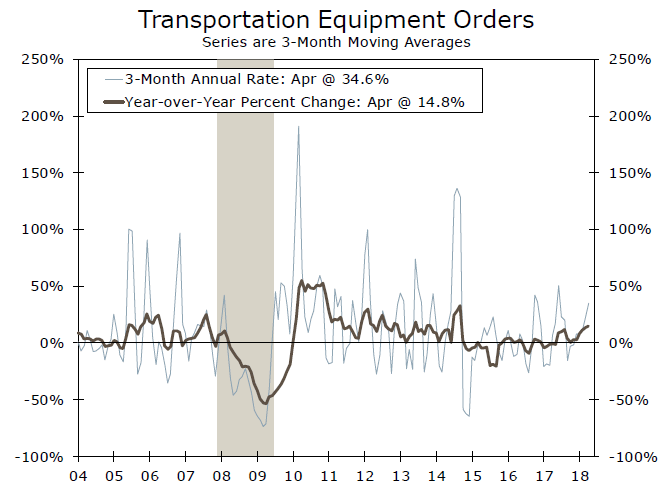
Gas Oil Futures Hit All-Time High; Bullish in Short and Medium-Term
London gas oil futures for June delivery (GSOIL) have been running inside an ascending channel since mid-February, touching an all-time high of 704.13 on May 17. While the rally has stalled since then, with the price set to close at 10-day lows today, the market continues to hold far above the Ichimoku cloud and its moving averages, which are positively sloped, signaling that upward pattern is not near to end. Momentum, though, could weaken in the short-term should the RSI continue to head downwards and the MACD deviate further below its red signal line.
On the downside, the 20-day simple moving average standing at 675.38 could challenge bears as the line has acted as a barrier several times in the past. Therefore, any break below the 20-day SMA could strengthen negative momentum towards the lower bound of the channel around the 665 key-level which coincides with the 23.6% Fibonacci of the upleg from 538.38 to 704.13. In case this fails to hold, the next target could be the 38.2% Fibonacci of 640.60.
Alternatively, a move to the upside could meet the 700 round level before a retest at the peak of 704.13. Even higher, the upper bound of the channel seen around 715 could offer resistance as well.
In the medium-term, the outlook is expected to remain positive as long as the market continues to trade above the 50-day MA currently at 643.97.
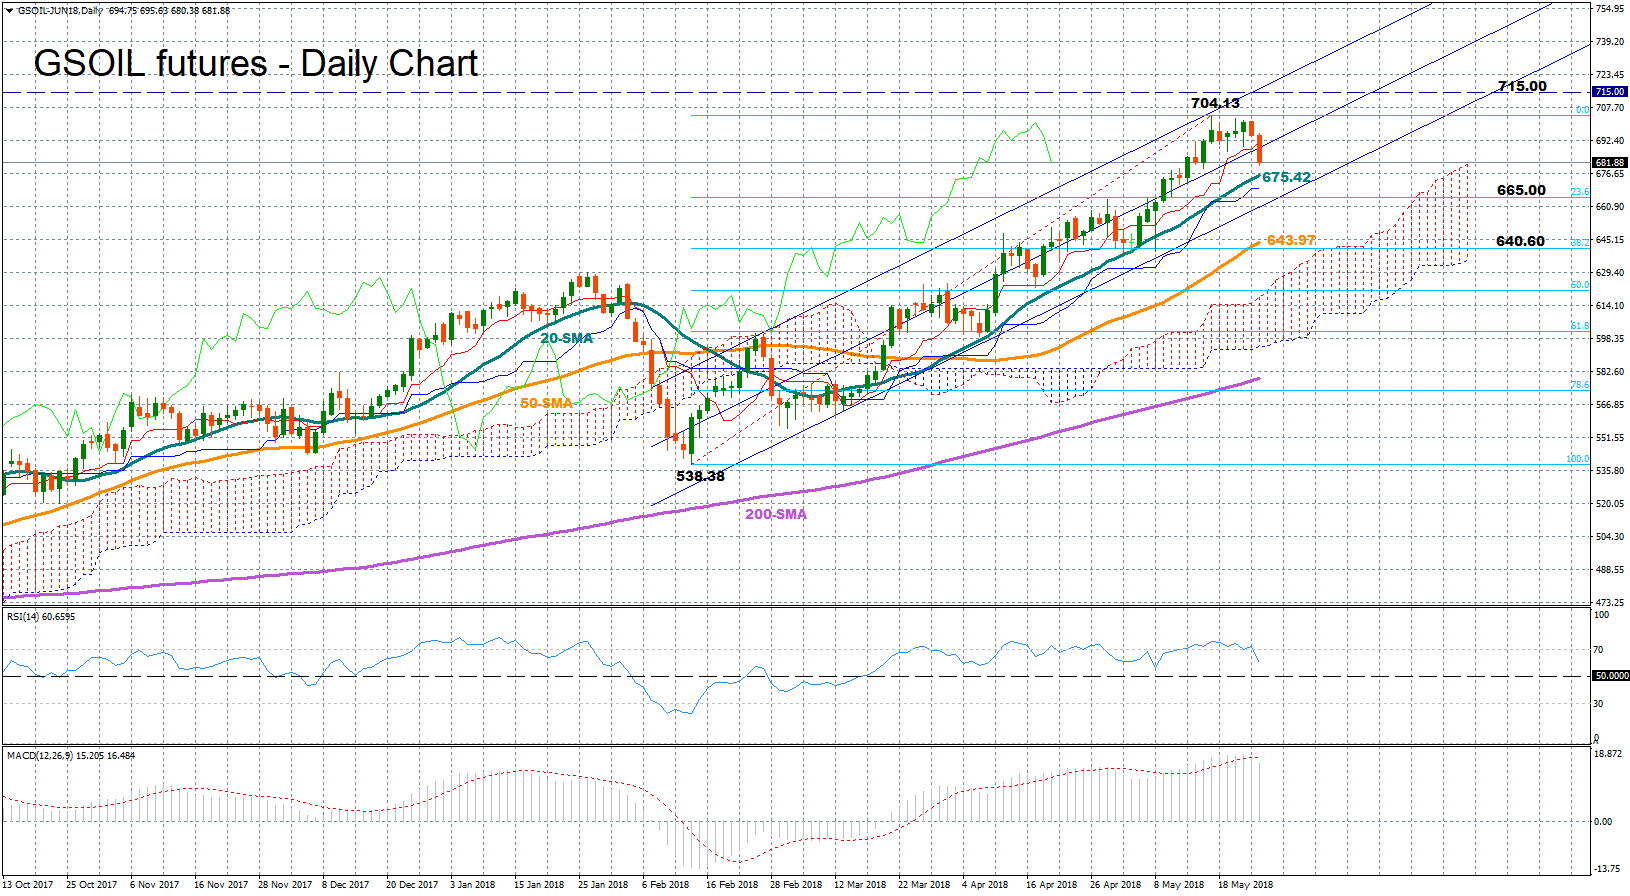
Euro selloff accelerates as German 10 year bund yield breaks 0.4%
Euro's selloff accelerates further as German 10 year bund yield breaks 0.4 handle, reaching as low as 0.389 so far.
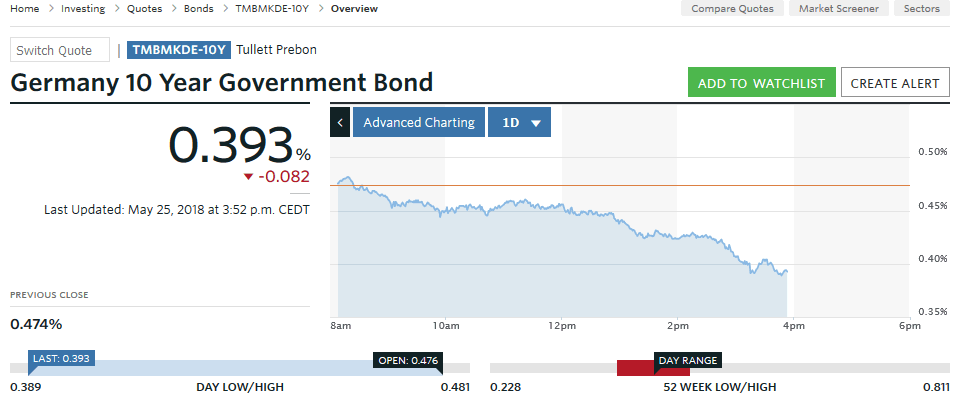 Chart snapshot from MarketWatch
EUR/JPY reaches as low as 127.14 and moves further away from medium term channel support. Based on current momentum, there now a realistic threat of breaking 38.2% retracement of 109.03 to 137.49 at 126.61. That would carry rather bearish medium term implication. We'll see how it goes.