Sample Category Title
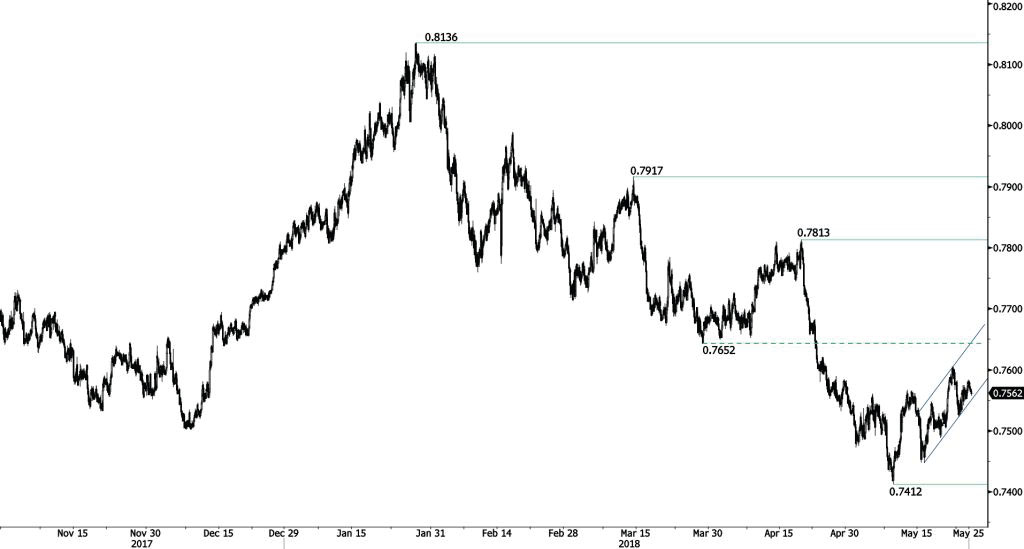
AUD/USD Riding Uptrend-Line
AUD/USD's moving higher along trendline. Hourly support and resistance remain at 0.7412 (09/05/2018 low) and 0.7813 (19/04/2018 high). The technical structure suggests short-term increase.
In the long-term, the upward trend slows down after failing to reach key resistance at 0.8164 (14/05/2015 low). Key support stands at 0.6009 (31/10/2008 low). A break of the key resistance at 0.8164 (14/05/2015 high) is needed to invalidate our long-term bearish view.
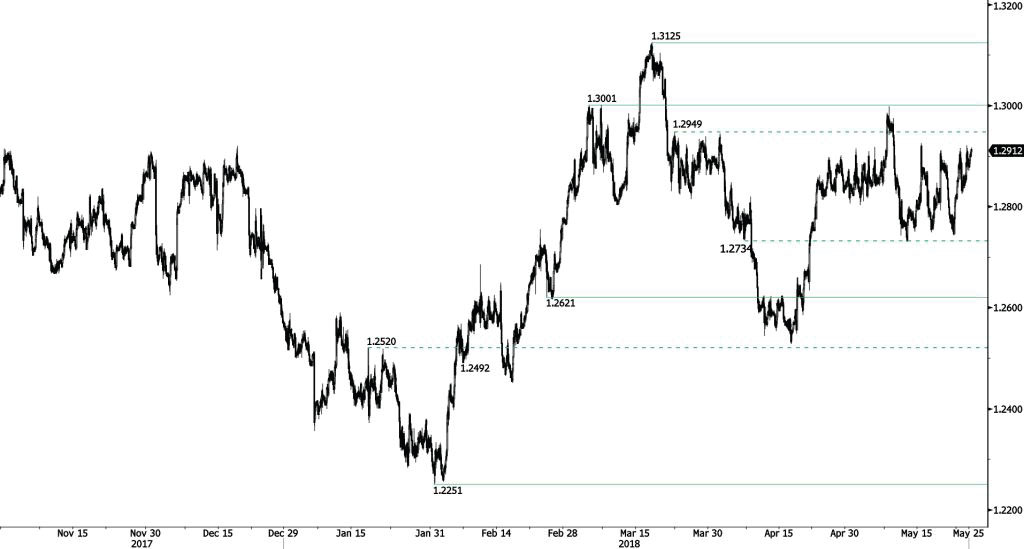
USD/CAD Regains Bullish Momentum
USD/CAD continues to improve as can be seen by the bullish move above minor resistance at 1.2915. Hourly support and resistance are given at 1.2621 (23/02/2018 low) and 1.3001 (05/03/2018 high). The technical structure suggests short-term upward moves.
In the longer term, the pair is trading between resistance point at 1.3805 (05/05/2017 high) and support at 1.2128 (18/06/2015 low). Strong resistance is given at 1.4690 (22/01/2016 high). The pair is likely to head lower. The pair is trading above its 200 DMA.
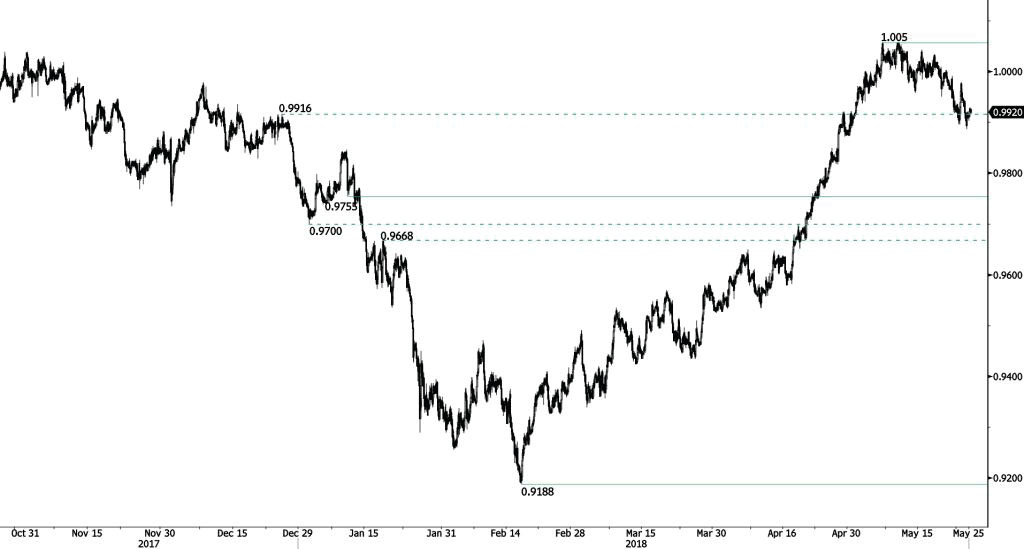
USD/CHF Consolidation
USD/CHF's has broken the support at 0.9916 (26/12/2017 high), validating a bearish reversal pattern with a downside risk at 0.9755. Key support and resistance given at 0.9755 (10/01/2018 low) and 1.0091 (09/05/2017 high) are maintained. The technical structure suggests short-term sideways trading moves.
In the long-term, the pair is still trading in range since 2011 despite some turmoil when the SNB unpegged the CHF. Key support lies at 0.9072 (07/05/2015 low) while resistance at 1.0344 (15/12/2016 high) is distanced. The technical structure favours a long term bullish bias since the unpeg in January 2015.
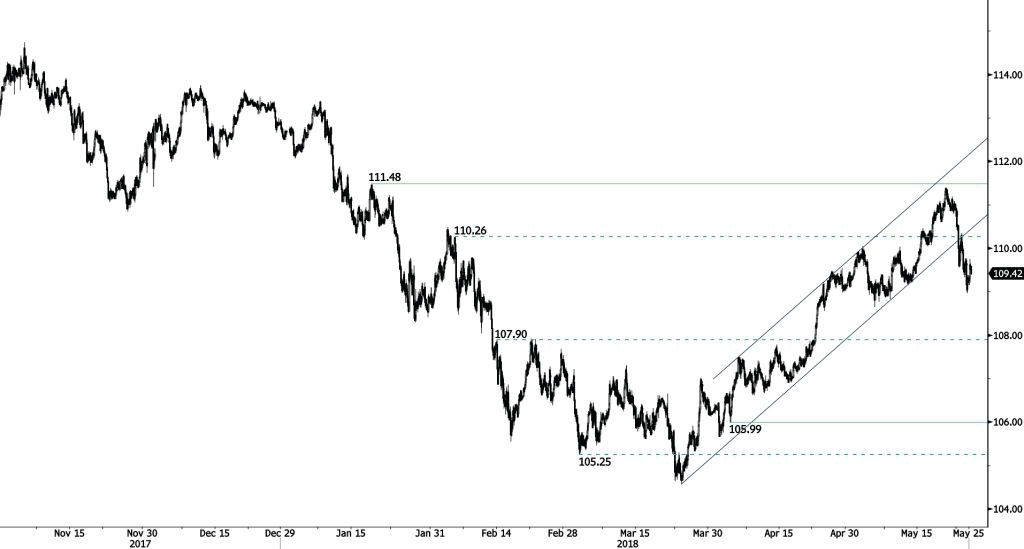
USD/JPY Bearish Pause
USD/JPY has breached the key uptrend support at 110.15. The short-term technical structure is negative. Strong support and resistance are located at 108.74 (25/01/2018 low) and 111.48 (18/01/2018 high). The technical structure suggests short-term sideways trading moves.
We favor a long-term bearish bias. Support remains at 101.20 (09/11/2016 low). A gradual rise toward the major resistance at 125.86 (05/06/2015 high) seems unlikely. Expected to decline further support at 101.20 (09/11/2016 low). The pair trades slightly above its 200 DMA.
GBP/USD Trying To Bounce
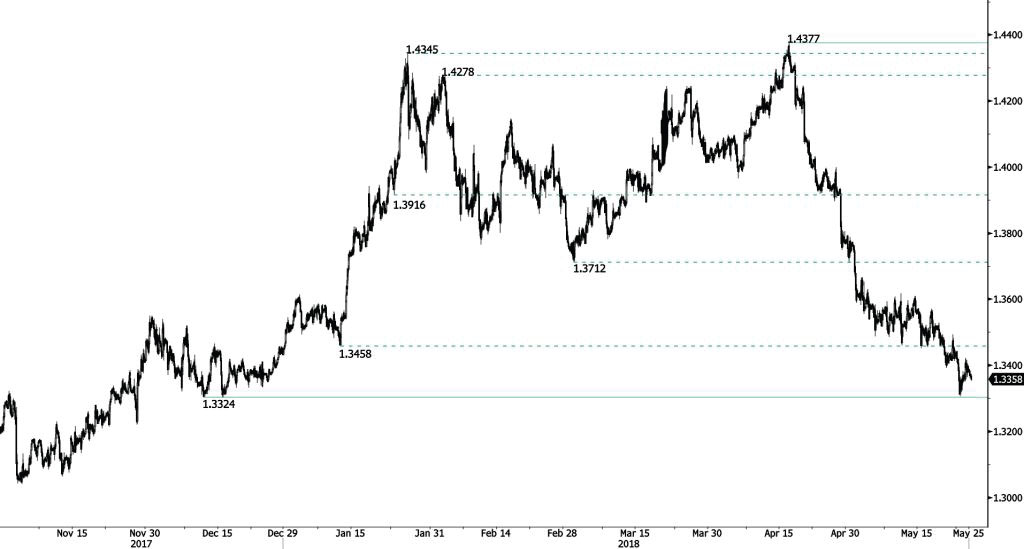
GBP/USD is trying to bounce near the 1.03324 strong support. Hourly support and resistance are given at 1.3324 (19/12/2017 low) and 1.3458 (11/01/2017 low. The technical structure suggests further downside.
The long-term technical pattern is reversing. The Brexit vote had paved the way for further decline but the pair is moving to 2016 highs. Long-term support and resistance are given at 1.1841 (07/10/2017 low) and 1.5018 (24/06/2016 high).
EUR/USD Weak
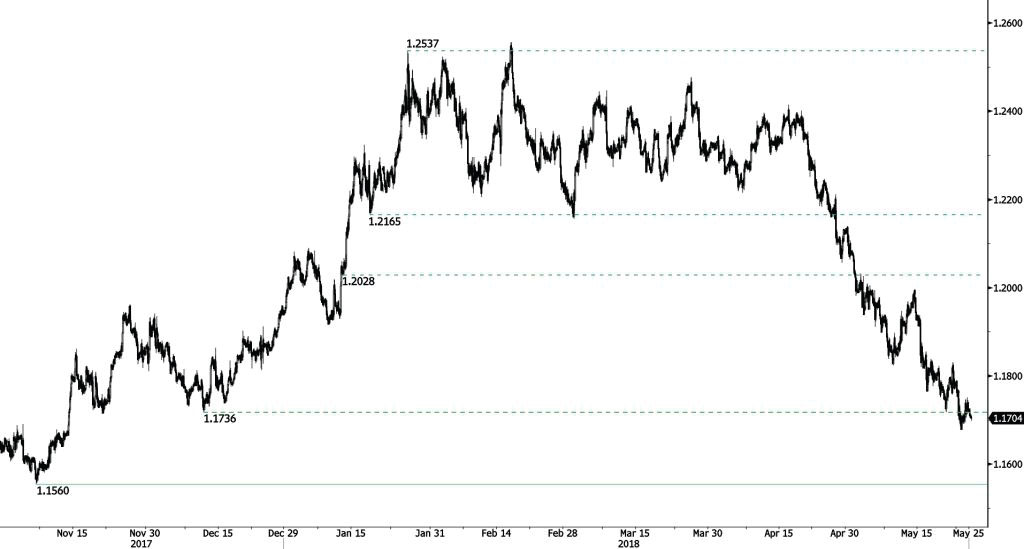
EUR/USD recovery bounce was short lived suggesting persistent selling pressure. The short-term technical structure is negative as long as prices remain below the hourly resistance at 1.2036 (11/01/2017 low). Next key support and resistance are now given at 1.1560 (07/112017 low) and 1.2323 (17/01/2018 high).
In the longer term, the momentum is turning largely negative. We favor a continued bearish bias. Key resistance is holding at 1.2886 (15/10/2014 high) while strong support lies at 1.1554 (08/11/2017 low).
GBPJPY More Negative Tendency Is Expected, Holds Near 11-Week Low
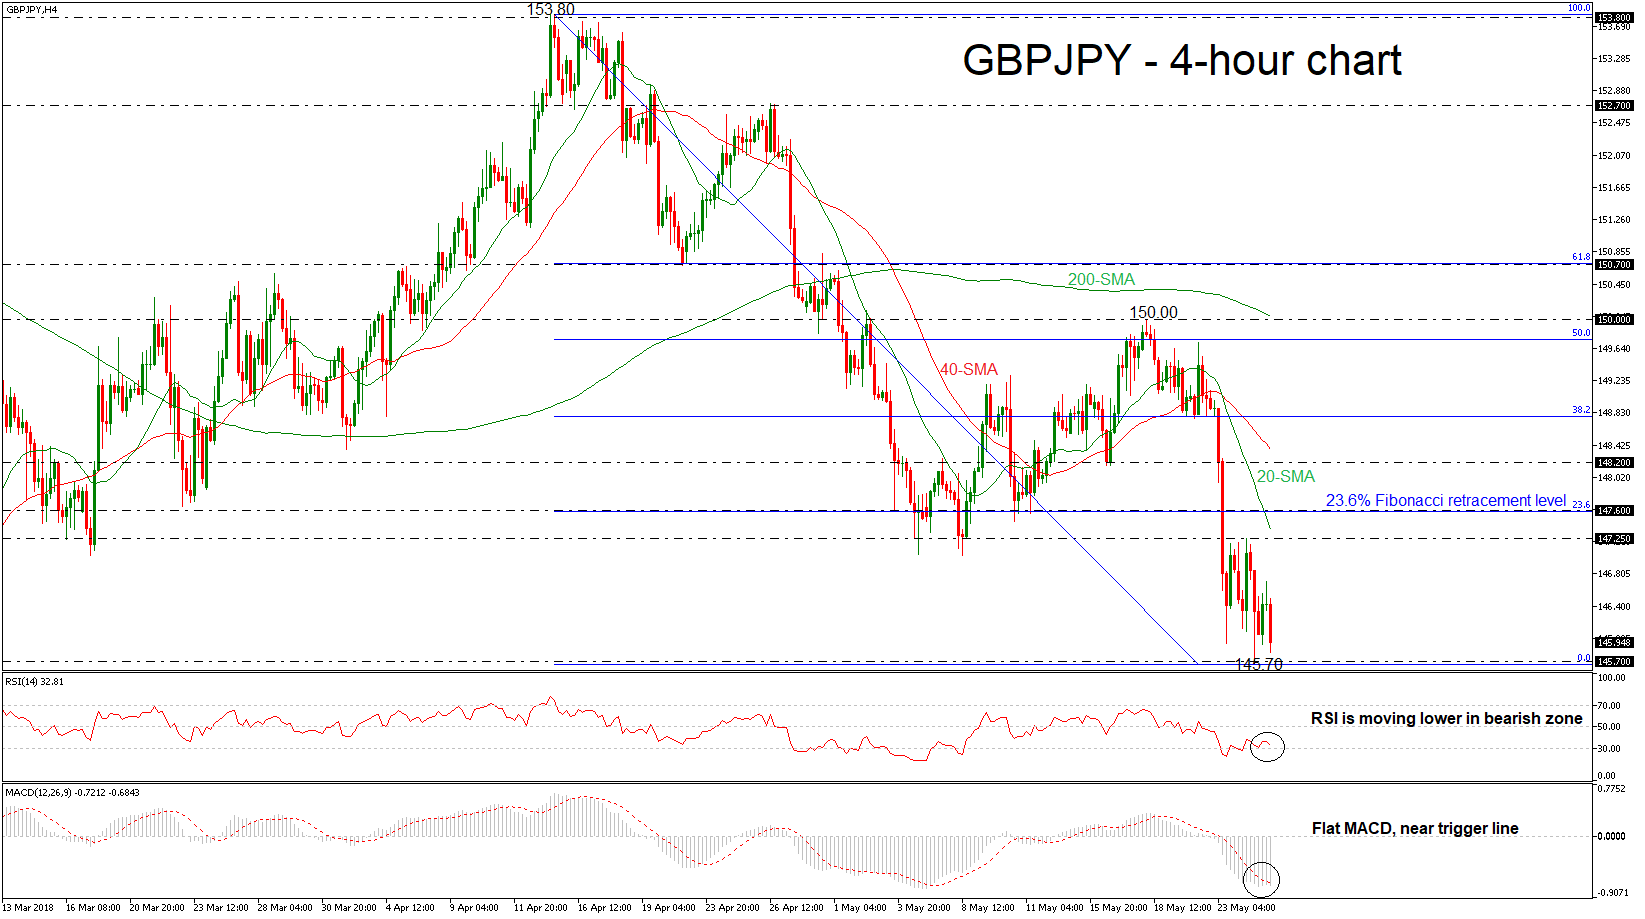
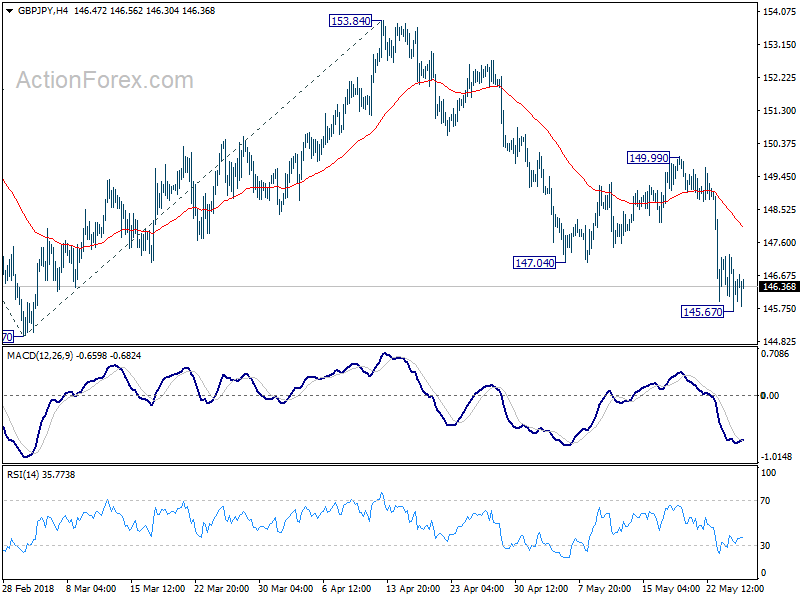
GBPJPY completed five straight negative days with strong momentum, while during Friday’s session the price is paring some losses. On Thursday, the pair recorded a fresh 11-week low of 145.67 and is trading slightly higher from this trough. The neutral to bearish picture in the short term looks to last for a while longer after prices failed to break below 145.67 over the last couple of sessions in the 4-hour chart.
From the technical point of view, the negative bias is supported by the deterioration in the RSI indicator. The index is sloping slightly to the downside in the negative zone, however, the MACD oscillator is flattening near its trigger line below the zero line.
If prices continue to head lower, support should come from the 145.70 support level. A drop below this area would reinforce the short-term bearish view and open the way towards the 145.00 psychological level, which has been a major support area in the past.
However, should an upside reversal take form, immediate resistance will likely come from the 147.25 barrier. A break above this level could open the way for a bullish correction, with the next resistance coming from the 23.6% Fibonacci retracement level of 147.60 of the downleg from 153.80 to 145.70.
Overall, GBPJPY has been trading well below the 20- and 40-simple moving averages (SMAs) in the near term, signaling that the bearish structure will continue.
AUDUSD Outlook: Bullish Signal From Inverse Daily H&S But Thick Weekly Cloud Weighs
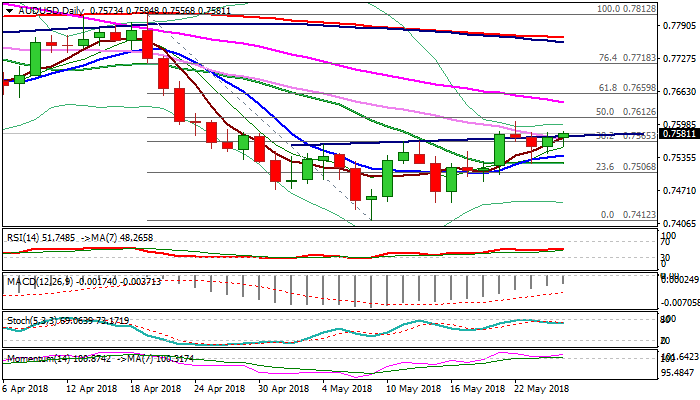
The Aussie dollar edged higher on Friday and retests highs of past two days at 0.7582, underpinned by formation of 5/30SMA bull-cross and keeping in play bullish bias on daily chart. Strong bullish momentum also supports scenario as weekly close above cracked neckline of inverse H&S pattern would generate bullish signal for extension of recovery from 0.7412 (09 May low, the lowest since 02 Jun 2017). Initial barrier lies at 0.7605 (22 May high), break of which would expose 0.7642 (falling 55SMA) and 0.7660 (Fibo 61.8% of 0.7812/0.7412 fall). Thick weekly cloud (0.7641/0.7749) weighs and could limit stronger recovery attempts. Conversely, softer tone could be expected on repeated close below falling 30SMA, while return below 20SMA (0.7523) will be bearish.
Res: 0.7605, 0.7642, 0.7660, 0.7682
Sup: 0.7572, 0.7539, 0.7523, 0.7502
GBP/JPY Daily Outlook
Daily Pivots: (S1) 145.50; (P) 146.38; (R1) 147.08; More...
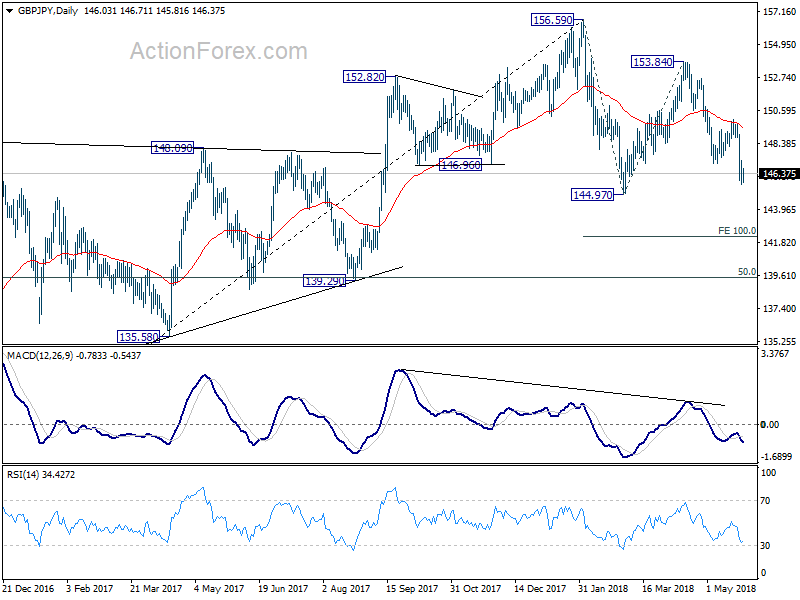
GBP/JPY edged lower to 145.67 but there was no follow through selling yet. Intraday bias stays neutral first and some more consolidative trading could be seen. Upside of recovery should be limited well below 149.99 resistance to bring fall resumption. Below 145.93 will target 144.97 low first. Break there will resume the fall from 156.59 and target 100% projection of 156.59 to 144.97 from 153.84 at 142.22 next.
In the bigger picture, for now, we're treating price actions from 156.59 as a corrective move. Therefore, while deeper fall is expected, strong support should be seen above 139.29 cluster support (50% retracement of 122.36 to 156.59 at 139.47) to contain downside and bring rebound. There is still prospect of extending the rise from 122.36. However, considering that GBP/JPY failed to sustain above 55 month EMA (now at 153.94), firm break of 139.29 will confirm trend reversal and turn outlook bearish.
USDJPY Outlook – The Downside Would Remain At Risk While 20SMA Caps
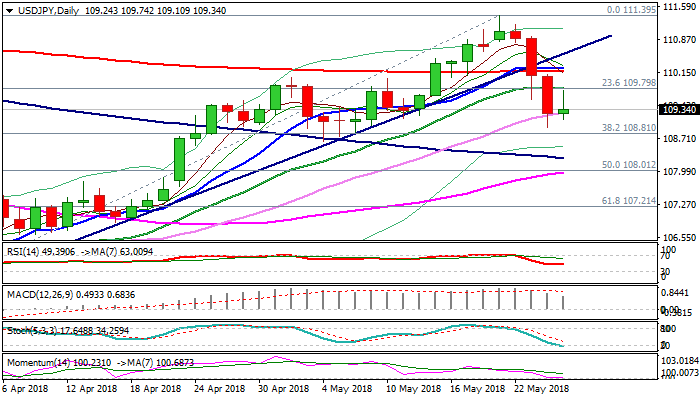
The pair consolidates above new two-week low at 108.95, posted on Thursday after strong three-day fall from 111.39 high.
Upside attempts stalled just under 20SMA in Asia (109.82) with subsequent fall hitting European session low at 109.35 and signaling the downside remains vulnerable.
Further risk aversion signals could drive the pair towards pivotal supports at 108.81 (Fibo 38.2% of 104.63/111.39 ascend) and 108.64 (04 May trough), loss of which would spark stronger bearish acceleration.
Bearishly aligned 10/20SMA’s and momentum, support the notion, but close below cracked rising 30SMA (109.26) is needed to confirm.
Bearish bias is expected to remain intact while 20SMA caps, while break higher would sideline immediate downside risk, but would face further strong headwinds from next barriers at 110.16/24 (converged 200/10SMA’s).
Res: 109.82, 110.16, 110.24, 110.52
Sup: 109.26, 108.95, 108.81, 108.64