Sample Category Title
USDJPY Consolidates Below New 4-Mth High, Bullish Bias Above 200SMA
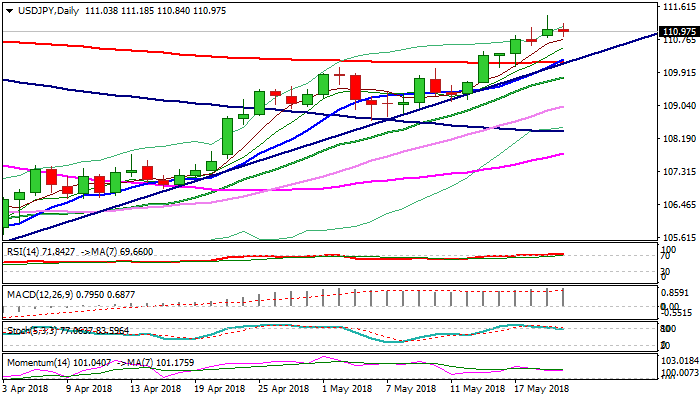
The pair holds within narrow consolidation on Tuesday after spiking to new four-month high at 111.39 on Monday.
Overall bullish structure is reinforced by formation of 10/200SMA golden cross, however, the pair may hold in extended consolidation, with deeper downticks not ruled out, before bulls resume.
The notion is supported by reversal of slow stochastic from overbought territory.
Rising 5SMA offers immediate support at 110.77, while stronger dips are expected to find ground above key supports at 110.30/23 (trendline support / 200SMA).
Bulls keep in focus targets at 111.96 (weekly cloud base) and 112.35 (Fibo 76.4% of 114.73/104.63 descend).
Negative scenario requires close below 200SMA to delay bulls for stronger correction.
Res: 111.18, 111.48, 111.96, 112.35
Sup: 110.77, 110.55, 110.30, 110.23
GBPUSD – BoE Speakers And Inflation Report Eyed For Fresh Signals
Cable retests former key support at 1.3451 on acceleration higher in early Europe, after eventual break and close below two-week range on Monday.
Fresh bears were boosted by fears of snap election in autumn and hit new five-month low at 1.3390 on Monday, but Foreign Minister Johnson ruled out speculations.
Pound stands at the back foot as close below 1.3451/42 (former range floor/Fibo 38.2% of 1930/1.4376 rally) was strong bearish signal which needs confirmation on repeated daily close below, to signal continuation of steep descend from 1.4376 (post-Brexit recovery peak).
Overall bearish outlook is partially offset by strong momentum and keeping the downside limited.
Speeches of BoE Governor Carney and other three MPC members as well as UK Inflation report are key events for pound today.
Bearish signal would be generated on repeated close below 1.3451/42 pivots, which would open way towards higher base at 1.33 zone (Dec 2017).
Conversely, bears could be delayed on close above 1.3451, but close above 10SMA (1.3503) is needed to confirm and expose next strong barrier at 1.3560 (200SMA).
Res: 1.3482, 1.3503, 1.3560, 1.3589
Sup: 1.3412, 1.3390, 1.3354, 1.3302

GBP/JPY Daily Outlook
Daily Pivots: (S1) 148.74; (P) 149.20; (R1) 149.59; More...
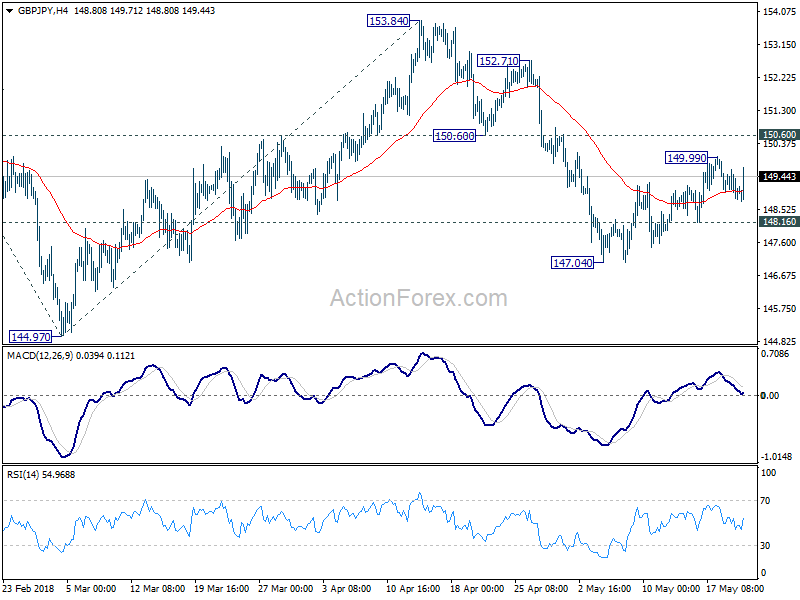
Intraday bias in GBP/JPY remains neutral at this point. Corrective recovery from 147.04 could still extend higher. But upside should be limited below 150.60 support turned resistance to bring decline resumption. On the downside, break of 148.16 will turn bias to the downside for 147.04 and then 144.97. Decisive break of 144.97 will resume the fall from 156.59 and target 100% projection of 156.59 to 144.97 from 153.84 at 142.22 next.
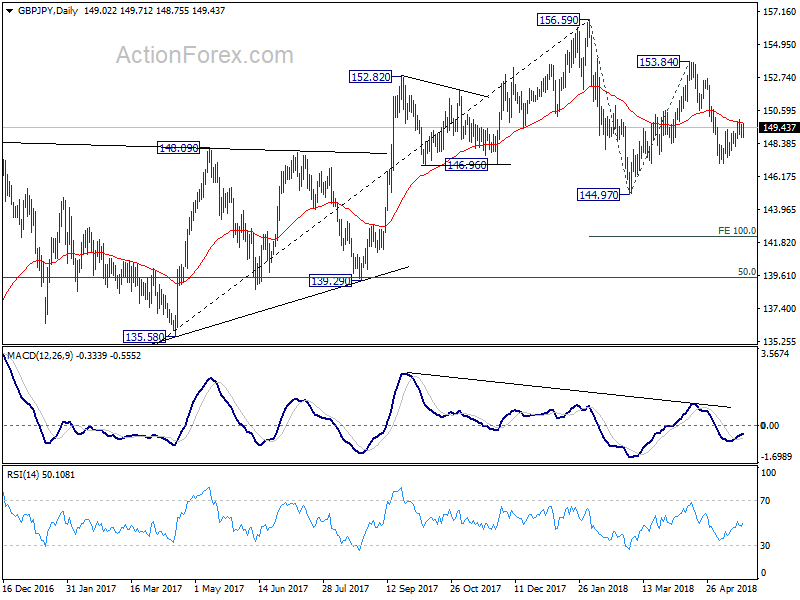
In the bigger picture, for now, we're treating price actions from 156.59 as a corrective move. Therefore, while deeper fall is expected, strong support should be seen above 139.29 cluster support (50% retracement of 122.36 to 156.59 at 139.47) to contain downside and bring rebound. There is still prospect of extending the rise from 122.36. However, considering that GBP/JPY failed to sustain above 55 month EMA (now at 153.94), firm break of 139.29 will confirm trend reversal and turn outlook bearish.
USD/JPY Progressive Zig-Zag Potentially Targeting 111.60
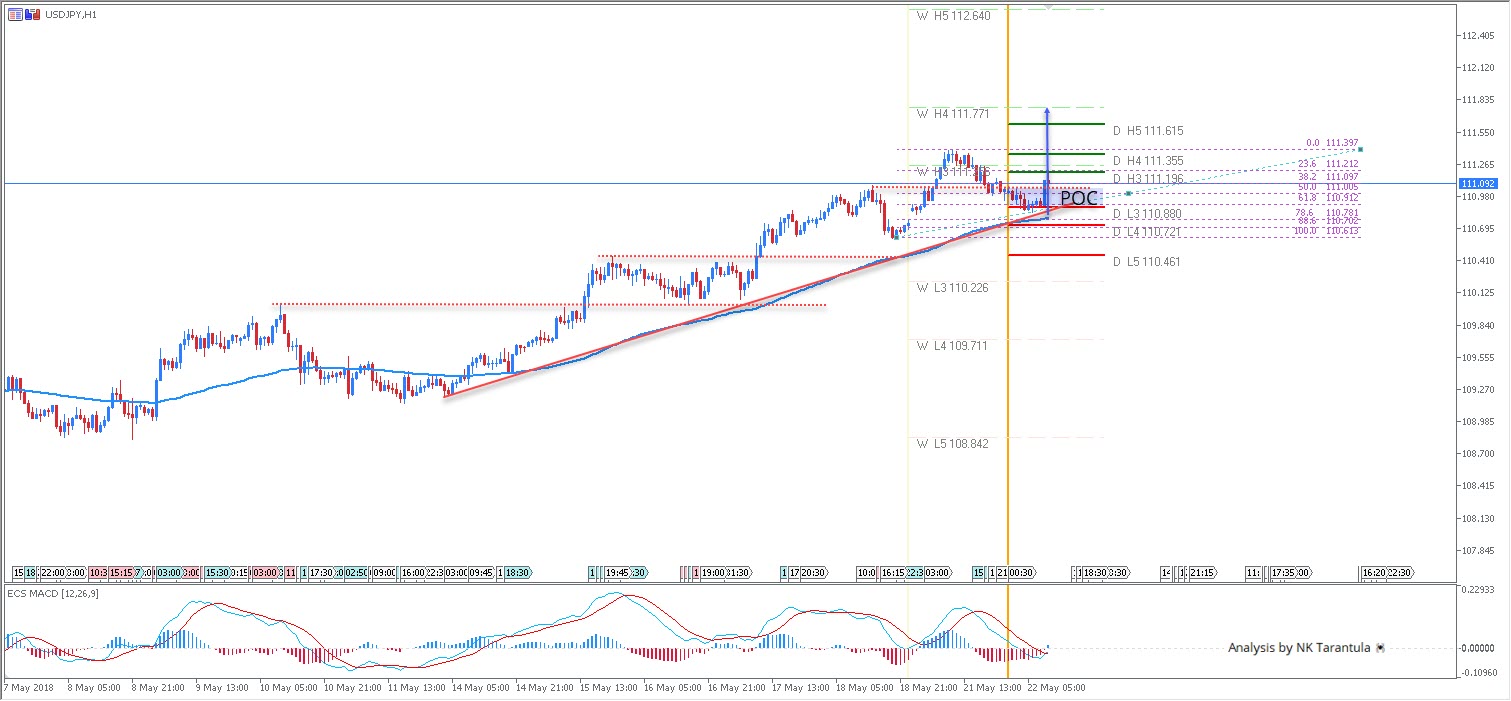
The USD/JPY has formed a progressive Zig-Zag pattern and at this point it seems like bullish momentum is shaping up for a new push higher. 110.90-111.05 is the POC zone and if the price manages to stay above 110.70 we might see higher levels. Next targets are 111.35, 111.61 and 111.77. Watch for a potential bounce from the POC zone.
W L3 - Weekly Camarilla Pivot (Weekly Interim Support)
W H3 - Weekly Camarilla Pivot (Weekly Interim Resistance)
W H4 - Weekly Camarilla Pivot (Strong Weekly Resistance)
D H4 - Daily Camarilla Pivot (Very Strong Daily Resistance)
D L3 – Daily Camarilla Pivot (Daily Support)
D L4 – Daily H4 Camarilla (Very Strong Daily Support)
POC - Point Of Confluence (The zone where we expect price to react aka entry zone)
EUR/JPY Daily Outlook
Daily Pivots: (S1) 130.50; (P) 130.75; (R1) 131.18; More....
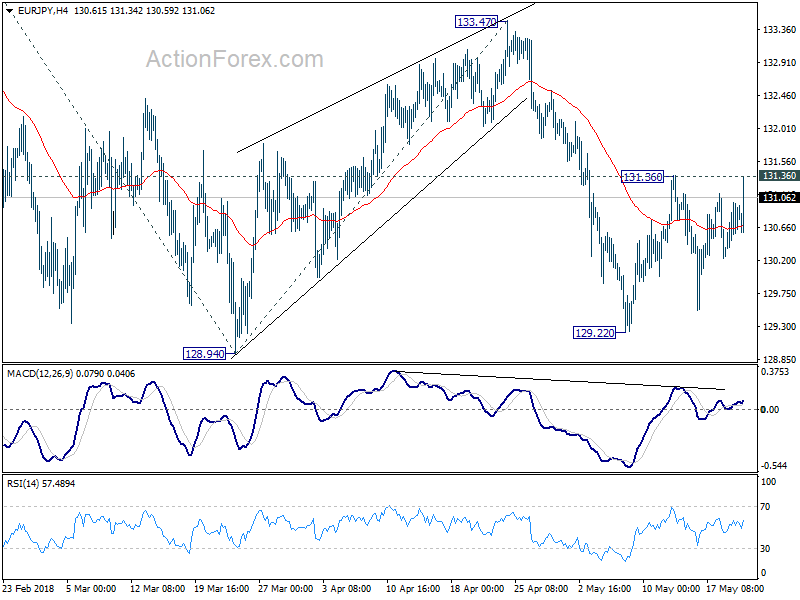
EUR/JPY rebounds strongly but stays below 131.36 resistance Outlook remains bearish and further decline is expected. Break of 129.22 will target 128.94 first. Break will resume whole fall from 137.49 and target 61.8% projection of 137.49 to 128.94 from 133.47 at 128.18, and possibly further to 126.61 medium term fibonacci level. Nonetheless, break of 131.36 will dampen our bearish view and turn focus back to 133.47 resistance instead.
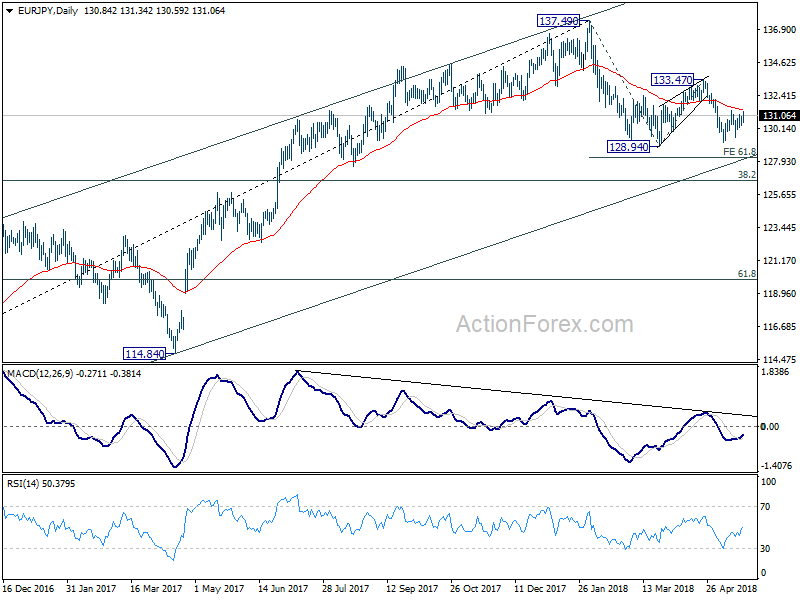
In the bigger picture, for now, price actions from 137.49 are viewed as a corrective pattern only. Hence, while deeper decline would be seen, strong support is expected at 38.2% retracement of 109.03 to 137.49 at 126.61 to contain downside and bring rebound. Up trend from 109.03 (2016 low) is expected to resume afterwards. Though, sustained break of 126.61 will be an important sign of trend reversal and will turn focus to 124.08 resistance turned support.
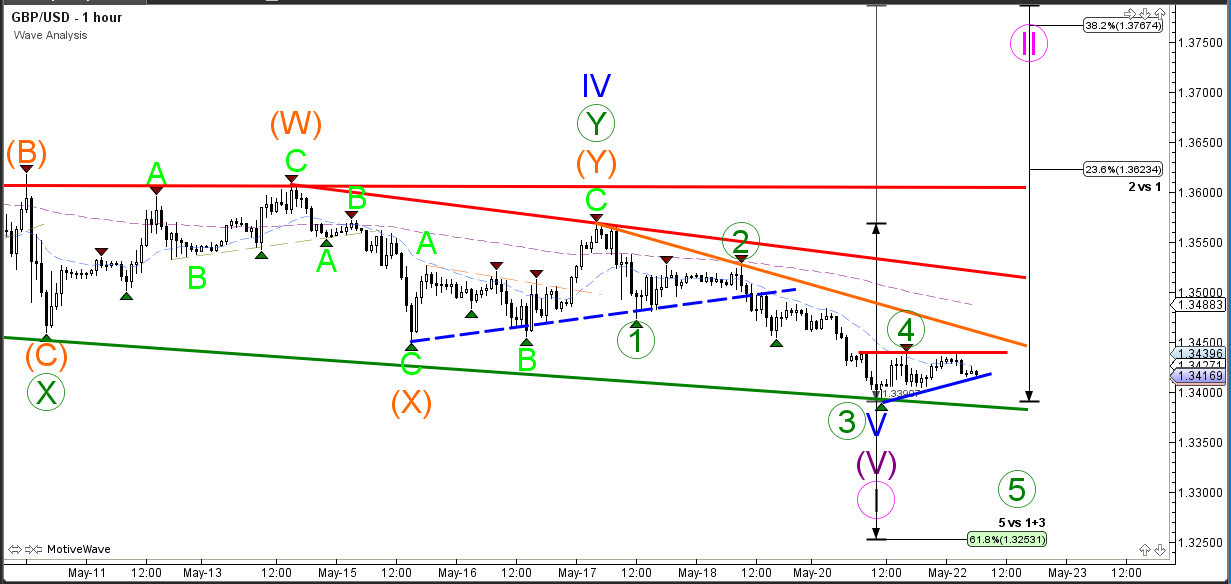
GBP/USD Downtrend Challenges Fibonacci Zone At 1.34
The GBP/USD broke below the support trend lines and the downtrend continued with a new lower low. The Cable is now approaching a key Fibonacci support zone (green) around 1.34. Price will need to break below the support trend line (green) before a bearish breakout could occur whereas a bullish break could indicate a retracement within wave 2.
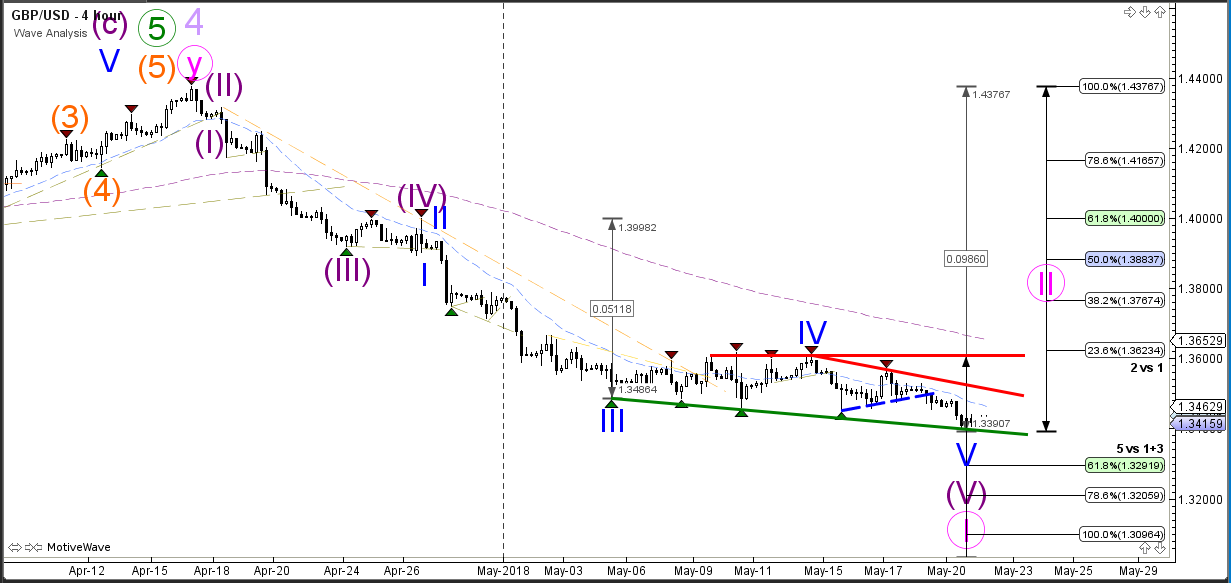
The GBP/USD is now building a corrective chart pattern which could be a wave 4 (green). A bearish breakout aims for the Fibonacci targets of wave 5 (blue/purple) whereas a bullish breakout could retrace back to the Fibonacci retracement levels of wave 2 (pink)
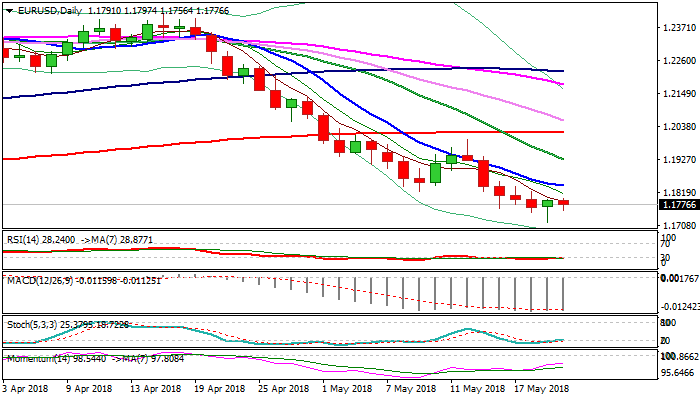
EURUSD – Limited Recovery Maintains Bearish Bias After Strong Rejection At Key 1.1709 Support
The Euro moves lower in early European trading on Tuesday after strong offers at 1.18 zone repeatedly limited upside attempts.
Monday's trading ended in Hammer candle, following strong rejection on first attempt at key 1.1709 support (Fibo 38.2% of 1.0340/1.2555 rally), but little impact was seen so far, as falling 5SMA reinforced 1.18 resistance zone and repeatedly capped recovery attempts.
Positive momentum is conflicting bearish MA's which could result in extended consolidation as 1.1709 marks pivotal support and further hesitation here cannot be ruled out.
The pair would stay within 1.1710/1.1800 range before establishing in fresh direction.
Overall bearish structure favors further downside on firm break below 1.1709, for test of next significant support at 1.1675 (weekly cloud top) and possible stronger bearish acceleration on break.
Falling 5SMA marks immediate resistance at 1.1786, followed by pivots at 1.1822 (former low of 09 May / Fibo 38.2% of 1.1996/1.1716 bear-leg) and 1.1840 (falling 10SMA).
Firm break above these barriers is needed to neutralize immediate downside risk and signal further recovery.
Res: 1.1786, 1.1822, 1.1840, 1.1856
Sup: 1.1756, 1.1716, 1.1709, 1.1675
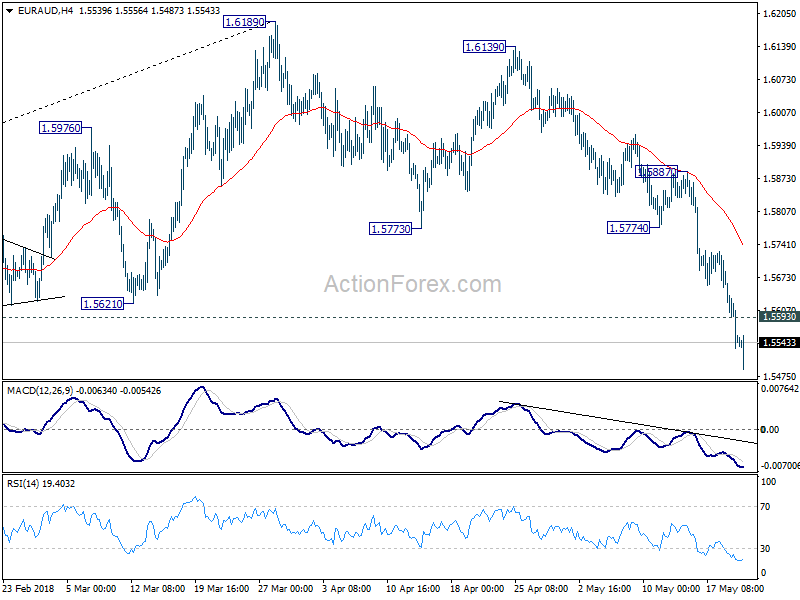
EUR/AUD Daily Outlook
Daily Pivots: (S1) 1.5500; (P) 1.5583; (R1) 1.5634; More....
EUR/AUD's decline accelerates to as low as 1.5487 so far and intraday bias remains on the upside. Prior break of 1.5621 support is taken as an indication of medium term reversal. Current fall should target 1.5153 support next. On the upside, above 1.5593 minor resistance will turn bias neutral and bring consolidations. But recovery should be limited well below 1.5773 resistance to bring fall resumption.
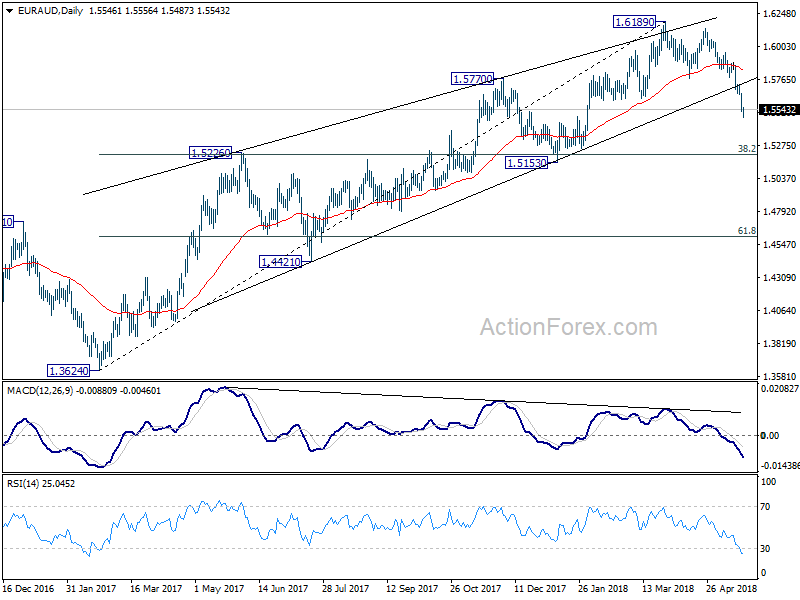
In the bigger picture, rally from 1.3624 (2017 low) should have completed at 1.6189 already, ahead of 1.6587 key resistance (2015 high). 1.6189 is seen as a medium term top. Deeper fall would be seen to 38.2% retracement of 1.3624 to 1.6189 at 1.5209 first. Decisive break there will pave the way to 61.8% retracement at 1.4604. In that case, we'll look for bottoming again below 1.4604. On the upside, break of 55 day EMA (now at 1.5849) is needed to indicate completion of the fall from 1.6189. Otherwise, further fall is expected in medium term, even in case of strong rebound.
EUR/GBP Daily Outlook
Daily Pivots: (S1) 0.8741; (P) 0.8763; (R1) 0.8800; More...
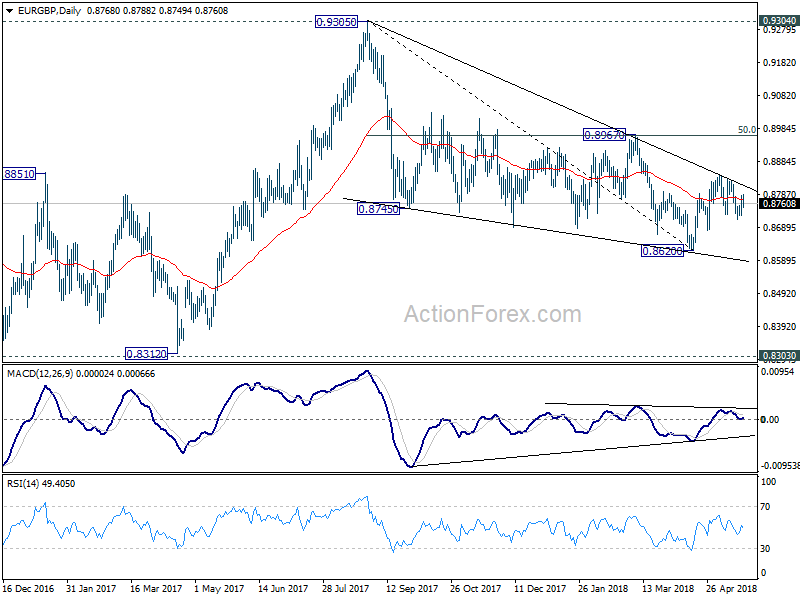
Intraday bias in EUR/GBP stays neutral for the moment. And near term outlook is a bit mixed. On the downside, break of 0.8679 support should confirm completion of the rebound form 0.8620. And intraday bias will be turned back to the downside for this support. Whole decline from 0.9305 will likely be resuming too. On the upside, above 0.8844 will resume the rebound from 0.8620 and target 0.8967 cluster resistance (50% retracement of 0.9305 to 0.8620 at 0.8963).
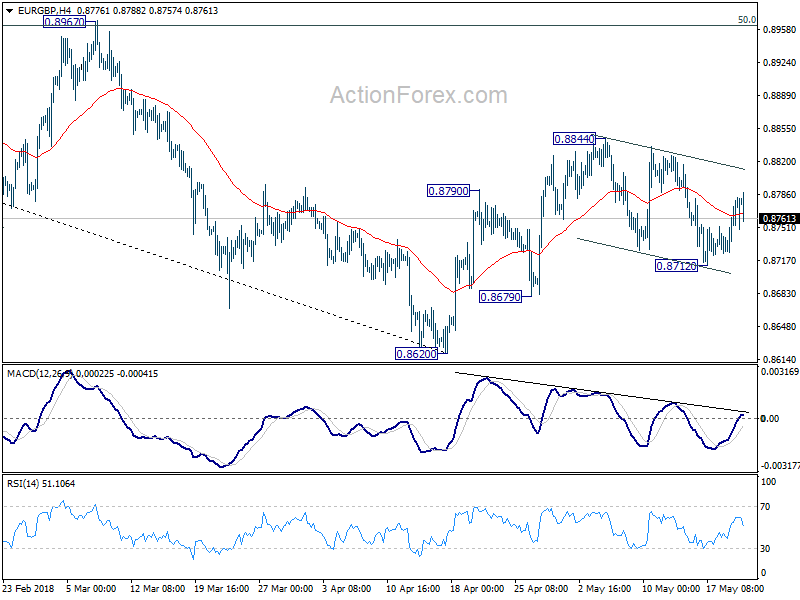
In the bigger picture, for now, the decline from 0.9305 is seen as a leg inside the long term consolidation pattern from 0.9304 (2016 high). Such consolidation pattern could extend further. Hence, in case of strong rally, we'd be cautious on strong resistance by 0.9304/5 to limit upside. Meanwhile, in another decline attempt, we'd expect strong support from 0.8116 cluster support (50% retracement of 0.6935 to 0.9304 at 0.8120) to contain downside.
EUR/USD Analysis: Bounces From Six-Month Low
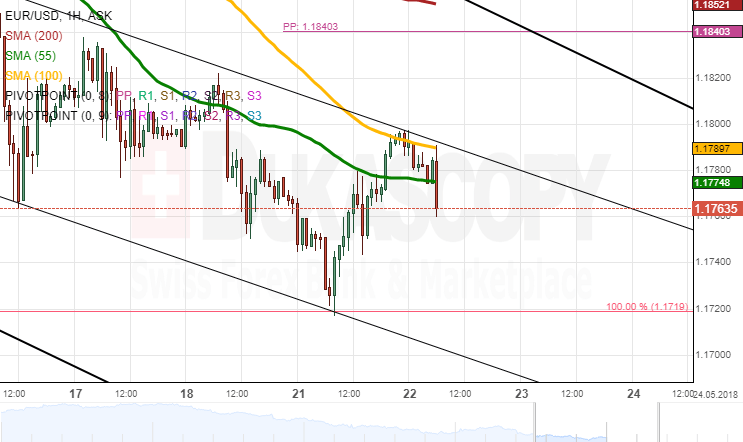
The common European currency started the week on a weak note against the Greenback, as it fell down to a fresh 2018 low at 1.1725.
This decline was stopped by the 100.00% Fibonacci retracement which is drawn from December 2017 low and 2018 high at 1.1719 and 1.2555, respectively. Subsequently, bulls took the dominant hand and pushed the rate up to the 100-hour SMA and a channel line at 1.18.
The general tendency of the pair should remain northwards this week. Technical indicators, however, flash bearish signals for this session, suggesting that the 100-hour moving average might provide strong resistance for some time.
In case bears prevail, 1.1720 is unlikely to be breached. However, if the 1.18 mark is surpassed, the pair is expected to test the 200-hour SMA at 1.1850.