Sample Category Title
Loonie Trading On A Stronger Footing, Ahead Of Canada’s Existing Home Sales Data
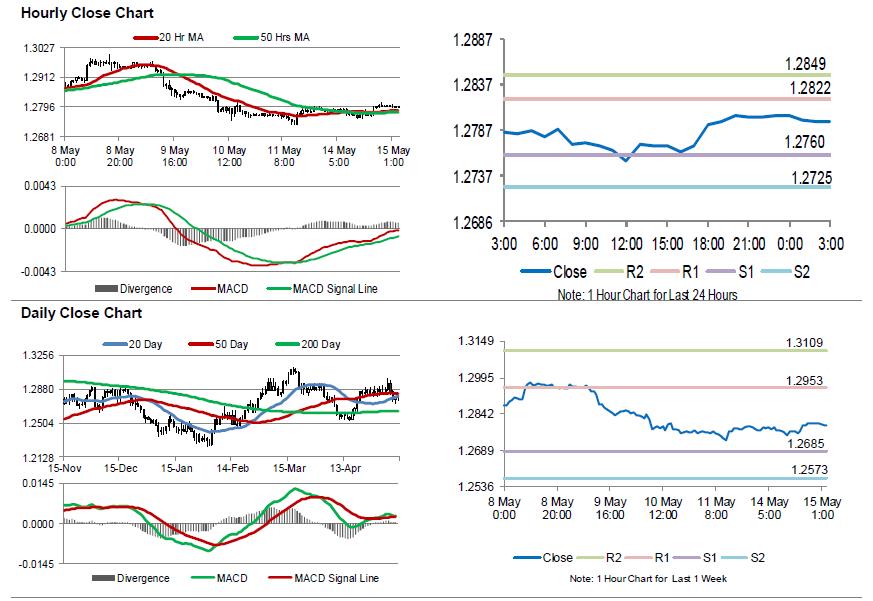
For the 24 hours to 23:00 GMT, the USD rose 0.22% against the CAD and closed at 1.2803.
On the macro front, Canada's Teranet/National Bank house price index advanced 0.2% on a monthly basis in April, after recording a flat reading in the prior month.
In the Asian session, at GMT0300, the pair is trading at 1.2796, with the USD trading 0.05% lower against the CAD from yesterday's close.
The pair is expected to find support at 1.2760, and a fall through could take it to the next support level of 1.2725. The pair is expected to find its first resistance at 1.2822, and a rise through could take it to the next resistance level of 1.2849.
Moving ahead, traders would direct their attention to Canada's existing home sales data April, set to release later in the day.
The currency pair is trading above its 20 Hr and 50 Hr moving averages.
Board Members See Scant Evidence For A Near-Term Interest Rate Hike: RBA Minutes
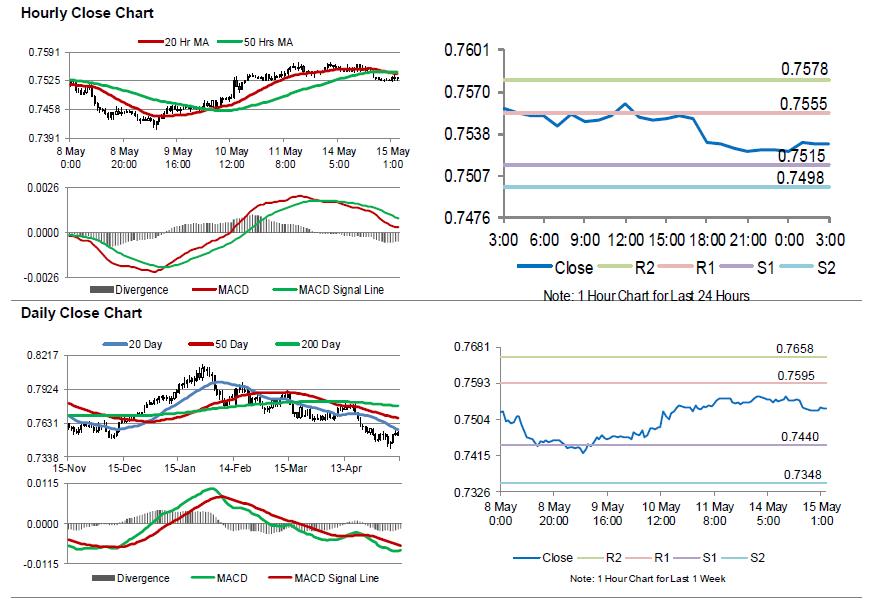
For the 24 hours to 23:00 GMT, the AUD declined 0.44% against the USD and closed at 0.7526.
LME Copper prices declined 0.60% or $41.0/MT to $6628.0/MT. Aluminium prices rose 0.53% or $12.0/MT to $2285.5/MT.
In the Asian session, at GMT0300, the pair is trading at 0.7531, with the AUD trading 0.07% higher against the USD from yesterday's close.
According to minutes of the Reserve Bank of Australia's (RBA) May meeting, policymakers shared a broad agreement that interest rate should remain at the current low level in the foreseeable future, as inflation is likely to remain sluggish in the wake of stubbornly weak wage growth. Further, officials reiterated that any future movement in interest rate is more likely to be up than down.
Elsewhere in China, Australia's largest trading partner, retail sales grew 9.4% YoY in April, compared to an advance of 10.1% in the prior month and falling short of market consensus for a rise of 10.0%. Meanwhile, the nation's industrial production rose more-than-estimated by 7.0% on a yearly basis in April, following a gain of 6.0% in the previous month. Market expectation was for industrial production to rise 6.4%.
The pair is expected to find support at 0.7515, and a fall through could take it to the next support level of 0.7498. The pair is expected to find its first resistance at 0.7555, and a rise through could take it to the next resistance level of 0.7578.
Going ahead, traders would closely monitor Australia's Westpac consumer confidence index for May, due to release overnight.
The currency pair is trading below its 20 Hr and 50 Hr moving averages.
Gold: Yellow Metal Trading Flat In The Asian Session
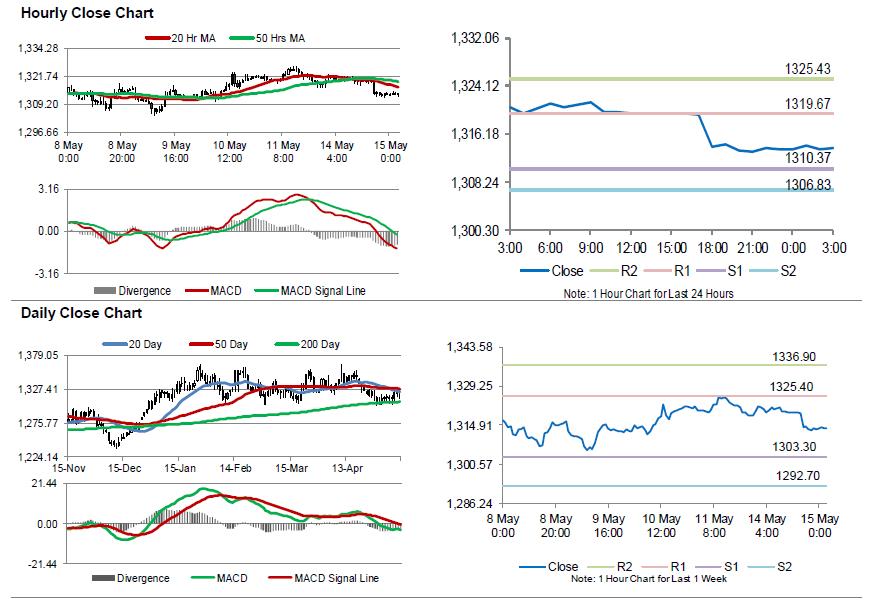
For the 24 hours to 23:00 GMT, Gold declined 0.56% against the USD and closed at USD1313.90 per ounce, amid strength in the greenback and signs of easing trade conflicts between the US and China.
In the Asian session, at GMT0300, the pair is trading at 1313.90, with gold trading flat against the USD from yesterday’s close.
The pair is expected to find support at 1310.37, and a fall through could take it to the next support level of 1306.83. The pair is expected to find its first resistance at 1319.67, and a rise through could take it to the next resistance level of 1325.43.
The yellow metal is trading below its 20 Hr and 50 Hr moving averages.
Silver: White Metal Trading A Tad Higher In The Morning Session
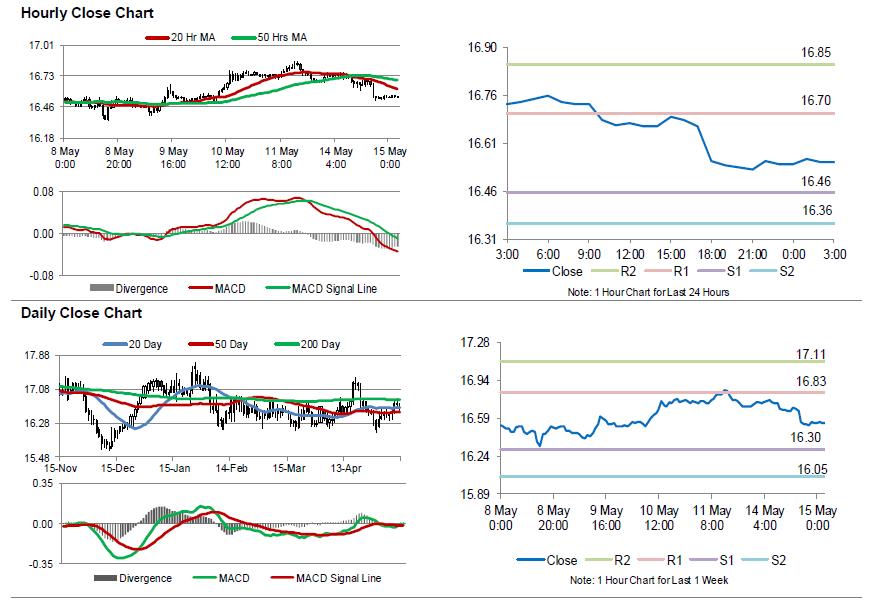
For the 24 hours to 23:00 GMT, Silver declined 1.14% against the USD and closed at USD16.55 per ounce, tracking losses in gold prices.
In the Asian session, at GMT0300, the pair is trading at 16.55, with silver trading slightly higher against the USD from yesterday’s close.
The pair is expected to find support at 16.46, and a fall through could take it to the next support level of 16.36. The pair is expected to find its first resistance at 16.70, and a rise through could take it to the next resistance level of 16.85.
The white metal is trading below its 20 Hr and 50 Hr moving averages.
Crude Oil: Oil Reverses Its Gains, Ahead Of API’s Weekly Crude Oil Inventories Data
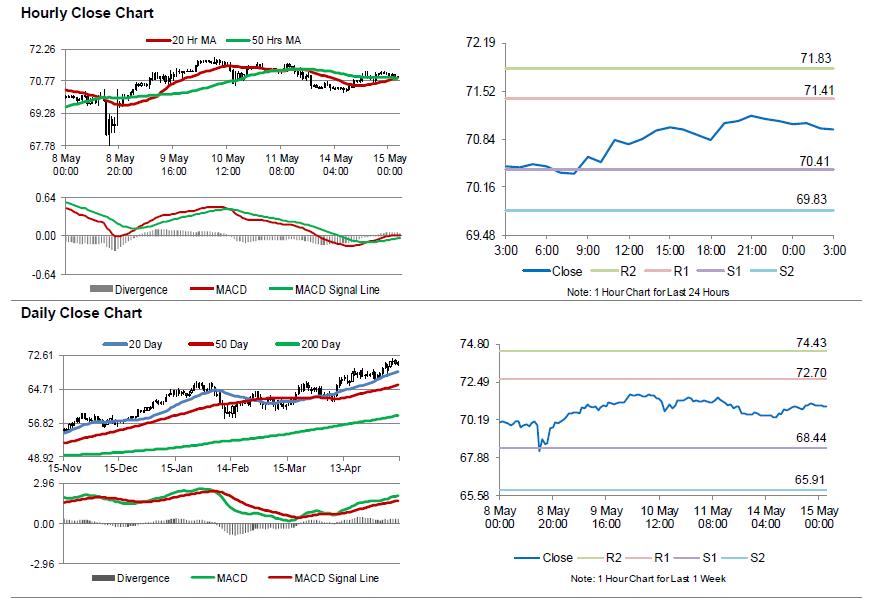
For the 24 hours to 23:00 GMT, Crude Oil rose 0.87% against the USD and closed at USD71.10 per barrel, after the Organisation of the Petroleum Exporting Countries (OPEC), in its monthly report, revised up its demand forecast for global crude oil by 25000 barrels to 98.85 barrels per day (bpd). Further, the OPEC stated that the global oil glut has been nearly eliminated. However, the report showed that OPEC's crude production rose by 12,000 bpd in April, driven by an increase in output from Saudi Arabia.
Separately, the Energy Information Administration (EIA) estimated that crude-oil production from seven major US shale players would rise by 144,000 bpd in June to 7.18 million bpd.
In the Asian session, at GMT0300, the pair is trading at 70.98, with oil trading 0.17% lower against the USD from yesterday's close.
The pair is expected to find support at 70.41, and a fall through could take it to the next support level of 69.83. The pair is expected to find its first resistance at 71.41, and a rise through could take it to the next resistance level of 71.83.
Crude oil is showing convergence with its 20 Hr and 50 Hr moving averages.
USD/CAD Daily Outlook
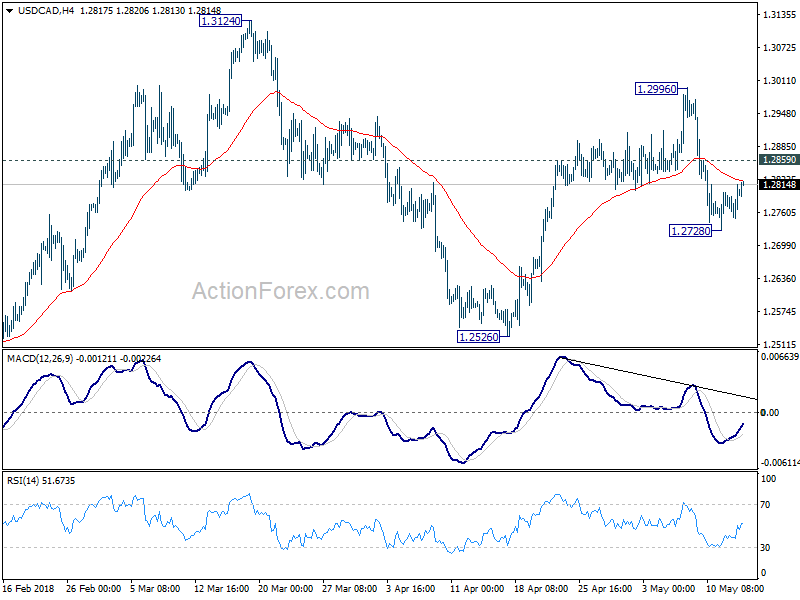
Daily Pivots: (S1) 1.2762; (P) 1.2793; (R1) 1.2843; More....
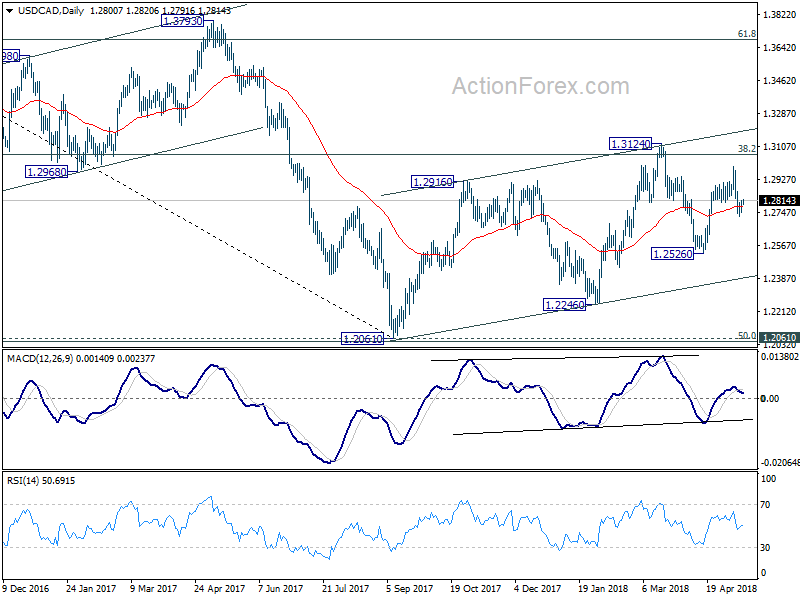
USD/CAD recovered after dipping to 1.2728 and intraday bias is turned neutral first. At this point, we continue to favor the bullish case that rebound from 1.2061 hasn't completed. Therefore, in case of another fall, downside should be contained well above 1.2526 support and bring rebound. On the upside, above 1.2859 will bring retest of 1.2996 first. However, firm break of 1.2526 will resume the fall from 1.3124 to 1.2246 support and likely below.
In the bigger picture, current development suggests that rebound from 1.2061 has not completed yet. Focus is back on 38.2% retracement of 1.4689 to 1.2061 at 1.3065. Sustained trading above there will confirm medium term bullish reversal. That is, down trend from 1.4689 has completed at 1.2061 already. In that case, next target will be 61.8% retracement at 1.3685. However, break of 1.2526 support will dampen this bullish view again. And, focus will be back on 1.2061 key support level, which is close to 50% retracement of 0.9406 (2011 low) to 1.4689 (2015 high) at 1.2048
AUD/USD Daily Outlook
Daily Pivots: (S1) 0.7511; (P) 0.7538; (R1) 0.7553; More...
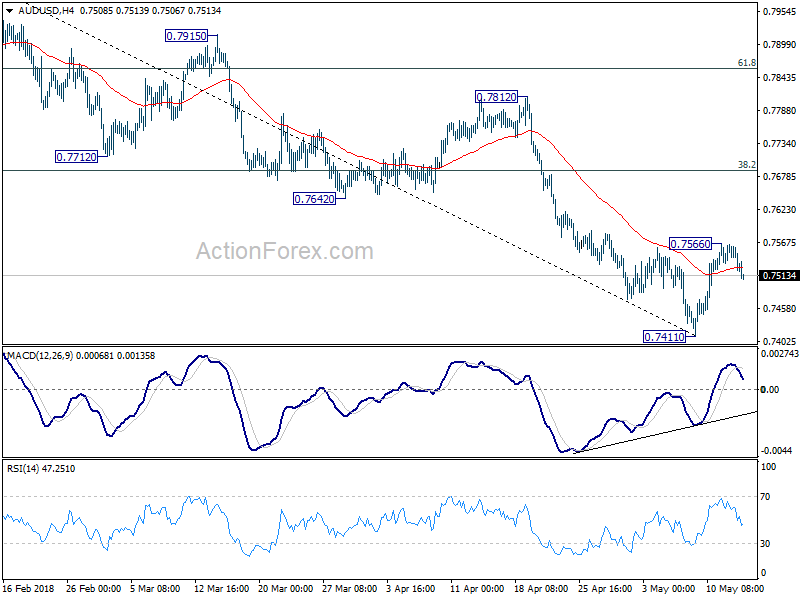
AUD/USD's recovery was limited at 0.7566 and retreated. Intraday bias is turned neutral first. More consolidations could be seen in near term. Above 0.7566 will bring another rise. But in that case, upside should be limited by 38.2% retracement of 0.8135 to 0.7144 at 0.7688 to bring decline resumption. On the downside, break of 0.7411 will resume the fall from 0.8135 and target cluster support at 0.7328 (61.8% retracement of 0.6826 to 0.8135 at 0.7326).
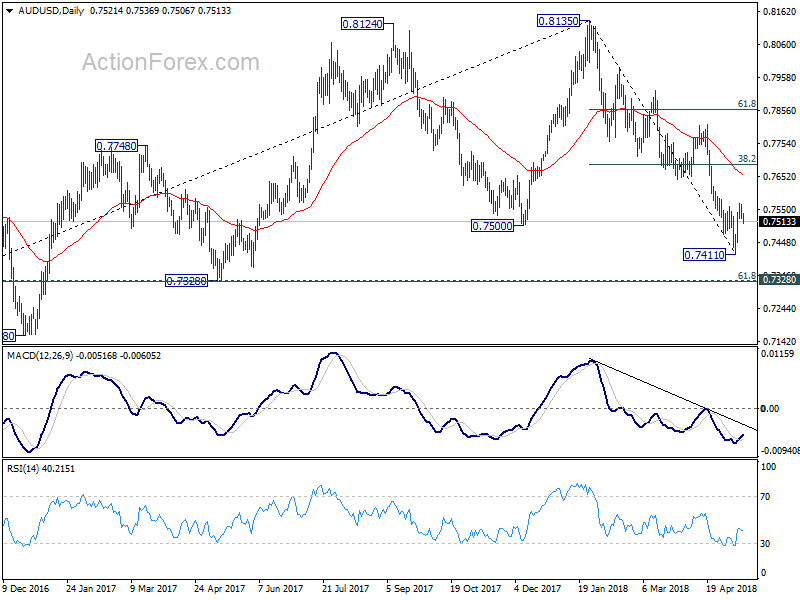
In the bigger picture, medium term rebound from 0.6826 is seen as a corrective move. Decisive break of 0.7500 key support suggests that such correction is completed at 0.8135. Deeper decline would be seen back to retest 0.6826 low. In case of another rise, we'd expect strong resistance from 38.2% retracement of 1.1079 to 0.6826 at 0.8451 to limit upside to bring long term down trend resumption eventually.
Market Morning Briefing: Euro Saw A Sharp Drop From A High Of 1.1996
STOCKS
Dow (24899.41, +0.27%) tested an intra-day high of 24994, but came off to close at lower levels. While the resistance on the daily charts holds, the index could see a short dip towards 24750-24700 before again rising back towards 25000 or higher.
Dax (12977.71, -0.18%) may test 12900 on the downside before moving up towards 13200-13300 levels in the near term. Overall trend is up and view looks bullish.
Nikkei (22862.79, -0.013%) looks strong just now and as mentioned earlier, 22600 is a strong support. While the upside momentum continues, there are chances of testing 23200+ levels in the medium term.
Shanghai (3168.60, -0.16%) is almost stable and could find it difficult to break above 3200 just now. The next 2-sessions could be stable below 3200 and thereafter either a sharp fall back towards 3100 or a break above 3200 is possible.
Nifty (10806.60, +0.10) looks bullish just now while above 10750. The index could slowly inch up towards 10900 in a few sessions.
COMMODITIES
Brent (78.28) and Nymex WTI (70.97) are trading slightly higher today. WTI could test support near 70 in a couple of days before staring to move up again towards 72 while Brent on the other hand is likely to move up towards 80 in the medium term. Both the crude prices look bullish just now.
Gold (1313.80) is trapped in the 1320-1300 region and is likely to remain so for some more time. Lack of strength in the bulls may keep the index sideways for some time. A break below 1300, if seen in the medium term could open up chances of testing 1280 on the downside.
3.05-3.15 is the broad trade region for Copper (3.0875). Price is likely to fluctuate in this region for some more time.
FOREX
Dollar index (92.64) found support at the 13 days moving average line near 92.4 and rose back towards 92.6. Rise in the US 10 year yield (see Interest Rates below) might well have been a reason for this upmove. The markets now await the Retail Sales data today. If it turns out to be higher than expected, it could take yields higher and lend strength to the Dollar; whereas lower retail sales might lead to the Dollar Index dipping lower towards the 21 days moving average near 91.8. We have been saying that the broader uptrend towards the medium term target of 94-95 remains intact and these levels could be tested in this month itself.
Euro (1.1933) saw a sharp drop from a high of 1.1996 near the 13 days MA yesterday, suggesting that the overall downtrend is still strong. However, we need to watch immediate Support at 1.1920. If that holds, the Euro could vacillate between 1.1920-80 for a while. Else, a break below 1.1920 can target 1.1860 and lower.
Dollar Yen (109.74) is respecting support on daily and 3 day candles near 109.0-109.5. Repeating yesterday's comment: if it stays above 109, a rise back towards 110.5-111.0 in this week is still possible. If it breaks below 109.5-109.0, it could turn bearish for the medium term. Weak retail sales data might well lead to a break of this support.
Euro Yen (130.96) might find some resistance at the 13 days MA near current levels. Whether it breaches the same to target the 21 days MA near 132 could depend on how Dollar strength against Euro and Yen plays out relatively after the retail sales data today. In either case, Euro Yen should see a dip from 131 or 132.
Pound (1.3563): Our expected rise in the Pound towards 1.37 hasn't taken place yet but could happen in the next couple of sessions if the Dollar weakens. After a test of levels near 1.37, the broader downmove for the Pound could resume.
Dollar Rupee (67.515): Can test 67.70-80 in the current move. Support moves up to 67.30-10.
INTEREST RATES
A rise in German yields (10 Year has risen from 0.5% to 0.611%) has led to the US 10 year yield also rising towards 3%. Trump's decision to help a Chinese telecommunications company has also led to a change in the prevailing 'trade war sentiment' and might have been a reason for some investor flows from bonds to equity. After CPI data release last week reflected lower than expected inflation in Apr, the markets would be looking at the US Retail Sales data due later today. If retail sales also turn out to be lower than expected, it might again prevent the 10 year yield from crossing the 3% barrier. However, higher retail sales could possibly be the trigger that we have been talking about for 10 year yields to breach 3% decisively.
The medium term targets for US yields in our Apr ’18 US Treasury report (available on demand) are as follows: 3.2%-3.3% (10 Year), 3.4%-3.5% (30 Year), 3.15% (5 Year) and 2.75% (2 Year). A breach of the 3% level by the 10 year yield would be vital for these targets to be achieved by June. A rate hike is expected in the June Fed meeting, which should start getting factored later this month and could henceforth lead to a rally in yields towards these medium term targets. We also expect some more yield curve flattening in this month followed by steepening after that, as yields bounce from long term supports.
US 10 Yr Yield (2.997%), 30 Yr (3.127%), 5 Yr (2.858%), 2 Yr (2.5475%): Contrary to expectation, the US 10 Year, 30 Year and 5 Year didn't dip towards respective supports on short term charts. If the retail sales data disappoints today, the yields could then target support levels near 2.95%-2.90%, 3.08% and 2.78% this week.
The German 10 Year – US 10 Year yield spread (-2.386), as we predicted, has seen a rise from support on medium term chart and could now continue to move up towards -2.3% in this month. Also, as expected, the German 10 year yield (0.611%) has risen from support near 0.5% on short term and medium term charts and might target resistance near 0.9% in the medium term.
Repeating yesterday's comment: 0.9% on German 10 year yield and -2.3% on the German-US spread gives a target of 3.2% for the US 10 year which syncs well with our above mentioned medium term targets.
USD/JPY Daily Outlook
Daily Pivots: (S1) 109.33; (P) 109.50; (R1) 109.82; More...
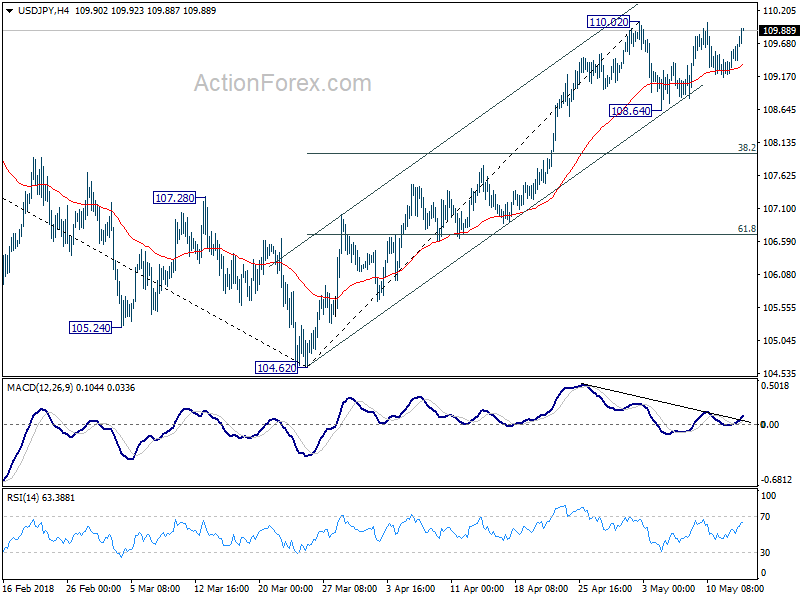
USD/JPY drew support from 4 hour 55 EMA again and recovered. But it's staying below 110.02 short term top and intraday bias remains neutral. In case of another fall, downside should be contained by 38.2% retracement of 104.62 to 110.02 at 107.95 to bring rally resumption. On the upside, break of 110.02 will resume the rise from 104.62 to 61.8% retracement of 114.73 to 104.62 at 110.86 next.
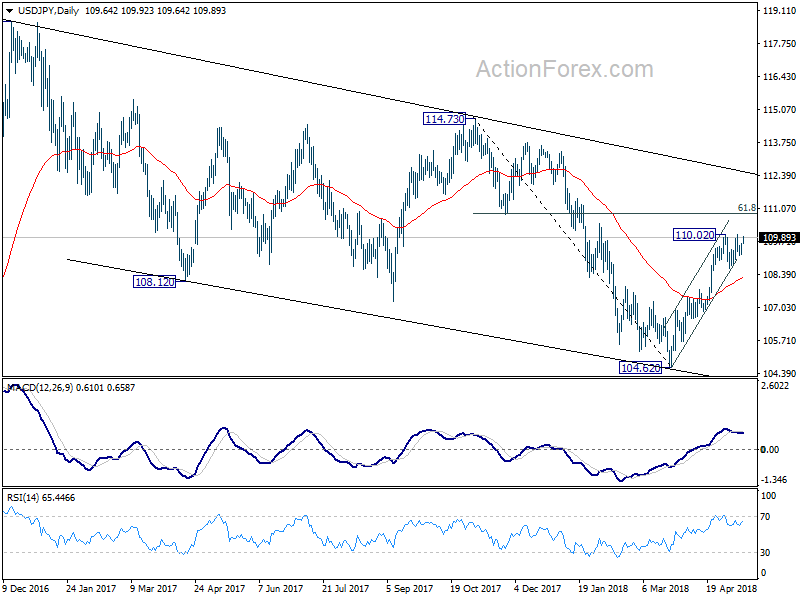
In the bigger picture, corrective decline from 118.65 (2016 high) has completed with three waves down to 104.62. Rise from 104.62 is possibly resuming the up trend from 98.97 (2016 low). This will be the preferred case as long as 38.2s% retracement of 104.62 to 110.02 at 107.95 holds. Decisive break of 114.73 resistance will confirm our view and target 118.65 and above.
USD/CHF Daily Outlook
Daily Pivots: (S1) 0.9968; (P) 1.0004; (R1) 1.0032; More...
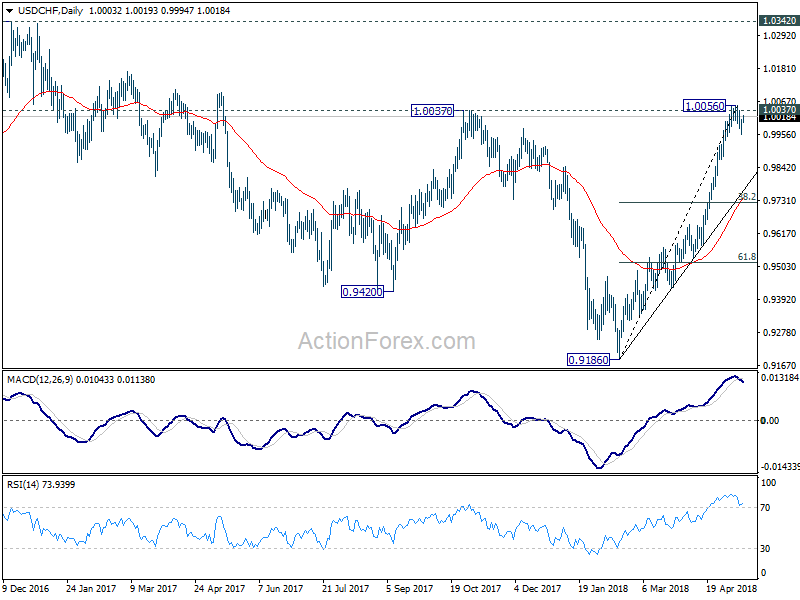
USD/CHF's retreat was contained at 0.9956 and recovered. Intraday bias is turned neutral first. More corrective trading could be seen and below 0.9956 will bring deeper fall. But downside should be contained by trend line support (now at 0.9764) to bring rebound. On the upside, sustained break of 1.0037 will resume recent rise for 1.0342 key resistance next.
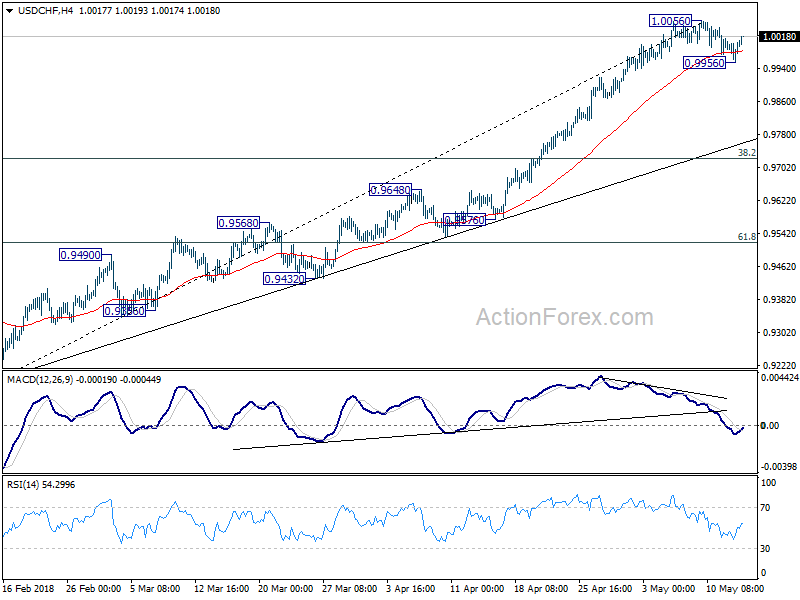
In the bigger picture, medium term decline from 1.0342 has completed with three waves down to 0.9186. Rise from there is currently viewed as a leg inside the long term range pattern. Hence, while further rally would be seen, we'd be cautious on strong resistance from 1.0342 to limit upside. For now, further rise is expected as long as 38.2% retracement of 0.9186 to 1.0056 at 0.9724 holds.