Sample Category Title
Oil Holds Ground Despite Profit Taking
Rise of a refiner
In energy: when prices move, things happen. After months of nothing, the recent, sudden rise in crude prices had made a mega-merger happen. On 30 April Marathon Petroleum agreed to acquire US independent Andeavor to create the largest US refiner by capacity and one of the top five globally. The deal has two critical points. First, combining Andeavor’s plays in the Permian and Bakken basins with its solid footprint in Marcellus Shale will make it a direct winner in shale growth. Second, its significant refining capabilities around the Gulf of Mexico give it direct access to Mexico’s newly liberalized gasoline and diesel markets.
The refining sector is reborn. Lower oil prices forced US operators, once considered capital traps, to maximize efficiency. Now the business is most profitable. Energy in 2017 was one of the poorest performing global sectors, yet 2018 is seeing price hikes. Crude oil is close to undersupplied, as inventory dropped and demand increased. Improved supply/demand equilibrium converts to higher profits.
Marathon will acquire all of Andeavor’s shares, valued at US$23.3 billion. Andeavor’s shareholders can choose stock or cash. This deal has built a leading national, integrated energy company that will operate 16 US refineries from Gulf to the Midwest.
Canada GDP benefits from tailwinds in February as trade tensions dissipate
Confirming its willingness to exempt Canada, Mexico and the EU from aluminum and steel tariffs until June 1, 2018, the Trump administration is giving a break to its key commercial partners, as it is expected to start hard talks with Chinese negotiators as early as Thursday. In that context, the Canadian economy is doing well, supported by contained y/y core inflation at +1.90% and accelerating industrial production activities in March. As given by recent progression in gross domestic product (GDP) data given at +0.40% m/m and +3% y/y in February, Canadian economic growth is expected to continue in that direction due to continued rebound in mining, oil and gas extraction activities in April. Bank of Canada GDP growth expectations of 2% for 2018 might probably be a bit too conservative given current upturn.
As Fed FOMC rate decision is taking place today at 20:00 GMT+2, with rate unchanged at +1.75% and continued tightening in June 13, 2018 meeting (most likely scenario), we’re expecting the loonie to stay under pressure. Currently trading at 1.2821, the USD/CAD is expected to increase along the 1.2835 range in the short-term.
AUDUSD Shifts Long-Term Positive Structure To Negative, Hits 11-Month Low
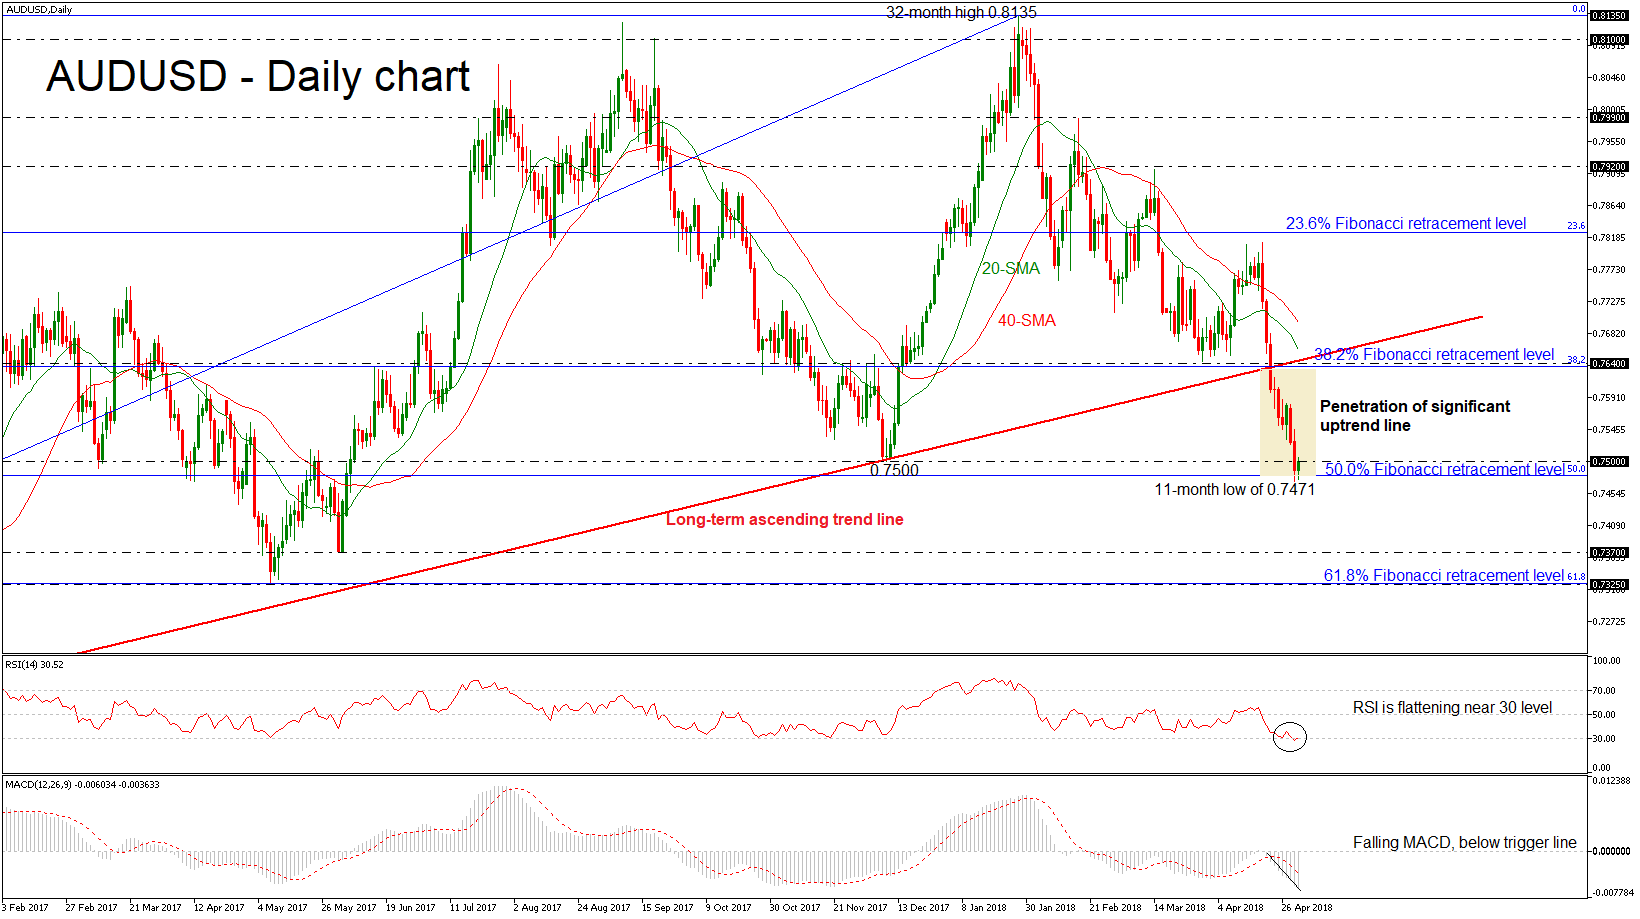
AUDUSD has been heading sharply lower over the last couple of weeks, penetrating the long-term ascending trend line to the downside. The bullish picture shifted to bearish as there is a weekly session close below the significant diagonal line, which had been holding since January 2016. Since its deep fall, the price touched a fresh 11-month low of 0.7471 during yesterday’s trading day.
Looking at momentum indicators, in the daily timeframe, the RSI indicator is lacking direction near the oversold zone, suggesting that the market could keep consolidating in the near term. The MACD oscillator is moving lower in the negative territory with strong momentum.
Currently, the price is trading around the 50.0% Fibonacci retracement level of 0.7480 of the upleg from 0.6820 to 0.8135, which is acting as significant support barrier. In the wake of negative pressures, the market could extend its losses towards the 0.7370 support hurdle. In case of steeper declines, the pair could breach this trough, diving to the 0.7325 level, which overlaps with the 61.8% Fibonacci mark.
On the flip side, a move to the upside could open the way to the 38.2% Fibonacci, which holds near the 0.7640 resistance level and the rising trend line. Also, the 20- and 40-simple moving averages are behaving as critical resistance levels near 0.7670 and 0.7700 respectively. A jump above these levels could open the way towards the 23.6% Fibonacci of 0.7825.
Overall, AUDUSD has been negative since peaking at a 32-month high of 0.8135. Near-term negative pressure is expected to remain as long as price action takes place below the uptrend line.
Dollar Climbs Ahead Of Fed Decision, Eurozone GDP Eyed As Well
Here are the latest developments in global markets:
FOREX: The US dollar index continued to advance yesterday, reaching a fresh four-month high ahead of a policy decision by the Fed later today. Meanwhile, sterling came under renewed selling interest as UK data continued to disappoint, while the loonie experienced a very volatile session following some comments by BoC Governor Poloz.
STOCKS: US markets closed mixed yesterday. The tech-heavy Nasdaq Composite climbed 0.91%, the S&P 500 gained 0.25%, while the Dow Jones fell by 0.27%. Futures tracking the Nasdaq 100 are pointing to a higher open today, possibly due to Apple’s Q1 earnings beating analysts’ expectations yesterday after the closing bell. On the other hand, futures tracking the S&P and Dow are currently flashing red. The main event for these indices today will probably be the FOMC policy decision. Meanwhile, it appears that special counsel Robert Mueller would consider subpoenaing the US president should he refuse to participate in a voluntary interview relating to the Russian involvement in 2016’s presidential elections. If the situation escalates, then this could definitely weigh on equity market sentiment. In Asia, the Nikkei 225 and the Topix both declined by roughly 0.15%, while in Hong Kong, the Hang Seng shed 0.29%. In Europe, futures tracking the major indices were mostly in the red, albeit not significantly so.
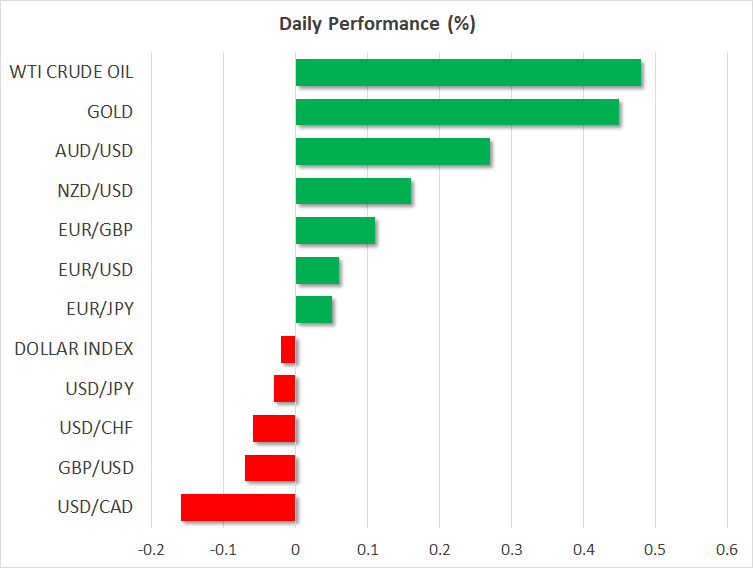
COMMODITIES: Oil prices are a little higher today, recouping some of the losses posted yesterday. WTI and Brent crude are up by 0.5% and 0.4% respectively, both still hovering near their recent highs. The narrative in the oil market remains one where concerns over rising US supply are offset by speculation the US is set to impose fresh sanctions on Iran, thereby removing a significant chunk of supply from the market. In terms of US production, the weekly EIA crude inventory data today will be closely watched. As for sanctions, May 12 is the date to watch, as that is the self-imposed US deadline on deciding on Iran. In precious metals, gold is 0.45% higher today, recouping some of the losses it posted yesterday as the US dollar climbed. Today, the yellow metal will likely look to the FOMC decision for direction.
Major movers: Dollar firms ahead of Fed decision; sterling extends losses after PMI
The US dollar index continued to surge yesterday, reaching a fresh four-month high and closing above its 200-day moving average. Euro/dollar broke below the psychological barrier of 1.2000, while dollar/yen came just shy of touching the round figure of 110.00. With no clear catalyst behind the move, the greenback’s gains appear to be owed to expectations for a more hawkish tone by the FOMC today.
While no change in policy is expected, investors may be anticipating an upgrade in the language surrounding the inflation outlook, following the recent acceleration in the core PCE price index, the Fed’s preferred inflation measure. Although a rate increase in June is already fully priced in, such a hawkish shift in communication could make investors more confident that the Fed may deliver a total of four rate hikes this year, potentially fueling another round of dollar-buying. Anything less than that, though, could disappoint investors looking for such optimistic signals, leading to profit-taking in the greenback.
The UK was once again on the receiving end of disappointing economic data yesterday. The manufacturing PMI for April unexpectedly dropped to its lowest point since 2016, suggesting that after a weak first quarter, the economy may have entered the second quarter on the back foot as well. The pound plunged in the aftermath, while the implied probability for a rate hike by the Bank of England (BoE) next week dropped even further, to a mere 17%. Investors appear to be taking the view that the recent streak of soft data will keep the BoE sidelined for a while, and that any rate hike will be postponed for the end for the year.
Elsewhere, the loonie experienced a very volatile session yesterday, with wild price swings in both directions, amid some comments from BoC Governor Poloz. While the BoC chief largely reiterated remarks he had been making for days now, his comments were seen as having a more hawkish tilt. He noted the Bank is becoming more confident that less stimulus will be needed over time, and that policymakers are concerned interest rates are too low compared to their neutral level.
Day ahead: FOMC rate decision and eurozone growth numbers due
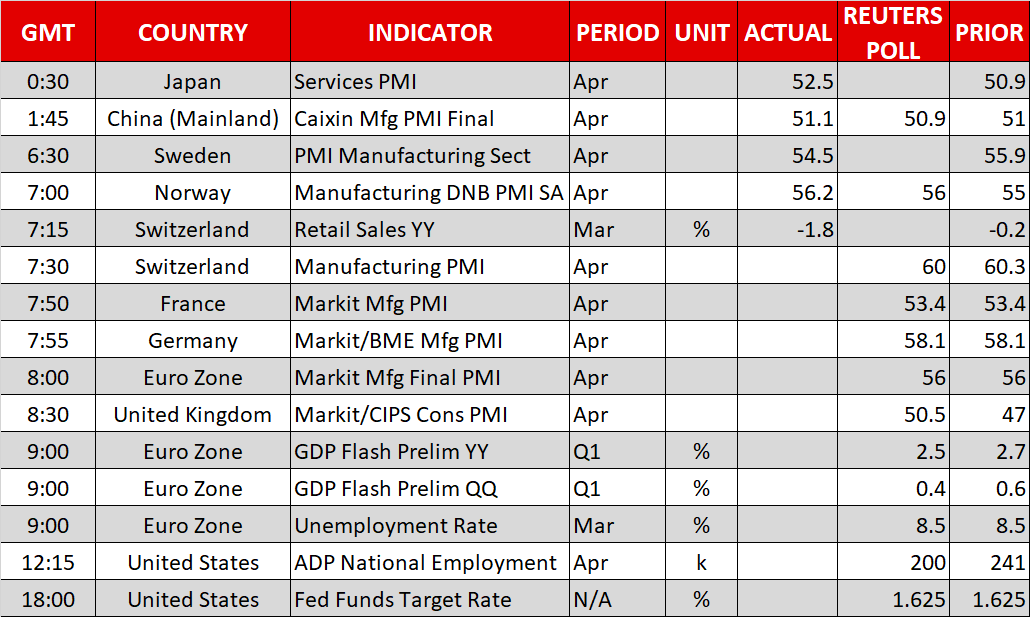
A Federal Reserve decision on interest rates, as well as GDP figures out of the eurozone are the releases expected to generate most attention out of Wednesday’s economic calendar.
At 0800 GMT, the eurozone will see the release of the final reading of Markit’s manufacturing PMI for April. The figure is projected to be confirmed at 56.0, its lowest since September of last year. Germany and France will be on the receiving end of their corresponding PMI prints a little earlier (at 0755 and 0750 respectively).
The UK’s construction PMI for April will be made public at 0830 GMT, with analysts expecting the measure to return to expansion territory above 50.
The attention will next again turn to the eurozone, as flash GDP growth estimates for Q1 are due at 0900 GMT. Projections point to a slowdown in economic activity, with the economy anticipated to have grown by 0.4% on a quarterly basis – a much slower pace relative to the 0.6% posted in Q4 2017 – and by 2.5% in yearly terms, an easing compared to the 2.7% in Q4. Meanwhile, the bloc’s unemployment rate for March, which will be released at the same time, is forecast to remain steady at 8.5%, its lowest in more than eight years.
Turning to the US, the FOMC decision on monetary policy due at 1800 GMT is the event generating most attention. No change in rates is expected. It is noteworthy that the recent patch of data out of the worlds’ largest economy seems to justify the case for the delivery of a “hawkish hold” of interest rates at current levels. Should this materialize, to the extent it signals a more aggressive tightening cycle by the Fed than currently priced in, then the greenback could extend its recent gains relative to other major currencies. At the moment, Fed fund futures project that markets have fully discounted two more 25 bps hikes this year and have begun pricing in a third rate increase as well; the odds for a third currently run at 25%. No press conference by Fed chief J. Powell will take place following the completion of today’s meeting and thus, price action will come solely from the statement accompanying the decision.
Earlier in the day (1215 GMT), the ADP report on the number of jobs positions added to the US economy by the private sector in April will be attracting interest. This is seen by some as a preamble to the more comprehensive nonfarm payrolls report due on Friday.
In energy markets, the EIA’s report (1430 GMT) on crude oil inventories for the week ending April 27 will be of interest.
In equities, Tesla is among companies releasing quarterly results on Wednesday; the carmaker will be reporting after the US market close.
Technical Analysis: EURUSD short-term bearish; RSI close to oversold
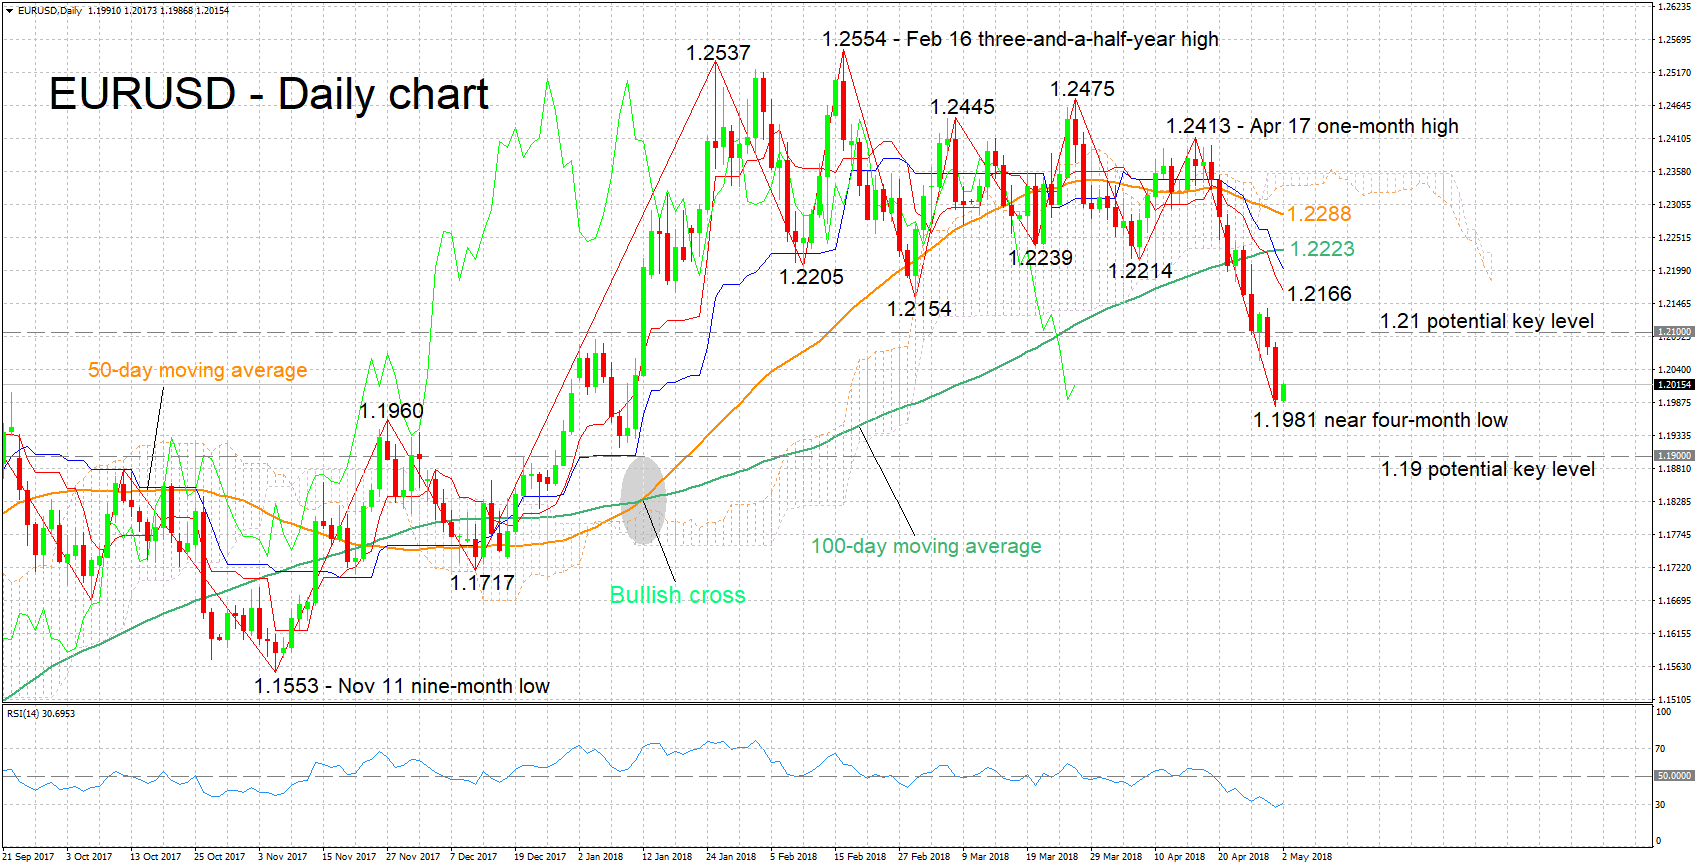
EURUSD is trading roughly 25 pips above Tuesday’s near four-month low of 1.1981. The negatively aligned Tenkan- and Kijun-sen lines are projecting a bearish picture in the short-term. The declining RSI supports this view, notice though that the indicator is close to oversold levels.
Upbeat growth figures out of the eurozone are anticipated to support EURUSD, with resistance to advances potentially coming around the 1.21 round figure.
Conversely, disappointing numbers are likely to push the pair further down. Support could be taking place at the moment around yesterday’s low of 1.1981, including the 1.20 handle. A downside violation will start to increasingly turn the attention to 1.19, while support could also come around 1.1960, this being a top recorded in late 2017.
The pair is likely to face volatility in the aftermath of the FOMC decision as well, while ADP employment figures out of the US also have the capacity to move EURUSD.
EURJPY Runs Above 38.2% Fibonacci Mark After Creating Bearish Correction In Near Term
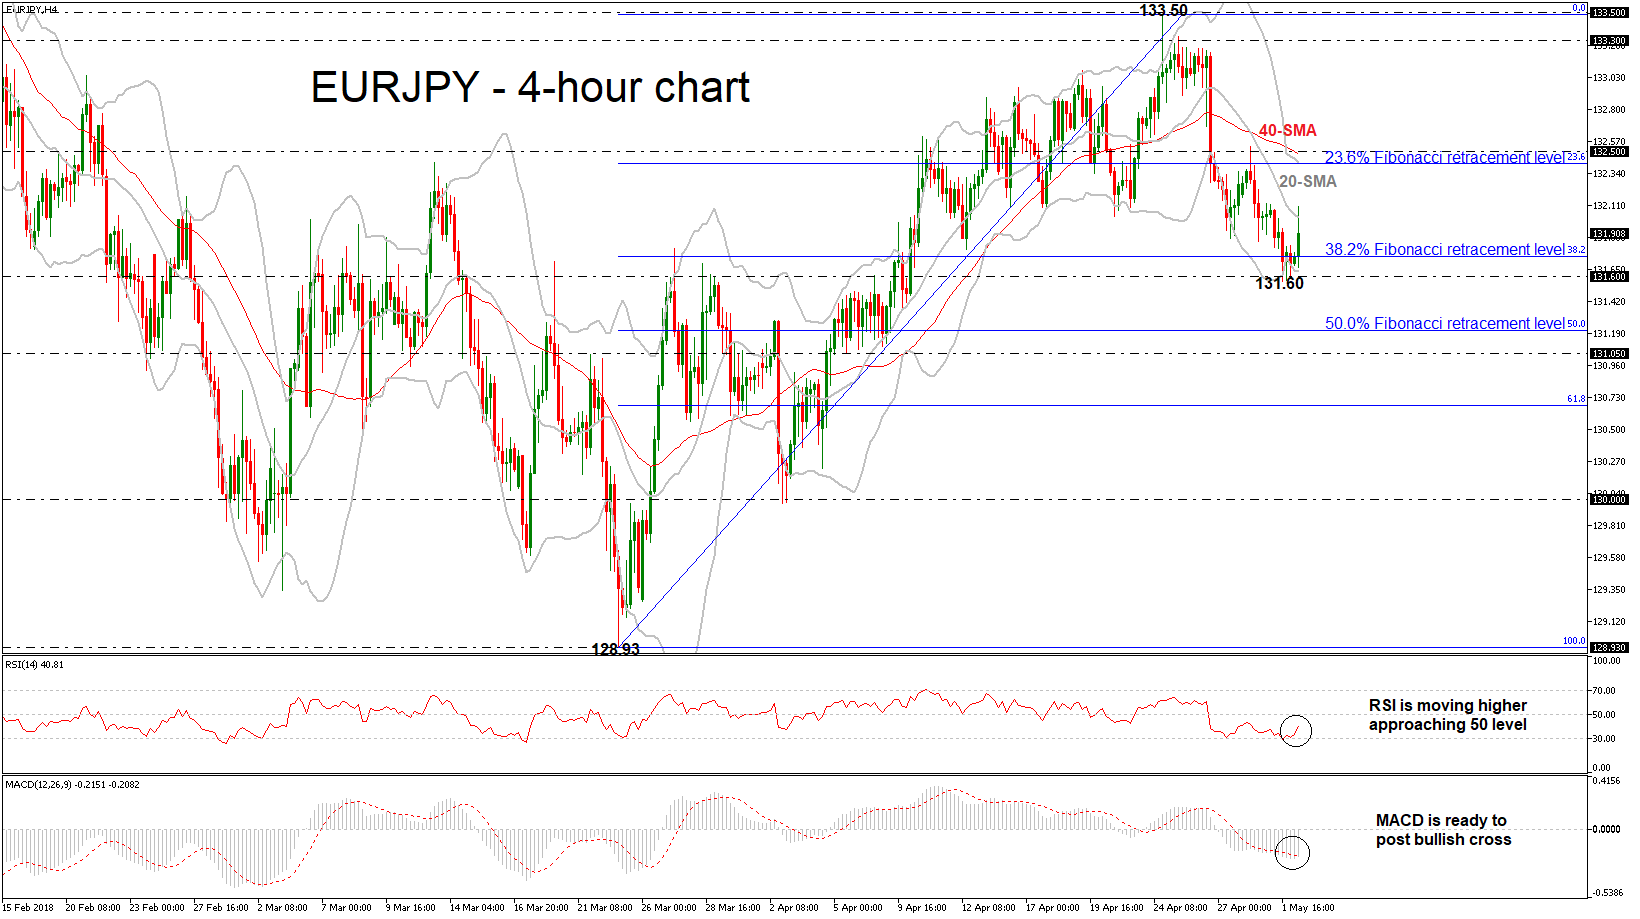
EURJPY is trading higher snapping five consecutive negative days in the short-term after it reached a three-week low of 131.60 during yesterday’s session. Furthermore, prices today successfully surpassed the 38.2% Fibonacci retracement level of 131.74 of the upleg from 128.93 to 133.50. A bullish pullback is expected further supported by the technical indicators.
Short-term momentum indicators are also pointing up for a creation of a bullish bias. The RSI indicator is turning positive in the negative zone, while the MACD oscillator is trying for a positive cross with the trigger line in the bearish area as well.
The price touched the mid-level of the Bollinger Band (20-SMA) over the last hours returning some gains. However, a climb above this obstacle could extend gains towards the upper Bollinger Band, which coincides with the 23.6% Fibonacci mark of 132.40 before hitting the 135.50 strong resistance barrier. A break above these barriers would shift the short-term bearish mode to a more bullish one as it would take the pair towards the 133.30 resistance.
Conversely, a resumption of the bearish correction in the 4-hour chart could drive the price below the 131.60 low until the 50.0% Fibonacci around 131.20. Further losses should see the 131.05 support taken from the troughs at the beginning of April.
EUR/USD Challenges Key 1.20 Support And 161.8% Fib Target
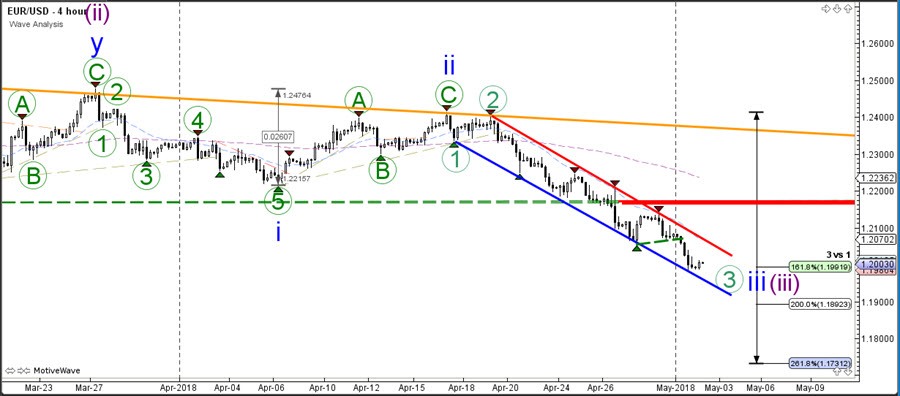
The EUR/USD broke the support trend line (dotted green) and continued within the downtrend channel. Price is now testing the key 1.20 round level which is a new bounce or break spot for the currency pair. The currency pair however has reached the 161.8% Fibonacci target which is making it more likely that the current bearish momentum is indeed a wave 3 (blue), which would indicate that more downside is possible and likely.
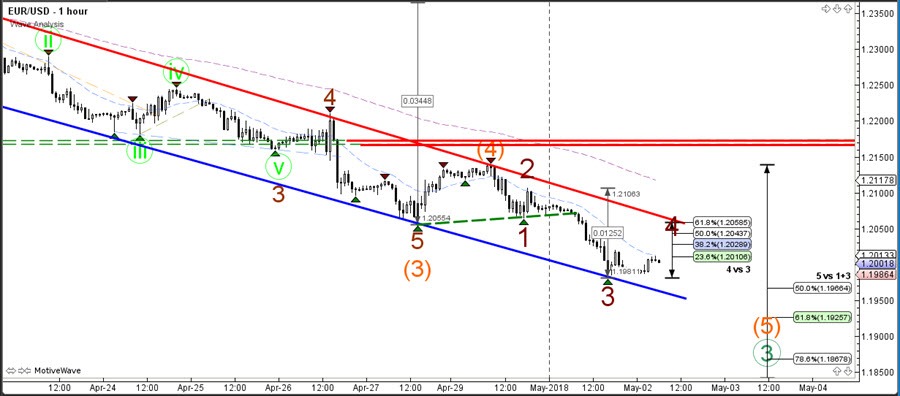
The EUR/USD is currently building a wave 4 (brown) correction and price could respect the Fib levels and make a bearish bounce and continuation towards the Fib targets of wave 5 (orange). A break above the 61.8% Fib invalidates the current wave 4.
GBP/USD Breaks 1.3750 Support And Extends The Bearish Wave 5
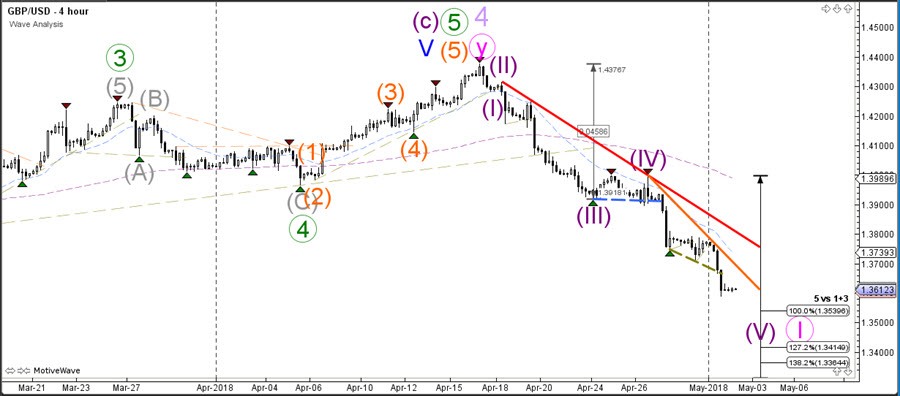
The GBP/USD bearish momentum broke support yet again. The impulse has now pushed below 1.3750 support and could extend its fall towards the Fibonacci targets within the wave 5 (purple). Price remains in larger bearish wave 1 as long as price stays below the resistance trend lines.
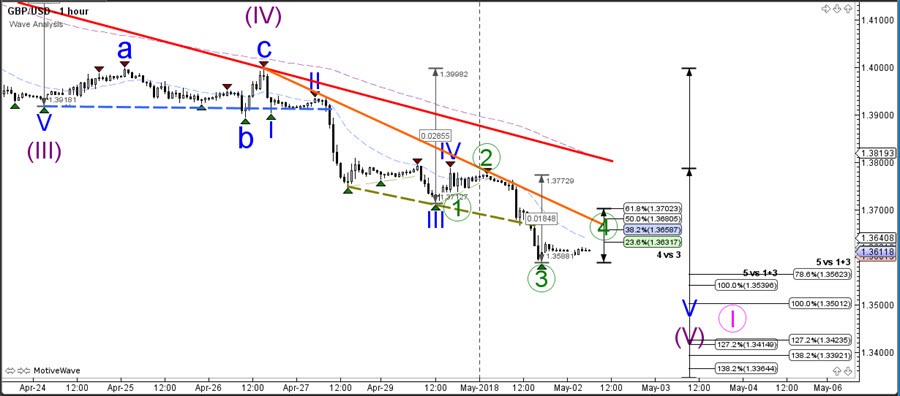
The GBP/USD is probably completing a wave 4 (green) correction and price could respect the Fib levels and make a bearish bounce and continuation towards the Fib targets of wave 5. A break above the 61.8% Fib invalidates the current wave 4.
GBP/JPY Daily Outlook
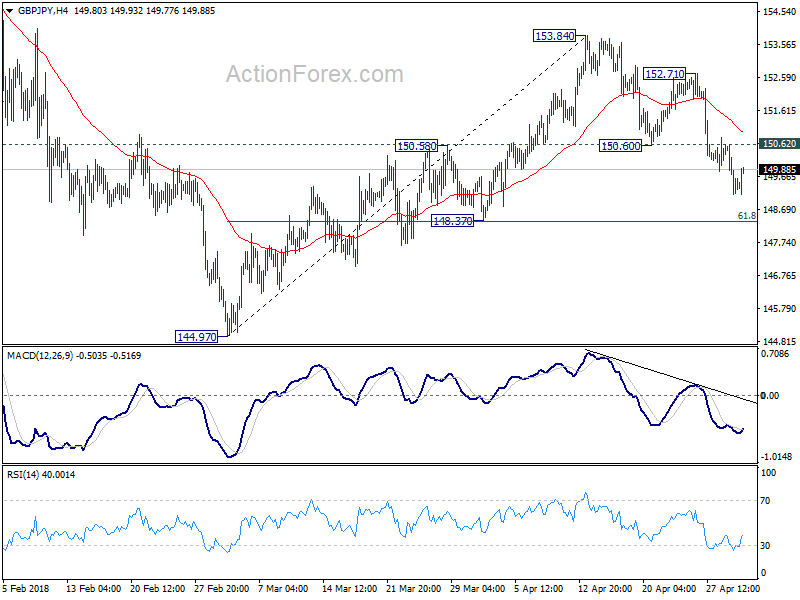
Daily Pivots: (S1) 148.93; (P) 149.78; (R1) 150.42; More...
With 150.62 minor resistance intact, intraday bias in GBP/JPY remains on the downside for 148.37 support. Current fall from 153.84 is seen as the third leg of the corrective pattern from 156.59. Break of 148.37 will pave the way to 144.97 and below. On the upside, above 150.62 minor support will turn intraday bias neutral first. But outlook will remain cautiously bearish as long as 152.71 resistance holds.
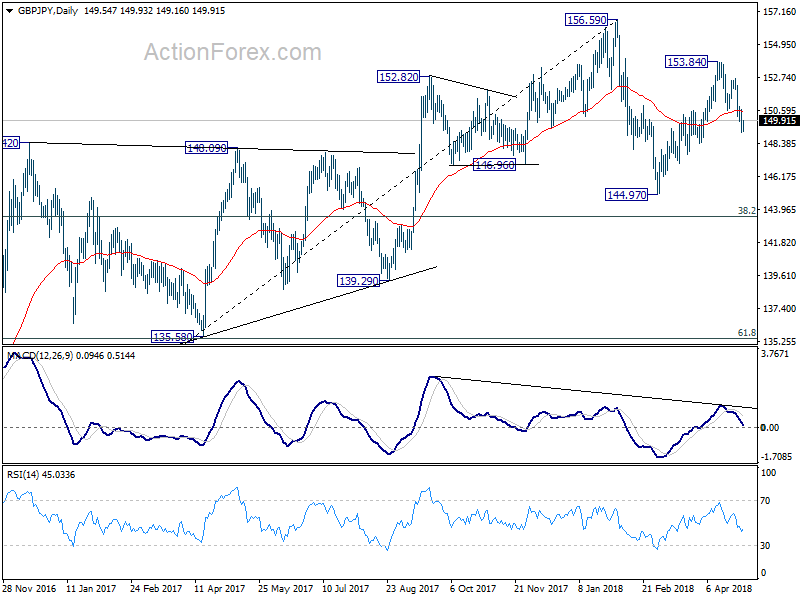
In the bigger picture, price actions from 156.59 are viewed as a corrective pattern. For now, we'd expect at least one more fall for 38.2% retracement of 122.36 to 156.59 at 143.51 before the consolidation completed. Though, firm break of 156.59 will resume whole up trend from 122.36 (2016 low) to 50% retracement of 195.86 (2015high) to 122.36 at 159.11 next.
EUR/JPY Daily Outlook
Daily Pivots: (S1) 131.52; (P) 131.82; (R1) 132.08; More....
Outlook in EUR/JPY remains unchanged. Corrective rise from 128.94 has completed at 133.47 already. Deeper decline should be seen back to retest 128.94 low. Break there will resume whole decline from 137.49. On the upside, above 132.53 minor resistance will delay the bearish case. Intraday bias would be turned to the upside to extend the rebound from 128.94. Still, we expect strong resistance from 61.8% retracement of 137.49 to 128.94 at 134.22 to limit upside and bring near term reversal eventually.
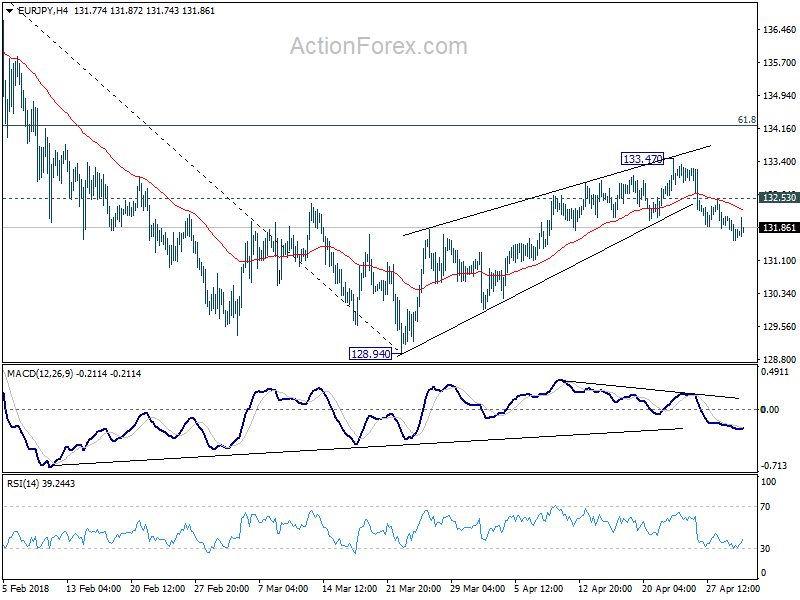
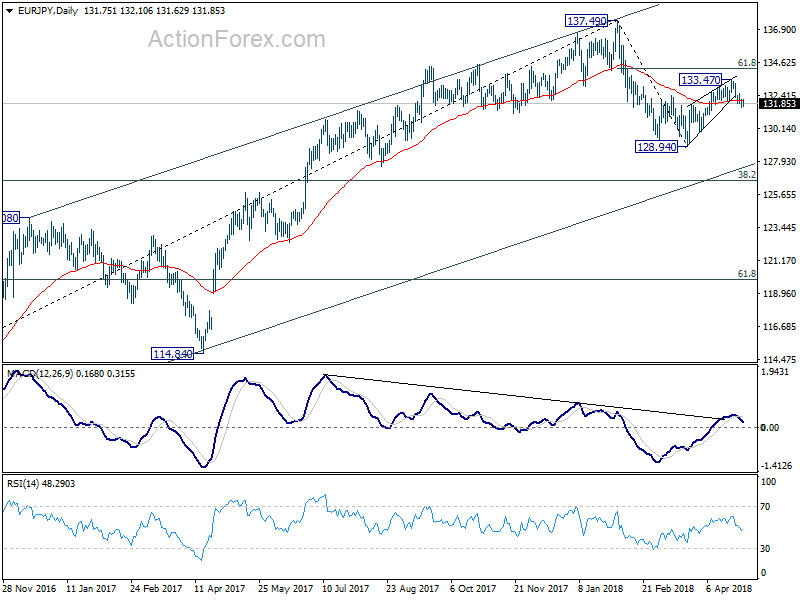
In the bigger picture, price action from 137.49 medium term top are developing into a corrective pattern. The first leg has completed at 128.94. The second leg might be finished at 133.47 or it might extend. But after all, we'd expect another decline through 128.94 to 38.2% retracement of 109.03 to 137.49 at 126.61 before completing the correction.
USD/JPY Approaches New Bounce Or Break Spot At 110
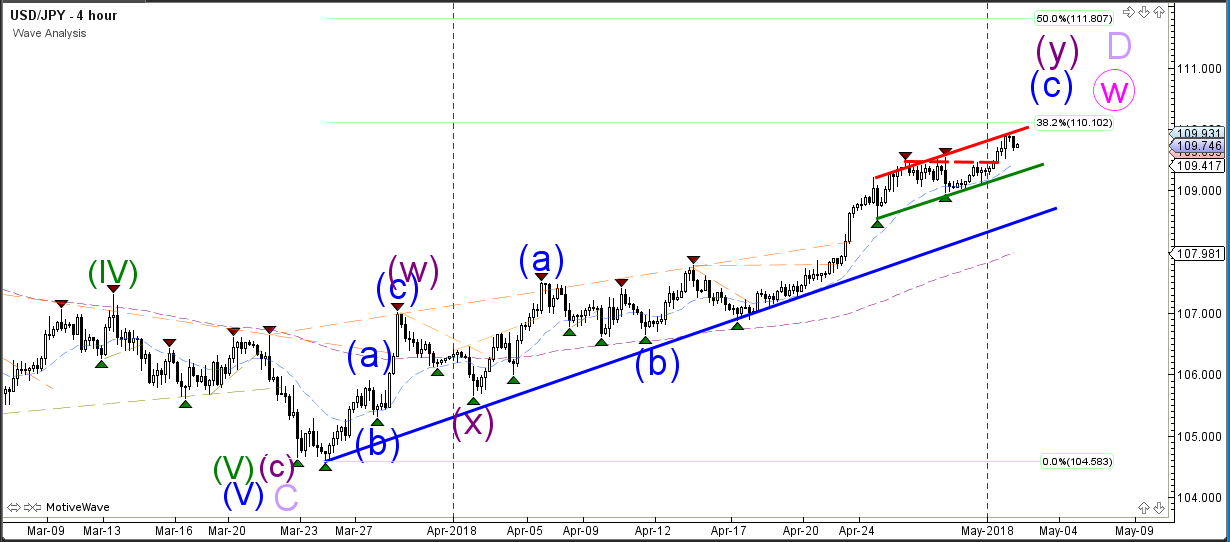
The USD/JPY is in an uptrend channel which is now approaching the 110 round level and 38.2% Fibonacci level of potential wave D (light purple). This could be a new bounce or break spot. A bullish breakout could see price make a continuation towards the 50% Fib whereas a bearish bounce could see price complete wave W (pink).
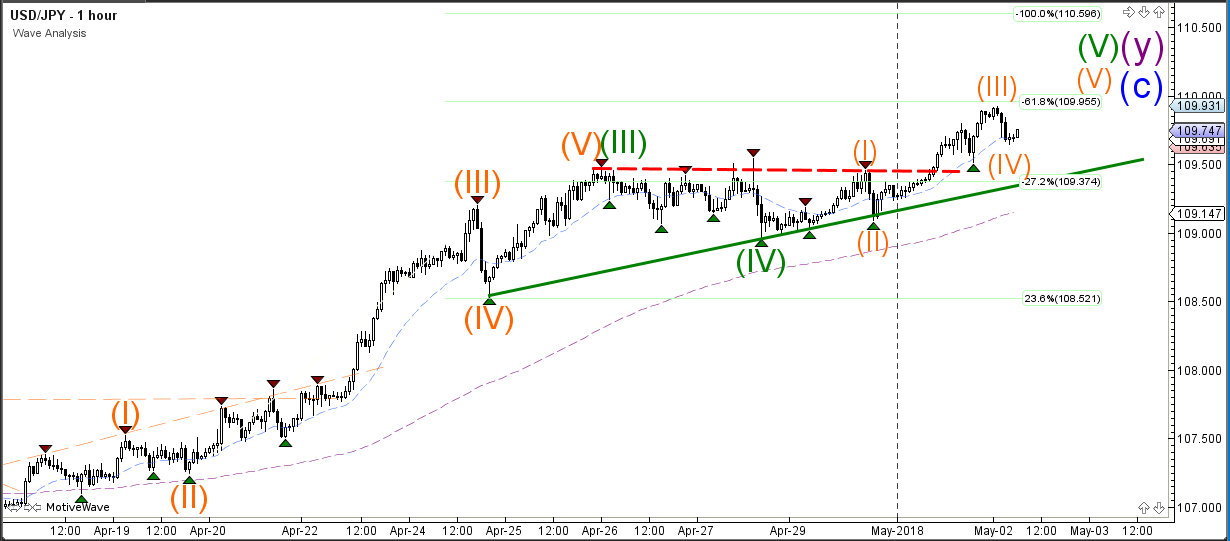
The USD/JPY bullish breakout could see an extension within wave 5 (green) with another internal 5 waves (orange). The current wave 4-5 (orange) pattern is invalidated if price breaks below the top of wave 1.
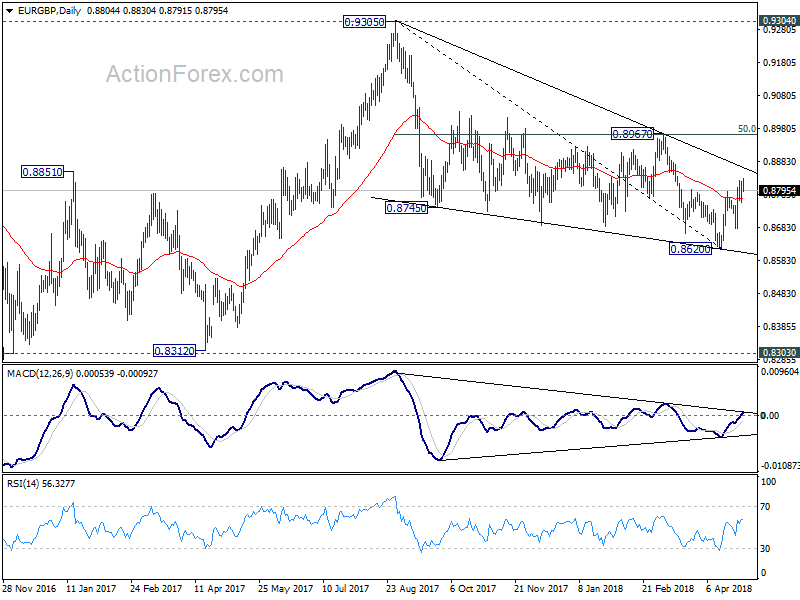
EUR/GBP Daily Outlook
Daily Pivots: (S1) 0.8771; (P) 0.8796; (R1) 0.8834; More...
EUR/GBP edged higher to 0.8830 today but quickly retreated. Intraday bias stays neutral first. On the upside, above 0.8830 will resume the rebound from 0.8620 and target 0.8967 cluster resistance next (50% retracement of 0.9305 to 0.8620 at 0.8963). Firm break there will confirm neat term reversal. On the downside, below 0.8760 minor support will turn focus back to 0.8679 support. Break there will suggests that larger decline from 0.9305 is resuming.
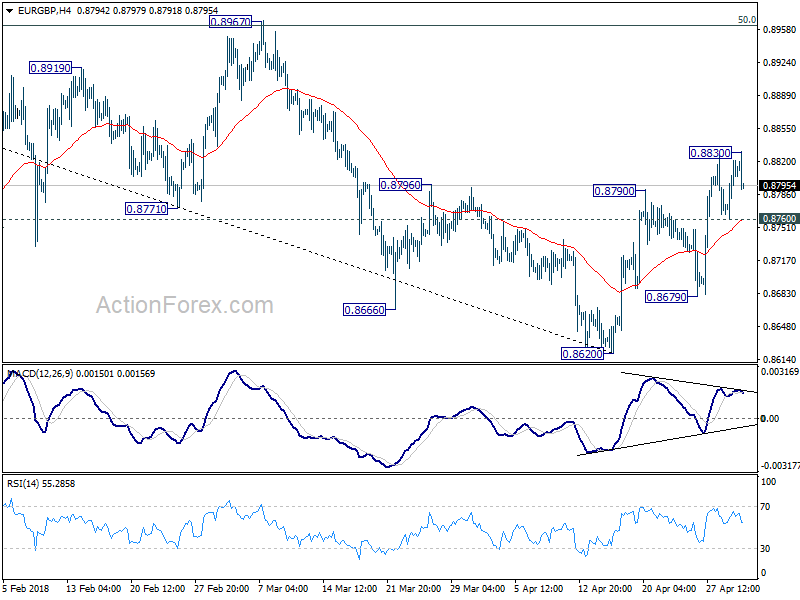
In the bigger picture, for now, the decline from 0.9305 is seen as a leg inside the long term consolidation pattern from 0.9304 (2016 high). Such consolidation pattern could extend further. Hence, in case of strong rally, we'd be cautious on strong resistance by 0.9304/5 to limit upside. Meanwhile, in another decline attempt, we'd expect strong support from 0.8116 cluster support (50% retracement of 0.6935 to 0.9304 at 0.8120) to contain downside.