Sample Category Title
AUD/USD Could Reject On Triple Bottom Retest
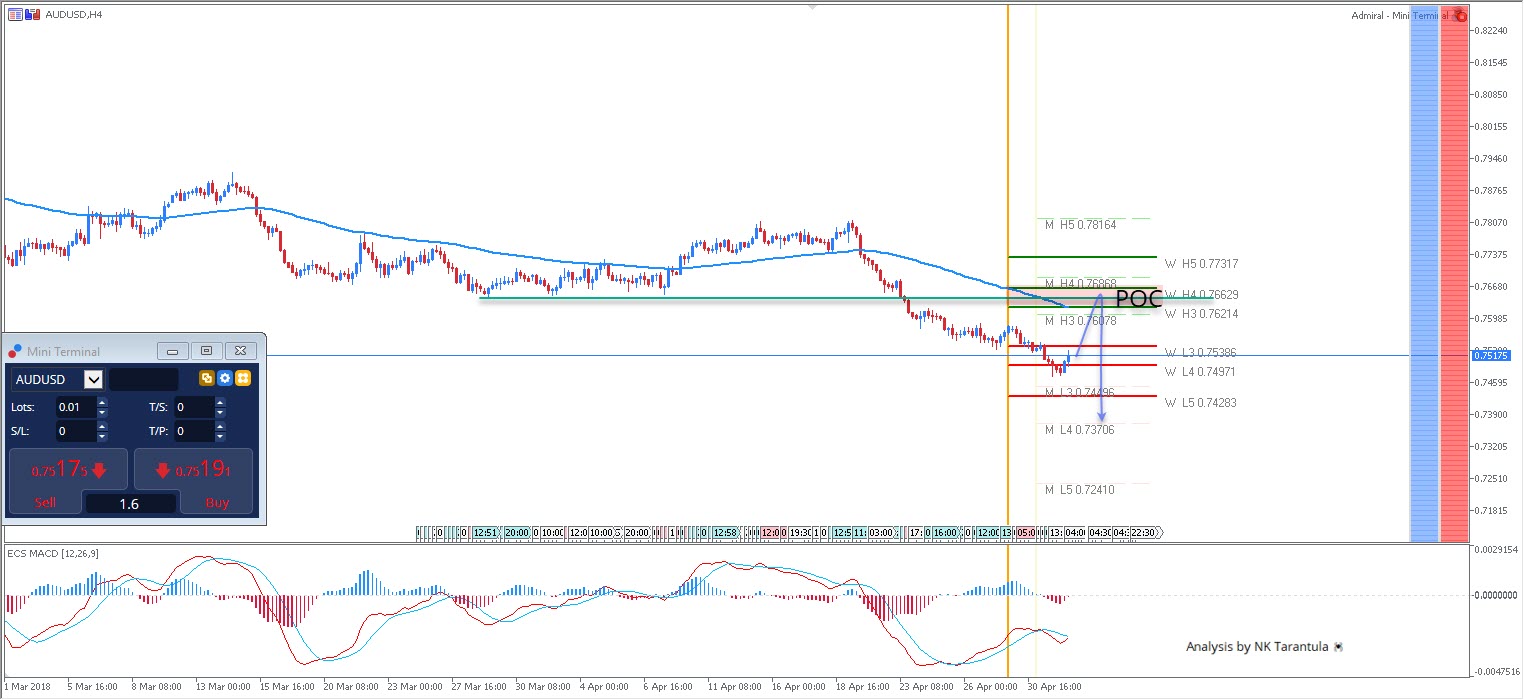
The AUD/USD has formed a downtrend swing and at this point it is trying to break the W L3 pivot. If it breaks it, traders need to focus on the POC 0.7620-60 as the price could go and retest the triple bottom (green line). That is the zone where we should see fresh sellers and the price could reject to 0.7450. Final target is 0.7370 but it can only be reached if the AUD/USD closes below 0.7450.
Source: Admiral Markets MT5 with MT5SE Add-on
W L3 - Weekly Camarilla Pivot (Weekly Interim Support)
W H3 - Weekly Camarilla Pivot (Weekly Interim Resistance)
W H4 - Weekly Camarilla Pivot (Strong Weekly Resistance)
M H4 - Monthly Camarilla Pivot (Very Strong Monthly Resistance)
M L3 – Monthly Camarilla Pivot (Monthly Support)
M L4 – Monthly H4 Camarilla (Very Strong Monthly Support)
POC - Point Of Confluence (The zone where we expect price to react aka entry zone)
EUR/AUD Daily Outlook
Daily Pivots: (S1) 1.6003; (P) 1.6030; (R1) 1.6067; More....
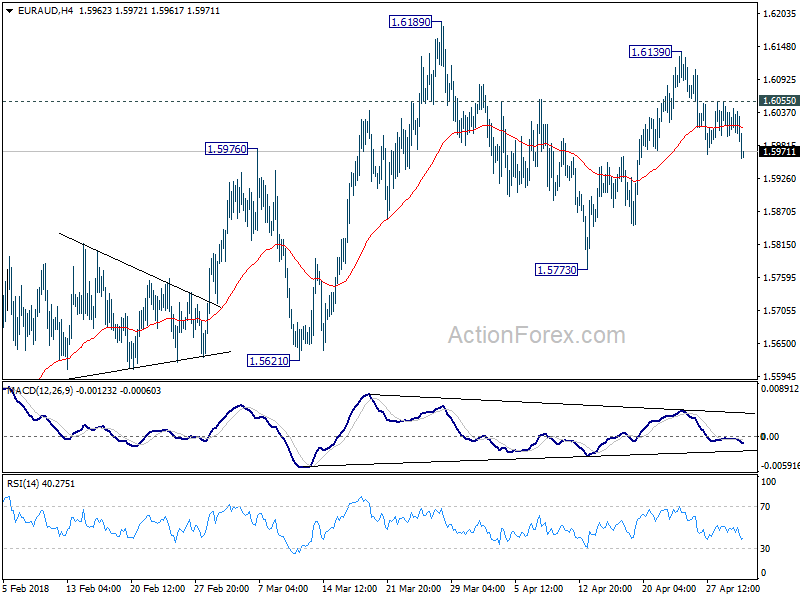
EUR/AUD's fall from 1.6139 is extending after brief consolidation. Intraday bias stays on the downside. Such decline is viewed as the third leg of the consolidation pattern from 1.6189. Further fall should be seen to 1.5773 support, or below. But downside should be contained above 1.5621 to bring rise resumption. On the upside, above 1.6055 minor resistance will turn bias to the upside for 1.6189 high again.
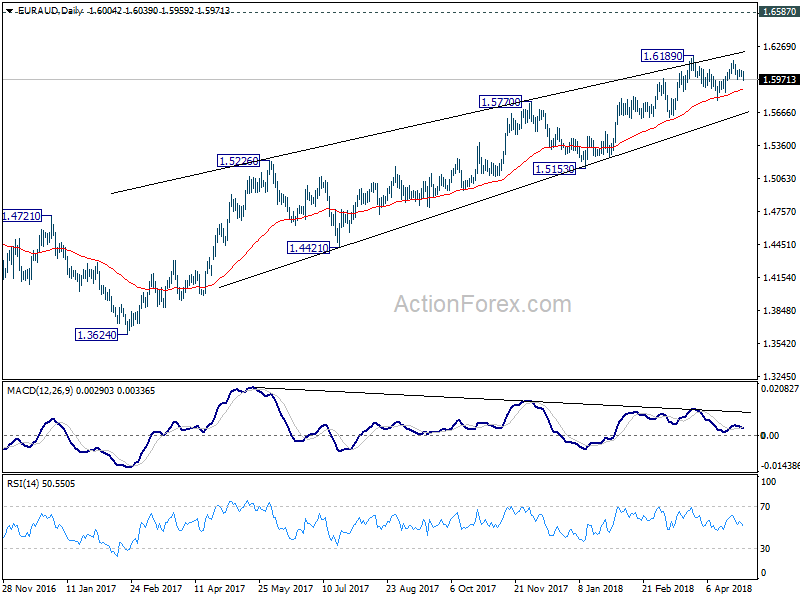
In the bigger picture, while there is bearish divergence condition in daily MACD, there is no clear sign of reversal yet. EUR/AUD also drew strong support from 55 day EMA and rebounded. Current rally from 1.3624 could still extend to 1.6587 key resistance (2015 high). Nonetheless, we'd expect further loss of upside momentum, and strong resistance from 1.6587 to limit upside and bring reversal. On the downside, sustained break of 1.5621 support should confirm reversal and turn outlook bearish for 1.5153 support and below.
EUR/CHF Daily Outlook
Daily Pivots: (S1) 1.1934; (P) 1.1953; (R1) 1.1971; More...
No change in EUR/CHF's outlook as consolidation from 1.2004 is extending. Intraday bias remains neutral. As long as 1.1888 minor support holds, further rally is expected. Decisive break of 1.2 will pave the way to 61.8% projection of 1.0629 to 1.1832 from 1.1445 at 1.2188. However, consider bearish divergence condition in 4 hour MACD, break of 1.1888 will indicate short term topping. In that case, deeper pull back would be seen back to 1.1445/1832 support zone.
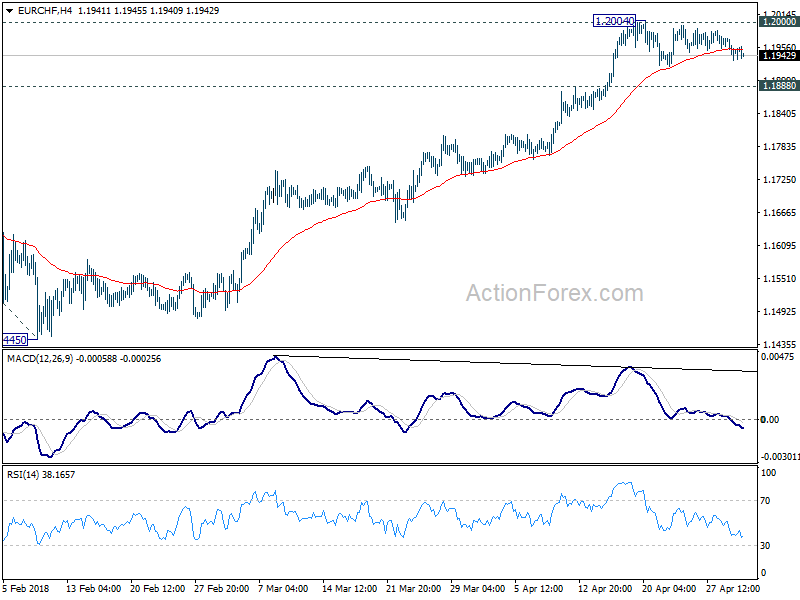
In the bigger picture, long term up trend in EUR/CHF is still in progress. Prior SNB imposed floor at 1.2003 was already met but there is no sign of reversal yet. As long as 1.1445 support holds, we'd expect the up trend to extend to 2013 high at 1.2649 next.
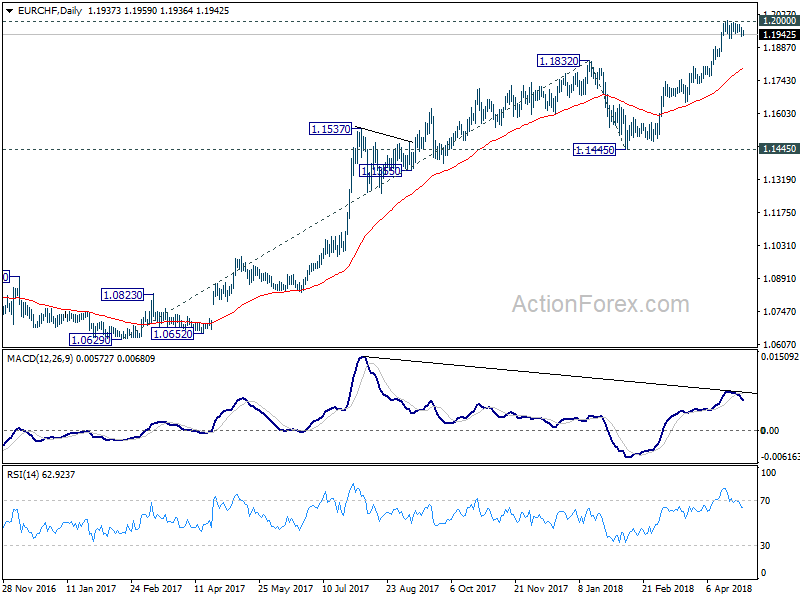
Eurozone unemployment rate unchanged at 8.5%, lowest since December 2008
Eurozone (EA19) unemployment rate was unchanged at 8.5% in March, staying at the lowest level since December 2008.
EU28 unemployment rate was unchanged at 7.1%, staying at lowest level since September 2008.
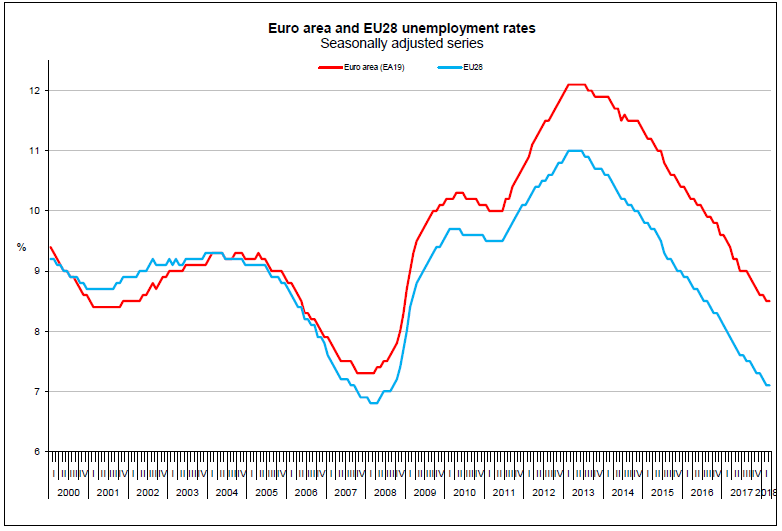
Among the member states, Czech Republic (2.2%), Malta (3.3%) and Germany (3.4%) recorded lowest unemployment rate.
Greece (20.6% in January 2018) and Spain (16.1%) recorded highest unemployment rate.
Eurozone GDP growth slowed to 0.4% qoq in Q1, met expectation, Euro steady
Eurozone (EA19) GDP growth slowed to 0.4% qoq in Q1, down from 0.7% qoq and met market expectations. Annually, GDP grew 2.5%, down from 2.8% in Q4.
EU28 GDP growth also slowed to 0.4% qoq in Q1, down from 0.6% yoy in Q4. Annual rate slowed to 2.4% yoy versus prior 2.7% yoy.
Euro is steadily in range against Dollar and Yen after the release. It tried to recover earlier today but overall, there is no follow through buying.
Forex Technical Analysis: EUR/USD, USD/JPY, GBP/USD
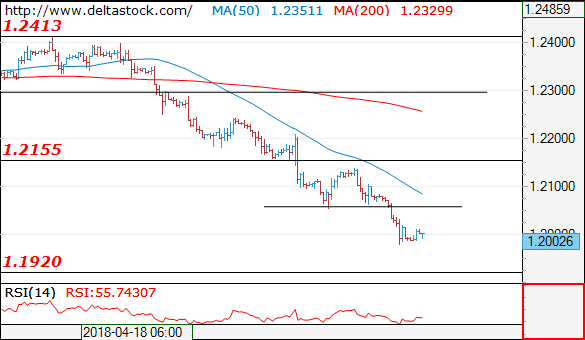
EUR/USD
Current level - 1.2002
The rebound above 1.2060 has been a short-lived one and the resistance at 1.2160 managed to cap the upside, so the bias remains bearish, for a slide towards 1.1920.
| Resistance | Support | ||
| intraday | intraweek | intraday | intraweek |
| 1.2060 | 1.2300 | 1.1920 | 1.1920 |
| 1.2160 | 1.2413 | 1.1840 | 1.1720 |
 USD/JPY
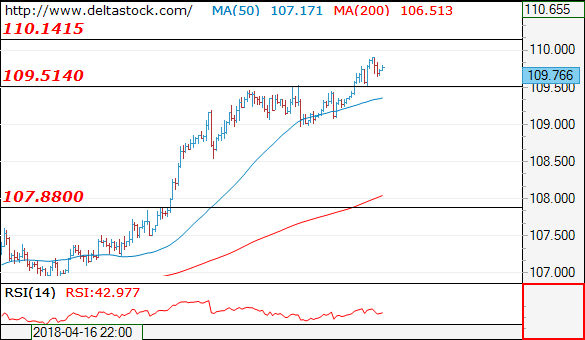
Current level - 109.76
The uptrend has been renewed with the climb above 109.50, for a test of 110.20-30 area. Crucial on the downside is 109.00 low.
| Resistance | Support | ||
| intraday | intraweek | intraday | intraweek |
| 110.20 | 110.20 | 109.50 | 106.60 |
| 111.30 | 111.90 | 108.50 | 104.60 |
GBP/USD
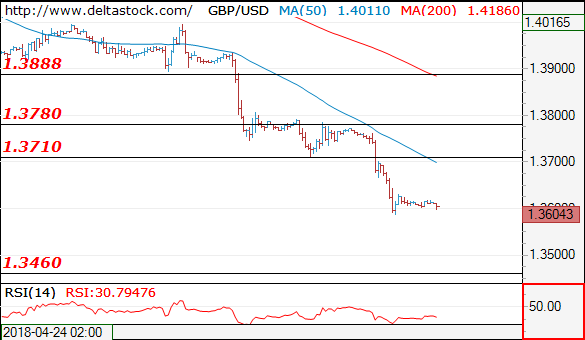
Current level - 1.3604
The bias remains bearish after the break through 1.3710 and next major support is projected at 1.3460. Key resistance lies at 1.3710 and crucial on the upside is 1.3790.
| Resistance | Support | ||
| intraday | intraweek | intraday | intraweek |
| 1.3710 | 1.3990 | 1.3600 | 1.3460 |
| 1.3790 | 1.4100 | 1.3460 | 1.3310 |
GBP recovers as UK PMI construction rose to 5 month high, beat expectations
UK PMI construction rose to 52.5 in April, up fro 47.0 and beat expectation of 50.5. That's also the highest reading in 5 months. GBP responds positive to the upside surprise and is attempting to rebound.
Comments from Tim Moore, Associate Director at IHS Markit:
"A rebound in construction activity was pretty well inevitable after snowfall resulted in severe disruptions on site during March. House building led the way, with growth in April among the strongest seen over the past two-and-a-half years. However, the picture was less positive in other areas of construction, with commercial building and civil engineering work rising only marginally.
"While temporary factors make it difficult to gauge underlying momentum, the recovery from March's low point is somewhat underwhelming and provides an indication that the construction sector has been treading water at the very best in recent months.
"A consistent theme so far this year has been fragile demand conditions and subdued volumes of incoming new work. Survey respondents noted that heightened economic uncertainty continued to hold back construction growth in April, with risk aversion among clients leading to delays with spending decisions on new projects."
EUR/USD Analysis: Should Finally Edge Higher
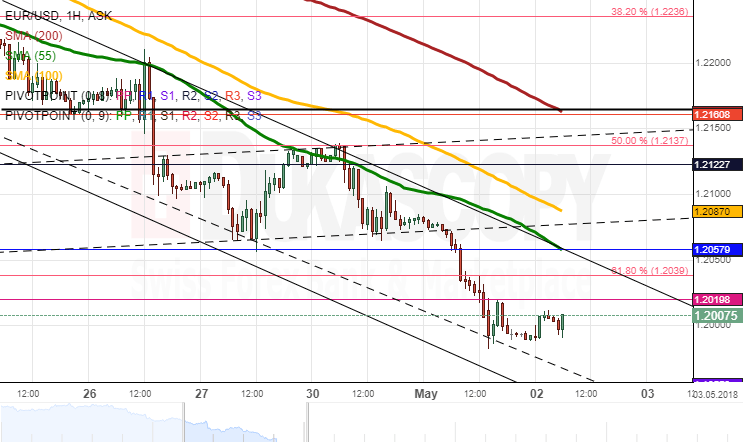
The strong downside potential which has guided the EUR/USD exchange rate since mid-April remained dominant on Tuesday, as well. The Euro plunged 91 pips against its American counterpart during the first part of the day, while the evening and this morning introduced no changes to the pair's positioning.
The aforementioned fall was stopped by a dashed short-term trend-line at 1.9920. Technical indicators are already pushing higher from historic lows, thus suggesting that the previously-expected recovery should finally occur today.
The closest resistance is set by the 61.80% Fibonacci retracement and the weekly S1 at 1.2035; however, the possibility of the pair appreciating until the 55– and 100-hour SMAs at 1.2090 should not likewise be excluded. Support is provided by the weekly S1 at 1.1950.
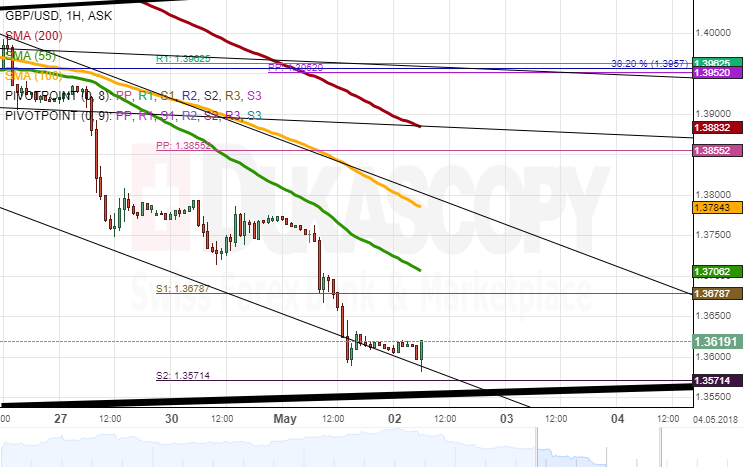
GBP/USD Analysis: Plunges To 1.36
Downside pressure prevailed on Tuesday and thus sent GBP/USD for another decline. This bearish momentum began in the wake of disappointing UK Manufacturing PMI released early in the day. It continued to dominate even further until the 1.36 mark was reached.
As apparent on the chart, the pair has not still touched the senior channel and the weekly S2 near 1.3550. Thus, this move might occur during the first part of the day. The monthly S1 is likewise located nearby at 1.3527.
Meanwhile, the pair is trading near the bottom boundary of a two-week channel. Even if the aforementioned falls occurs in the following hours, the Pound should eventually strengthen against the US Dollar with gains being capped near 1.38.
By and large, traders might be calm before the FOMC statement today
USD/JPY Analysis: Returns To Medium – Term Pattern
The general strengthening of the US Dollar against major currencies on Tuesday had a positive impact on the given pair. As a result, the rate manage to strengthen by 0.56%, thus ending the previously-existing four-day period of consolidation.
It is still likely that some upside potential is realised in this session towards the medium-term channel and the 61.80% Fibonacci retracement near 110.20. This movement should be guided by the 55– and 100-hour SMA. Further advance is not expected during the first part of today.
Meanwhile, the Fed is to release its Monetary Statement at 1800GMT. Traders expect that a rate hike has to be put on hold this time; thus, a surprise would introduce massive volatility in the market and consequently breach the nearest support and resistance levels.