Sample Category Title
EUR/USD Weekly Outlook
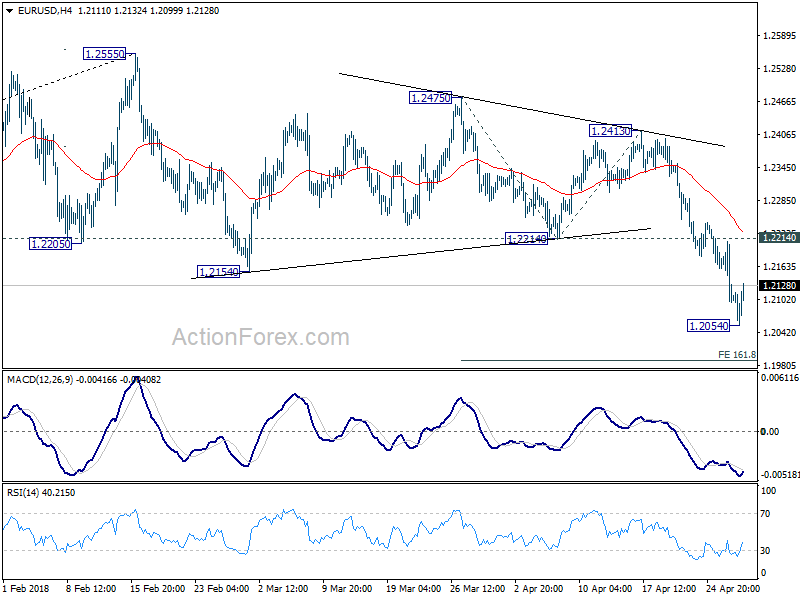
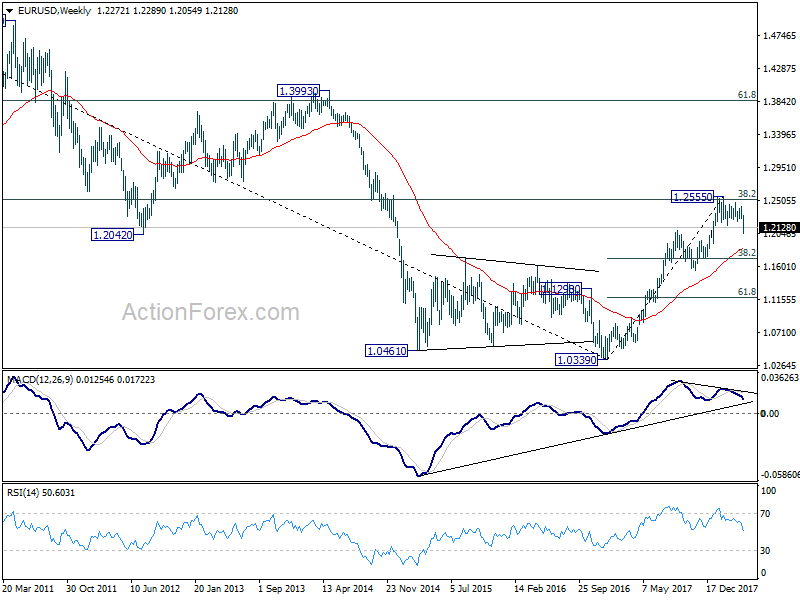
EUR/USD's dropped sharply to 1.2054 last week. The strong break of 1.2154 key support confirmed medium term topping at 1.2555. But as a temporary low as formed at 1.2054, initial bias is neutral this week for some consolidations first. Upside of recovery should be limited by 1.2214 support turned resistance to bring another decline. Below 1.2054 will target 161.8% projection of 1.2475 to 1.2214 from 1.2413 at 1.1991 first. Break will target 200% projection at 1.1891.
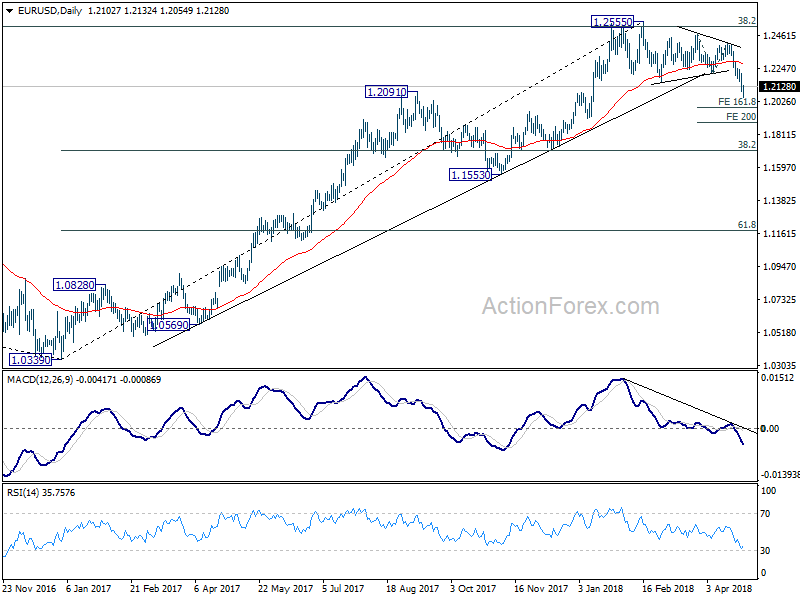
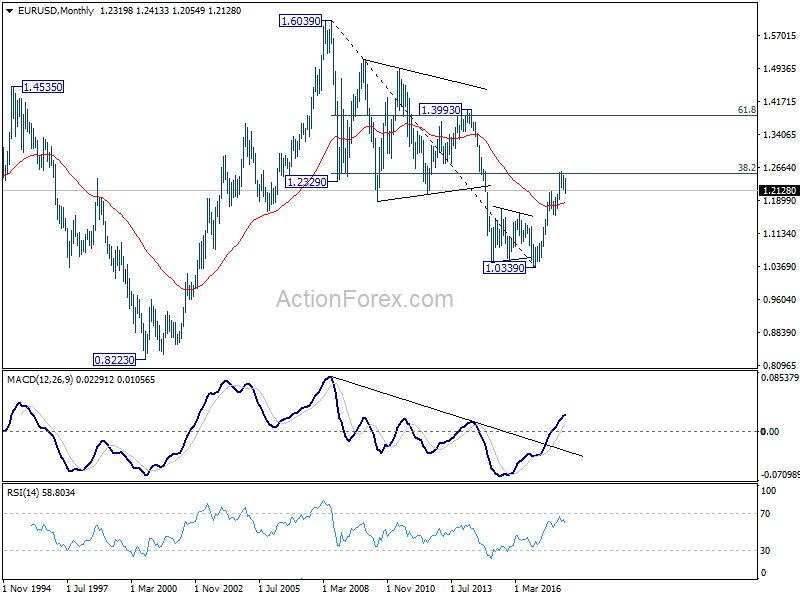
In the bigger picture, current decline and firm break of 1.2154 support confirms rejection by 38.2% retracement of 1.6039 (2008 high) to 1.0339 (2017 low) at 1.2516. A medium term top should be in place at 1.2555 and deeper decline would be seen back to 38.2% retracement of 1.0339 to 1.2555 at 1.1708 first. We'll look at the structure and momentum of such decline before decision if it's an impulsive or corrective move.
In the long term picture, 1.0339 is seen as an important bottom as the down trend from 1.6039 (2008 high) could have completed. It's still early to decide whether price action from 1.0339 is developing into a corrective or impulsive pattern. Reaction to 38.2% retracement of 1.6039 to 1.0339 at 1.2516 will give important clue to the underlying momentum.
USD/JPY Weekly Outlook
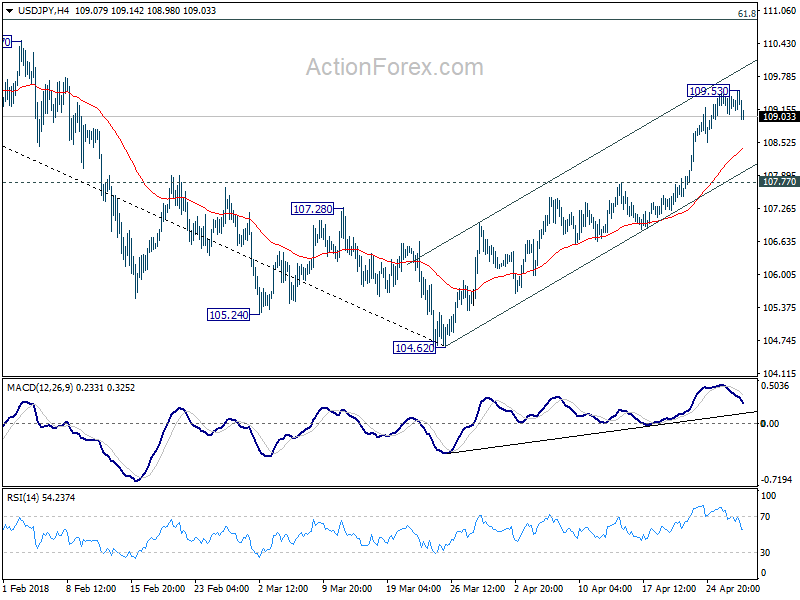
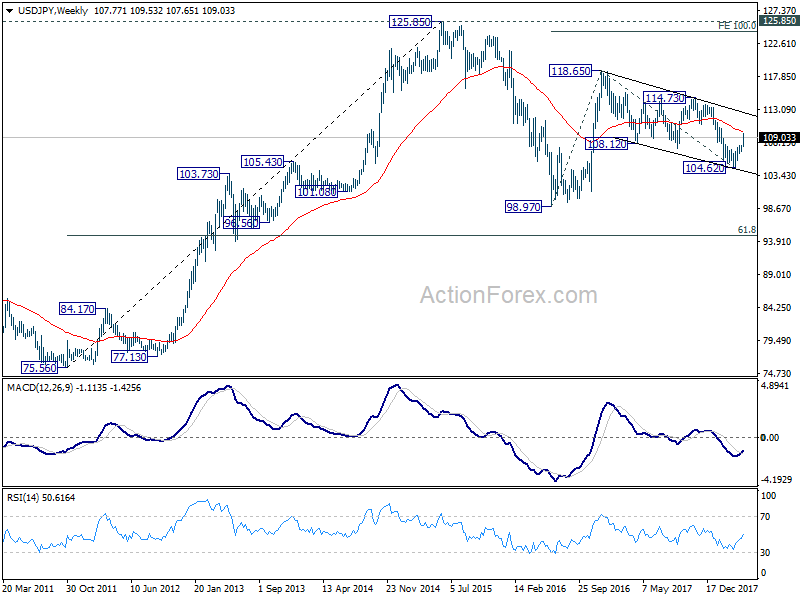
USD/JPY rose to as high as 109.53 last week but formed a temporary top there on loss of momentum. Initial bias is neutral this week for consolidations. Downside of retreat should be contained by 107.77 resistance turned support to bring another rally. Break of 109.53 will resume the rise from 104.62 and target 61.8% retracement of 114.73 to 104.62 at 110.86 next.
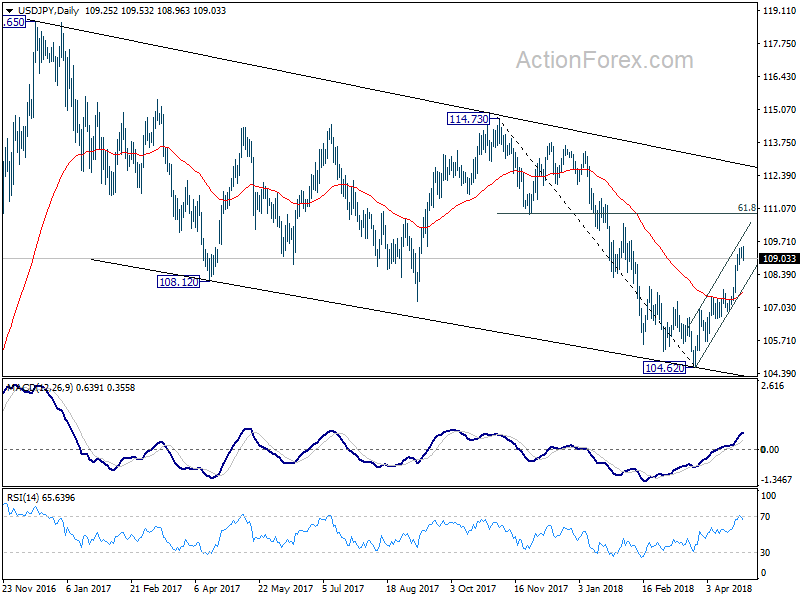
In the bigger picture, break of 108.12 support turned resistance now suggests that corrective fall from 118.65 (2016 high) has completed with three waves down to 104.62. And, rise from 98.97 (2016 low) could be resuming. Focus is back on 114.73 resistance and break there will pave the way to 118.65 and above. This will now be the preferred case as long as USD/JPY stays above 55 day EMA (now at 107.60).
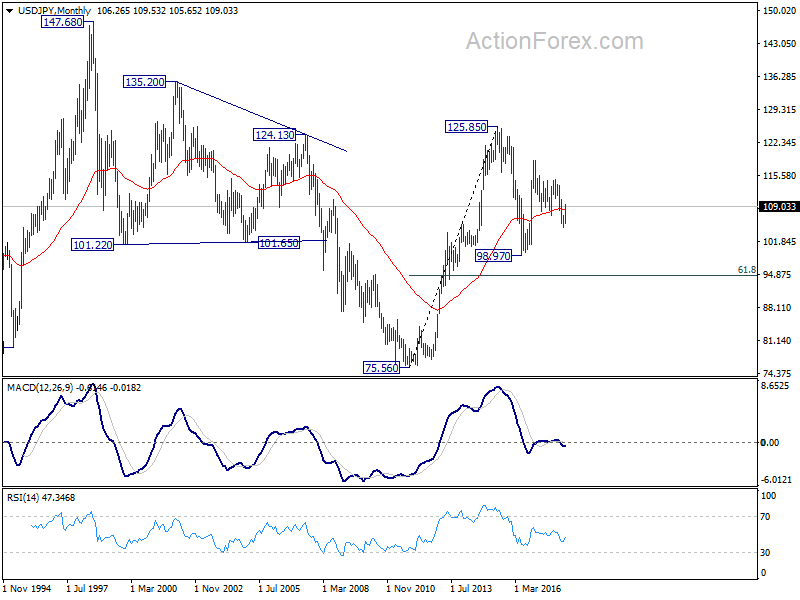
In the long term picture, the rise from 75.56 (2011 low) long term bottom to 125.85 top is viewed as an impulsive move, no change in this view. Price actions from 125.85 are seen as a corrective move which could still extend. In case of deeper fall, downside should be contained by 61.8% retracement of 75.56 to 125.85 at 94.77. Up trend from 75.56 is expected to resume at a later stage for above 135.20/147.68 resistance zone.
GBP/USD Weekly Outlook
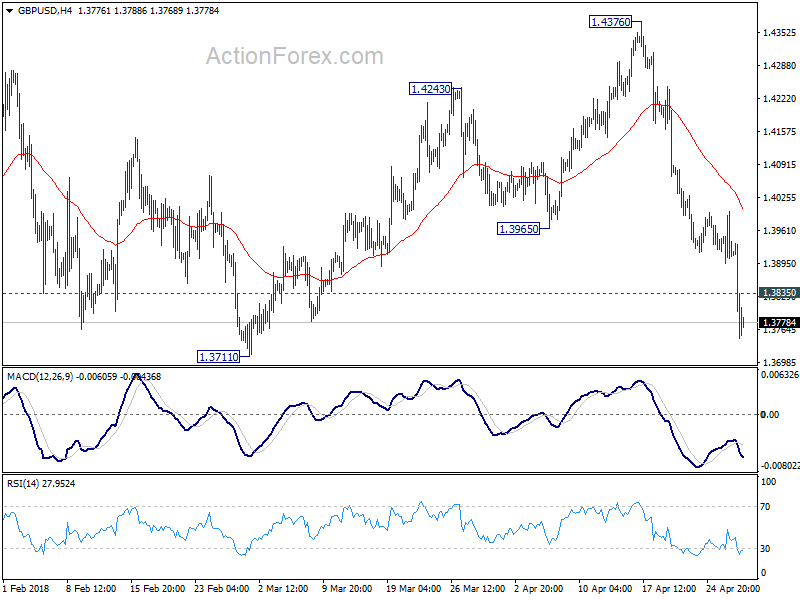
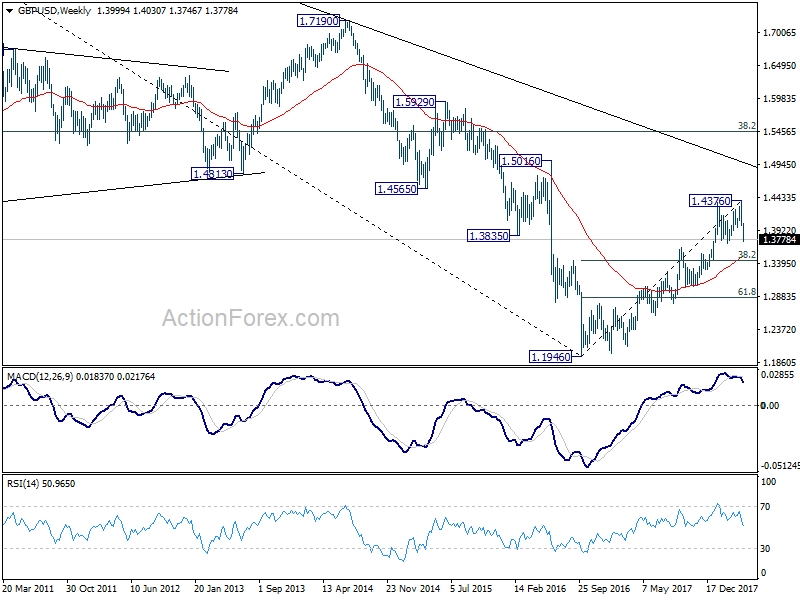
GBP/USD's decline from 1.4376 extended to as low as 1.3746 last week and there is no sign of bottoming yet. Initial bias remains on the downside this week for 1.3711 key support level. Decisive break there should confirm medium term reversal and target 1.3448 fibonacci level. On the upside, above 1.3835 minor resistance. will turn intraday bias neutral and bring consolidations first, before staging another fall.
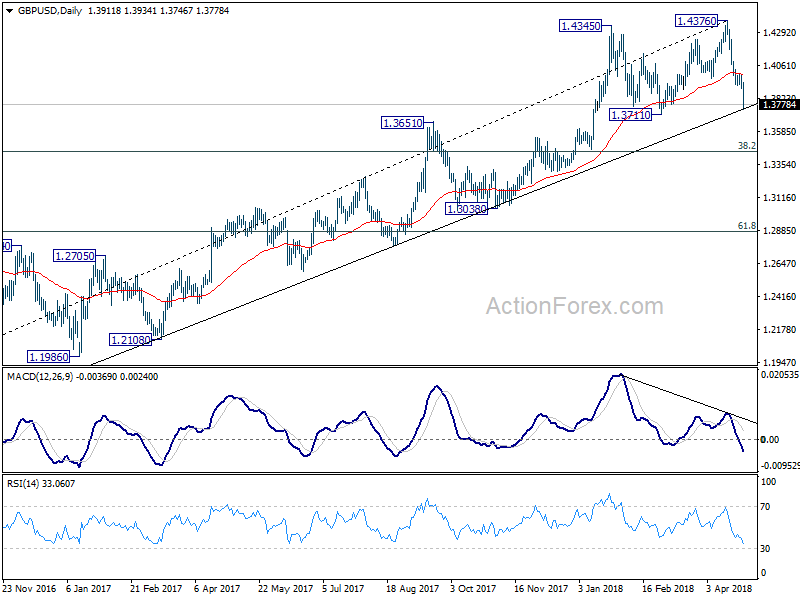
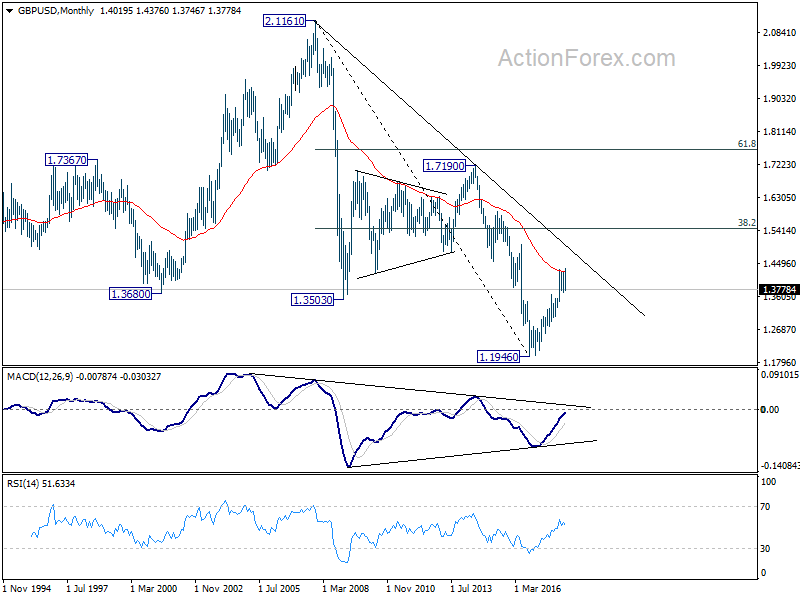
In the bigger picture, bearish divergence condition in daily MACD is raising the chance of medium term reversal. Also, note that GBP/USD has just failed to sustain above 55 month EMA (now at 1.4257) again. Focus is back on 1.3711 support. Firm break there will confirm medium term reversal and target 38.2% retracement of 1.1936 (2016 low) to 1.4376 at 1.3448 first. Break will target 61.8% retracement at 1.2874 and below. For now, sustained break of 55 month EMA is needed to confirm medium term upside momentum. Otherwise, we won't turn bullish even in case of strong rebound.
In the longer term picture, rise from 1.1946 (2016 low) is viewed as a corrective move, no change in this view. Focus stays on 55 month EMA (now at 1.4257). Rejection from there will turn focus back to 1.1946 low and could probably extend the down trend from 2.1161. On the other hand, sustained break of the EMA would at least bring further rally to 38.2% retracement of 2.1161 (2007 high) to 1.1946 (2016 low) at 1.5466.
USD/CHF Weekly Outlook
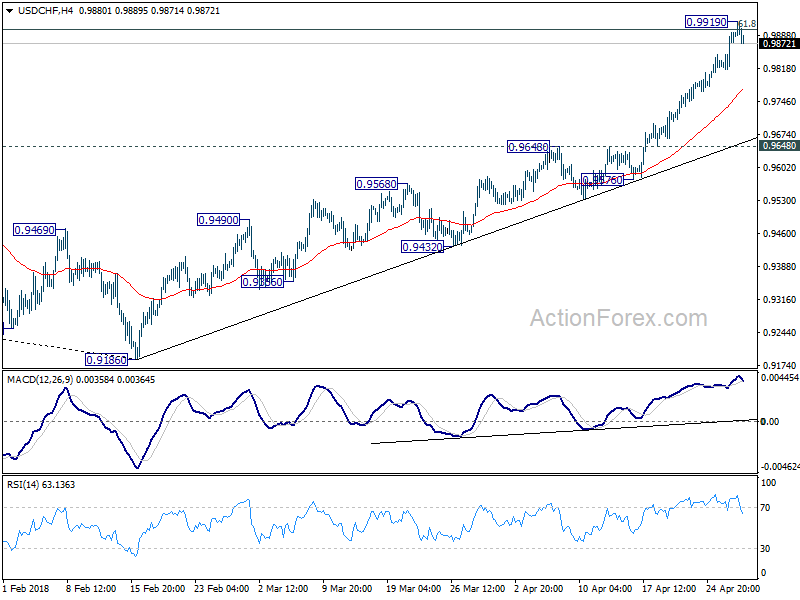
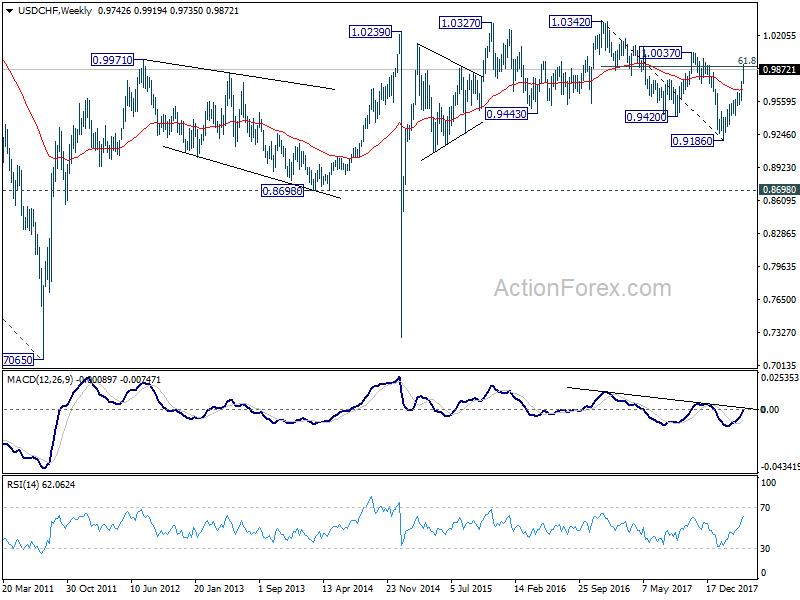
USD/CHF's rally extended to as high as 0.9919 last week and met target of 0.9900 fibonacci level. A temporary top is likely in place and thus, initial bias is neutral this week for some consolidations first. Downside of retreat should be contained above 0.9648 resistance turned support and bring another rally. Above 0.9919 will target 1.0037 resistance next.
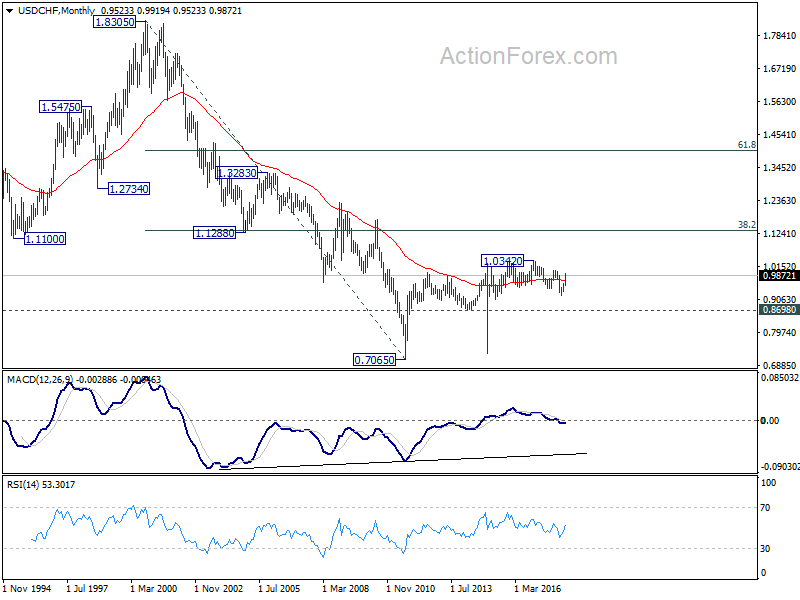
In the bigger picture, medium term decline from 1.0342 has completed with three waves down to 0.9186. Rise from there is currently viewed as a leg inside the long term range pattern. Hence, while further rally would be seen, we'd be cautious on strong resistance from 1.0342 to limit upside. For now, further rise is expected as long as 0.9648 resistance turned support holds, even in case of pull back.
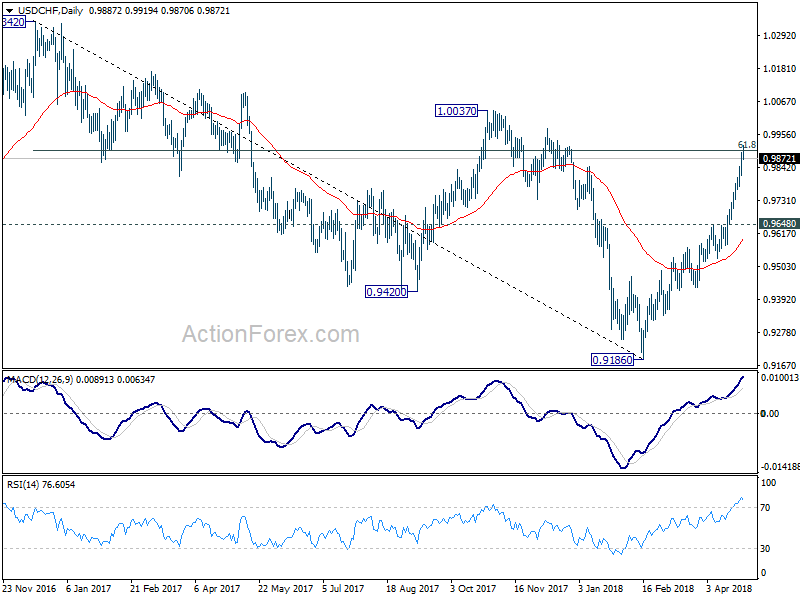
In the long term picture, price actions from 0.7065 (2011 low) are not clearly impulsive yet. Thus, we'll treat it as developing into a corrective pattern, at least, until a firm break of 1.0342 resistance.
AUD/USD Weekly Outlook
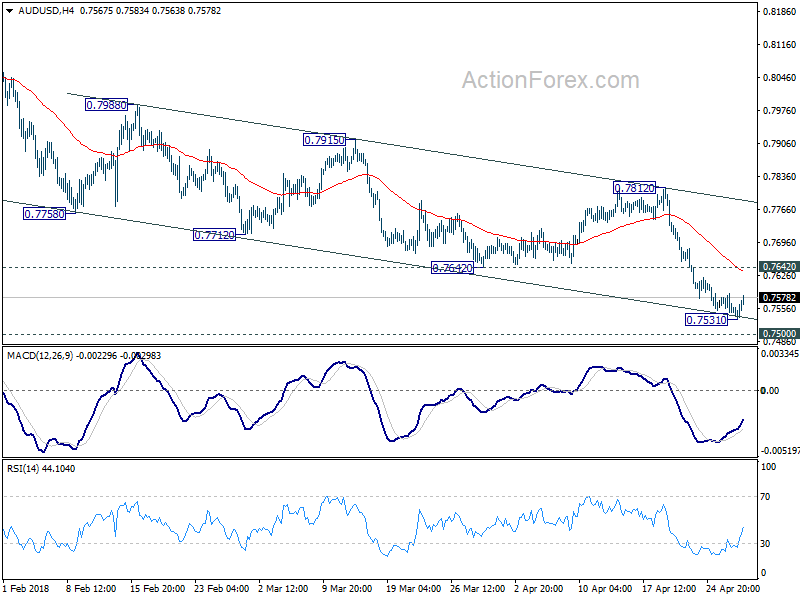
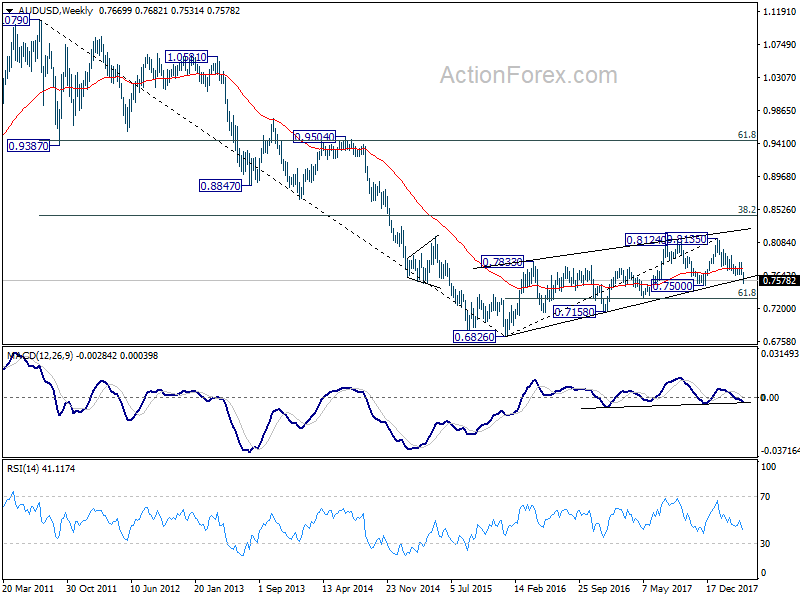
AUD/USD's decline from 0.8135 resumed last week and dropped to as low as 0.7531. As a temporary low was formed after hitting near term channel support, initial bias is neutral this week first. Some consolidations would be seen but upside should be limited by 0.7642 support turned resistance. Below 0.7531 will target 0.7500 key support level. However, firm break of 0.7642 will be an early sign of near term reversal and turn focus back to 0.7812 resistance.
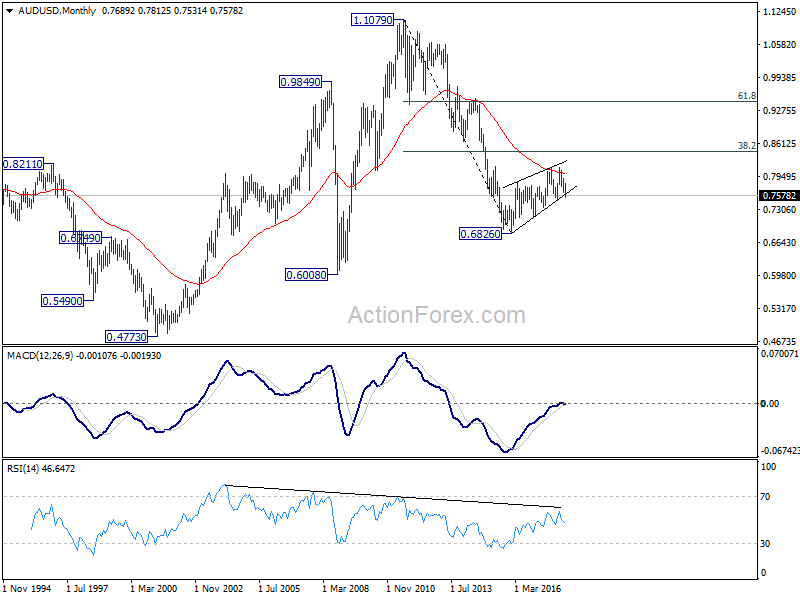
In the bigger picture, medium term rebound from 0.6826 is seen as a corrective move. Decisive break of 0.7500 key support will suggest that such correction is completed. In that case, deeper decline would be seen back to retest 0.6826 low. In case of another rise, we'd expect strong resistance from 38.2% retracement of 1.1079 to 0.6826 at 0.8451 to limit upside to bring long term down trend resumption eventually.
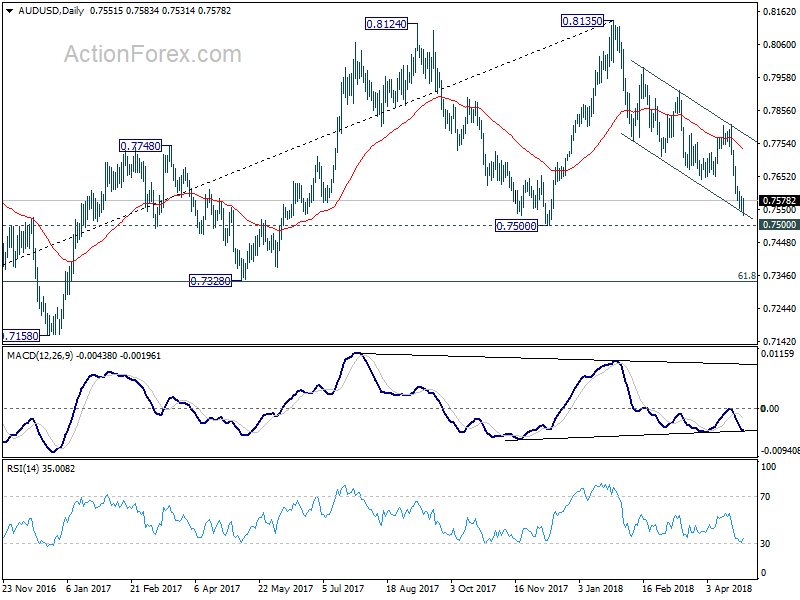
In the longer term picture, 0.6826 is seen as a long term bottom. Rise from there could either reverse the down trend from 1.1079, or just develop into a corrective pattern. At this point, we're favoring the latter. And, as long as 38.2% retracement of 1.1079 to 0.6826 at 0.8451 holds, we'd anticipate another decline through 0.6826 at a later stage. But strong support should be seen between 0.4773 (2001 low) and 0.6008 (2008 low).
USD/CAD Weekly Outlook
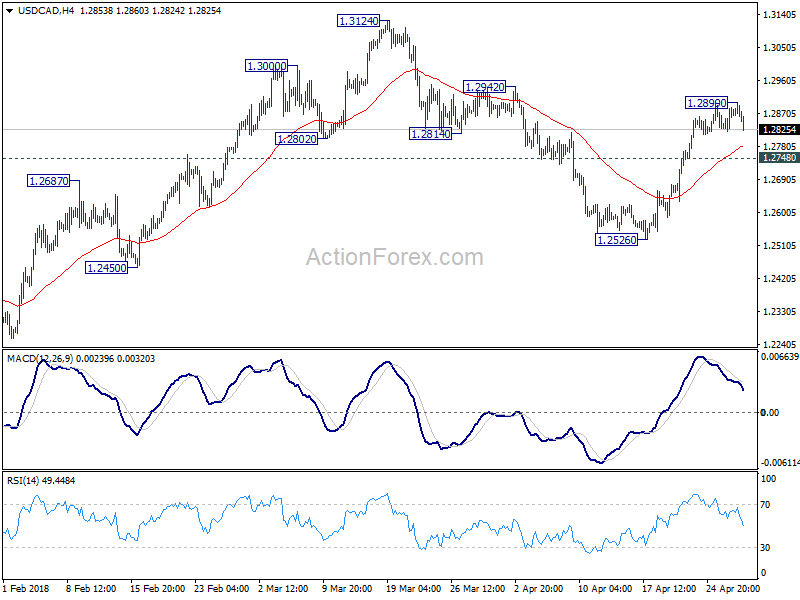
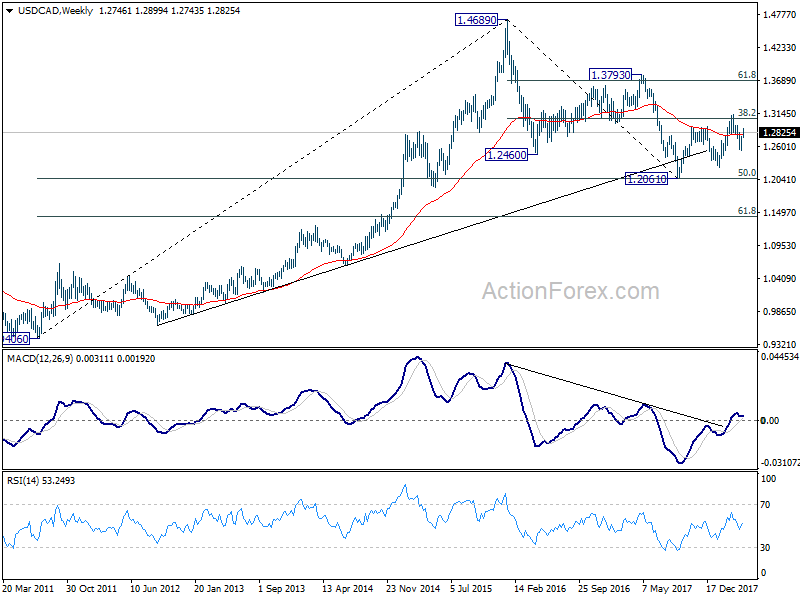
USD/CAD rebounded further to as high as 1.2899 last week before forming a temporary top there and retreated. Initial bias is neutral this week first and some consolidations could be seen. For now, decline from 1.3124 is seen as completed with three waves down to 1.2526. The corrective structure suggests that later rebound from 1.2061 is not completed. Hence, retreat from 1.2899 should be contained by 1.2748 minor support and bring another rally. Break of 1.2899 will target 1.3124 high. However, firm break of 1.2748 will turn focus back to 1.2526 support instead.
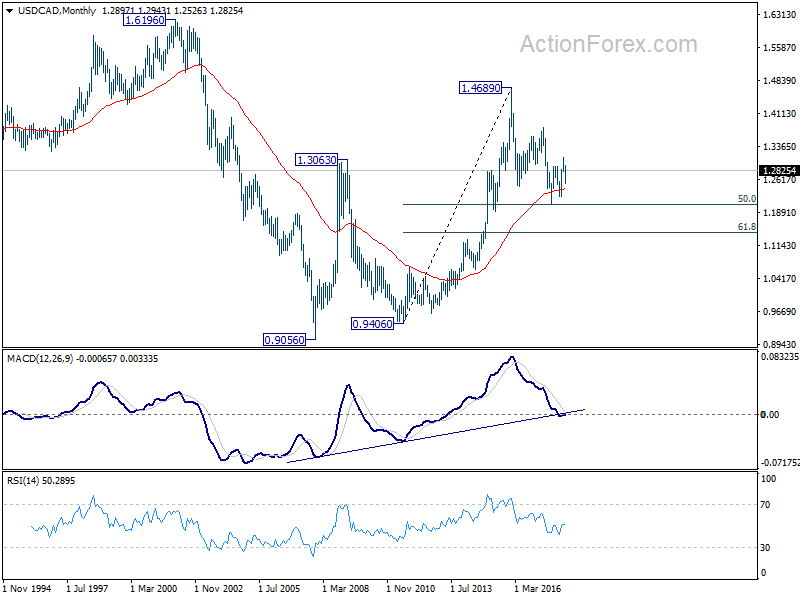
In the bigger picture, current development suggests that rebound from 1.2061 has not completed yet. Focus is back on 38.2% retracement of 1.4689 to 1.2061 at 1.3065. Sustained trading above there will confirm medium term bullish reversal. That is, down trend from 1.4689 has completed at 1.2061 already. In that case, next target will be 61.8% retracement at 1.3685.
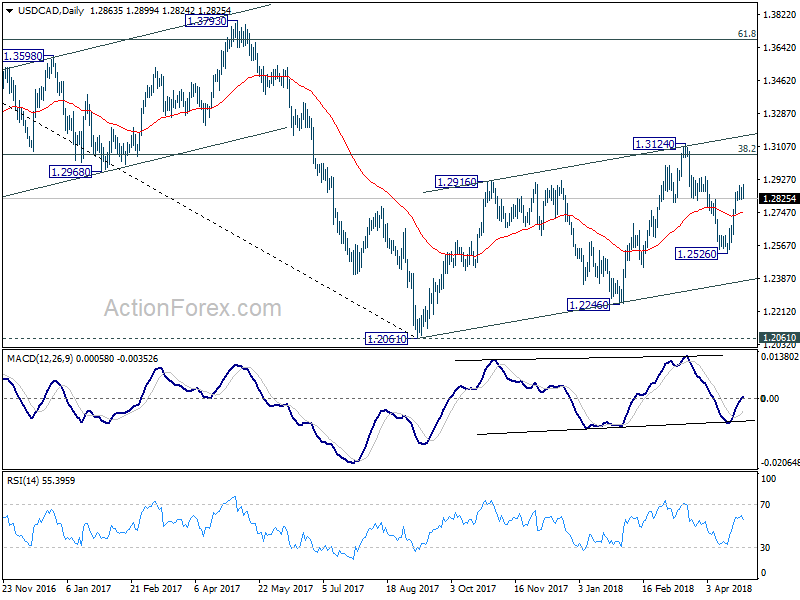
In the longer term picture, 50% retracement of 0.9406 (2011 low) to 1.4689 (2015 high) at 1.2048 remains a key support level to watch. As long as this level holds, we'll treat fall from 1.4689 as a correction and expect another rally through this level. However, sustained break of 1.2048 will turn favors to the case that rise from 0.9056 (2007 low) is a three wave corrective move that's completed at 1.4689. And retest of 0.9056/9406 support zone could be seen in medium to long term.
GBP/JPY Weekly Outlook
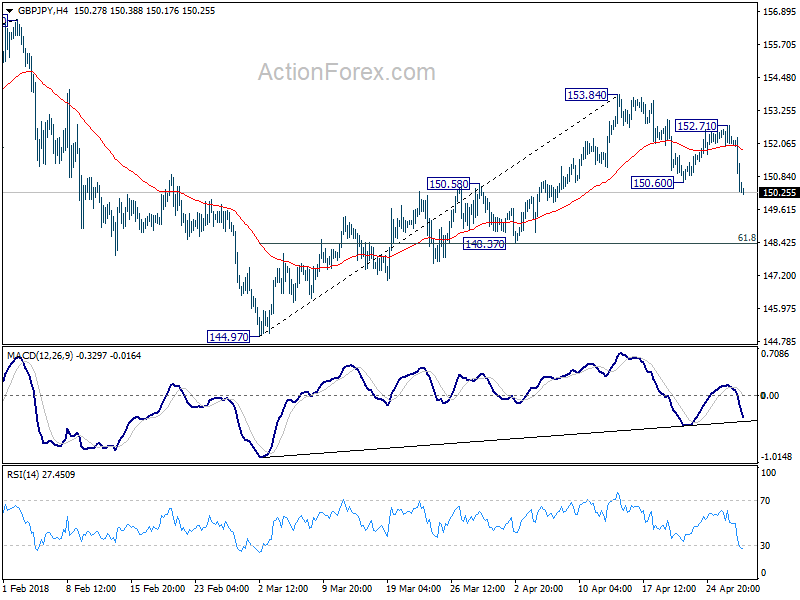
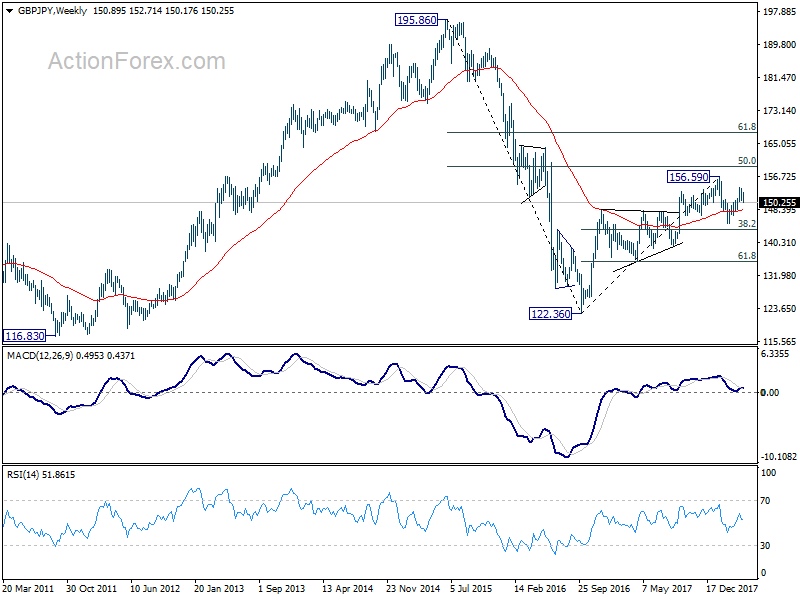
GBP/JPY's decline from 153.84 extended last week after recovering to 152.71. Initial bias remains on the downside this week for 148.37 support first. Decline from 153.84 is seen as the third leg of the corrective pattern from 156.59. Break of 148.37 will pave the way to 144.97 and below. On the upside, break of 152.71 resistance is needed to indicate completion of the decline. Otherwise, near term outlook will remain cautiously bearish in case of recovery.
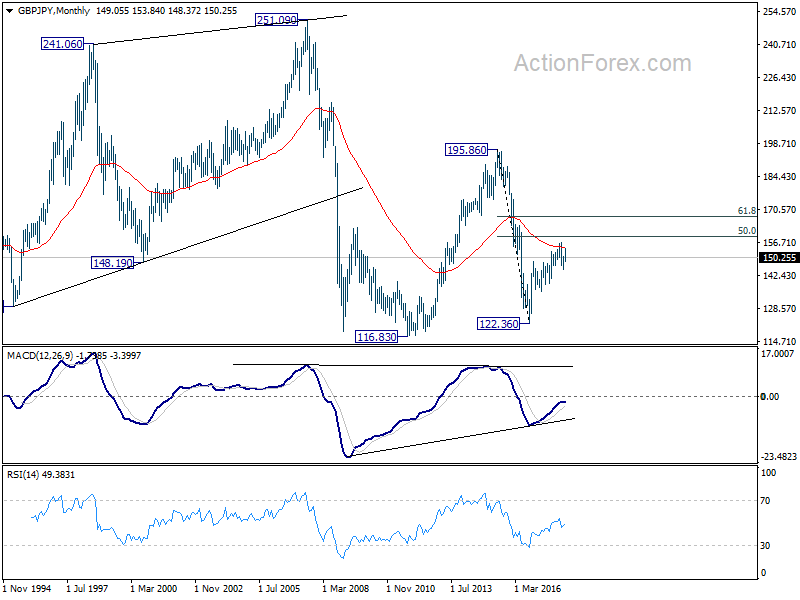
In the bigger picture, price actions from 156.59 are viewed as a corrective pattern. For now, we'd expect at least one more fall for 38.2% retracement of 122.36 to 156.59 at 143.51 before the consolidation completed. Though, firm break of 156.59 will resume whole up trend from 122.36 (2016 low) to 50% retracement of 195.86 (2015high) to 122.36 at 159.11 next.
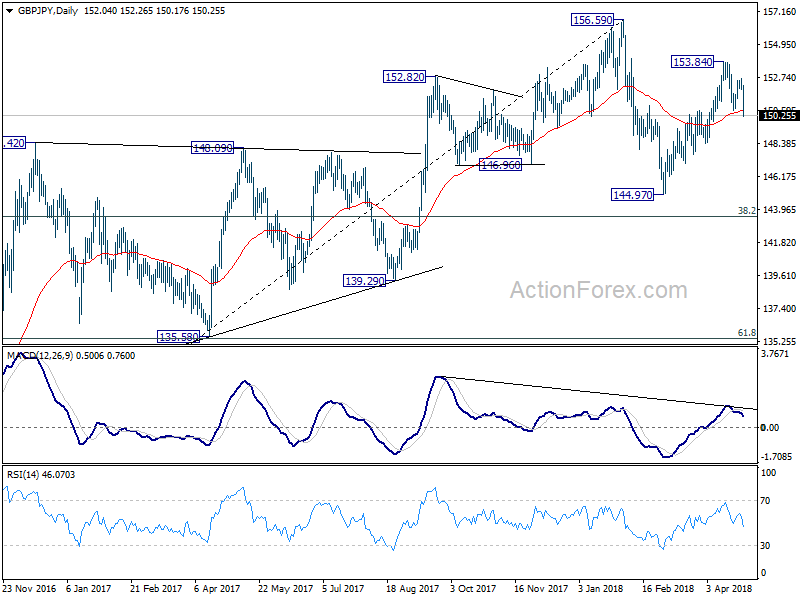
In the longer term picture, current development suggests that rise from 122.36 (2016 low) is not completed yet. Such rally could extend to 61.8% retracement of 195.86 (2015high) to 122.36 at 167.78 before completion. This will now be the preferred case as long as 139.29 support holds.
EUR/JPY Weekly Outlook
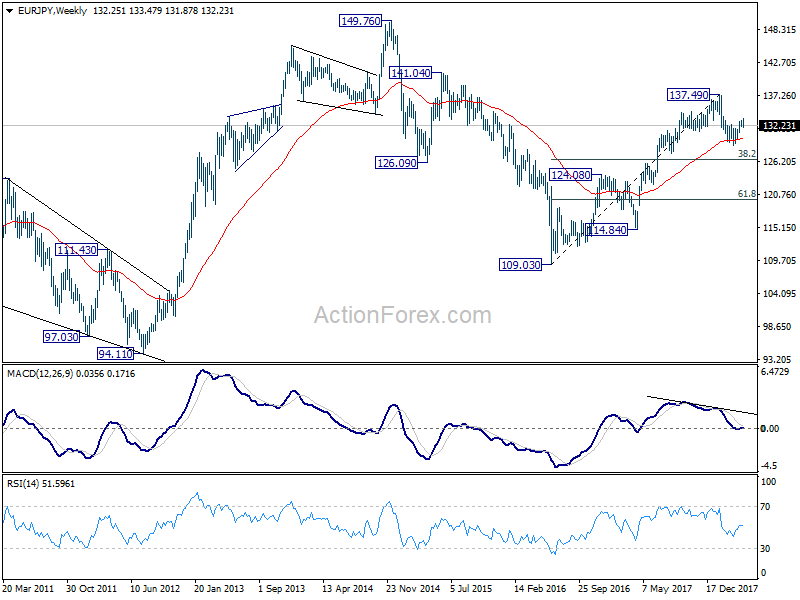
EUR/JPY's decline from 133.47 and break of 132.03 minor support last week suggests that corrective rebound from 128.94 has completed. Initial bias remains mildly on the downside this week for retesting 128.94 low. Break there will resume whole decline from 137.49. On the upside, above 133.47 will extend the rebound. But we expect strong resistance from 61.8% retracement of 137.49 to 128.94 at 134.22 to limit upside and bring near term reversal eventually.
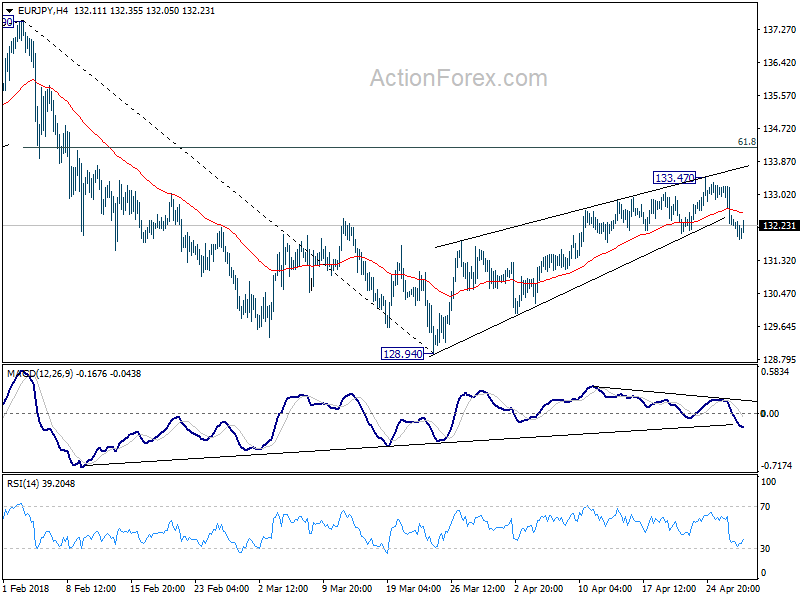
In the bigger picture, price action from 137.49 medium term top are developing into a corrective pattern. The first leg has completed at 128.94. The second leg might be finished at 133.47 or it might extend. But after all, we'd expect another decline through 128.94 to 38.2% retracement of 109.03 to 137.49 at 126.61 before completing the correction.
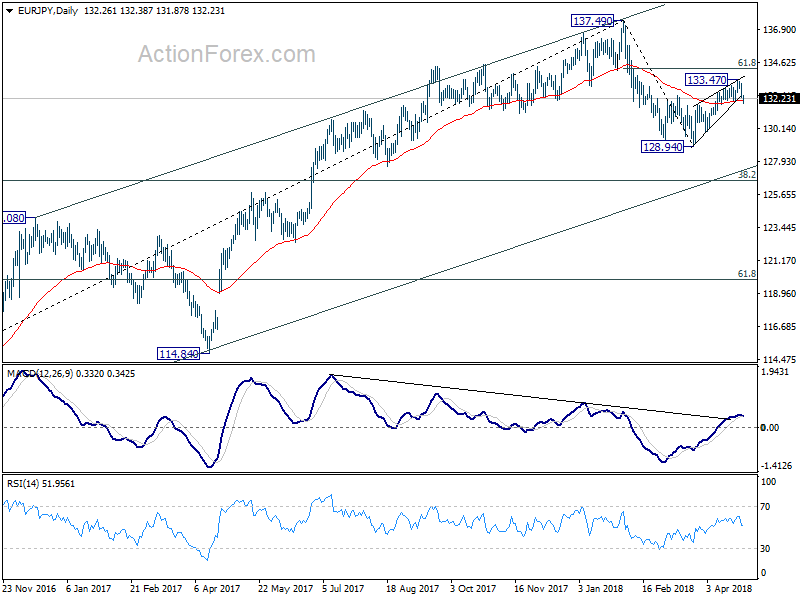
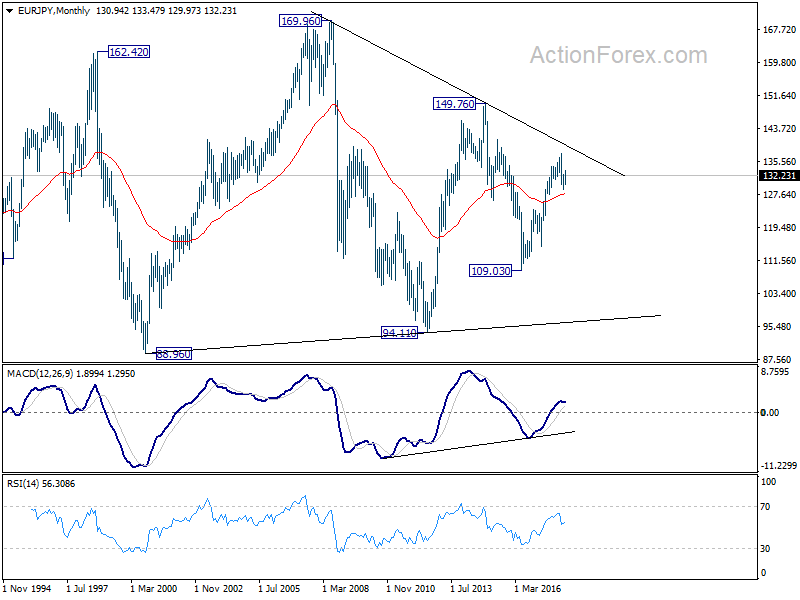
In the long term picture, at this point, EUR/JPY is staying in long term sideway pattern, established since 2000. Rise from 109.03 is seen as a leg inside the pattern. As long as 124.08 support holds, further rally is in favor in medium to long term through 149.76 high. However, break of 124.08 could extend the fall through 109.03 low instead.
EUR/GBP Weekly Outlook
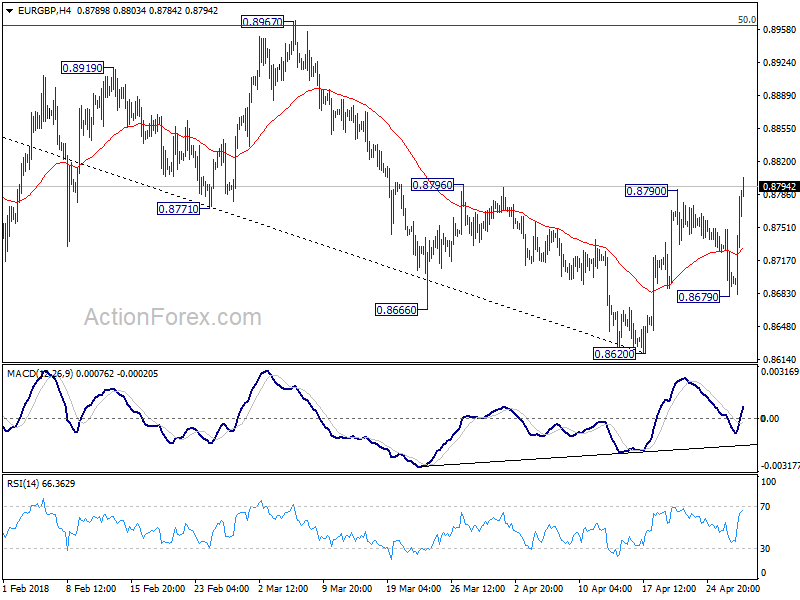
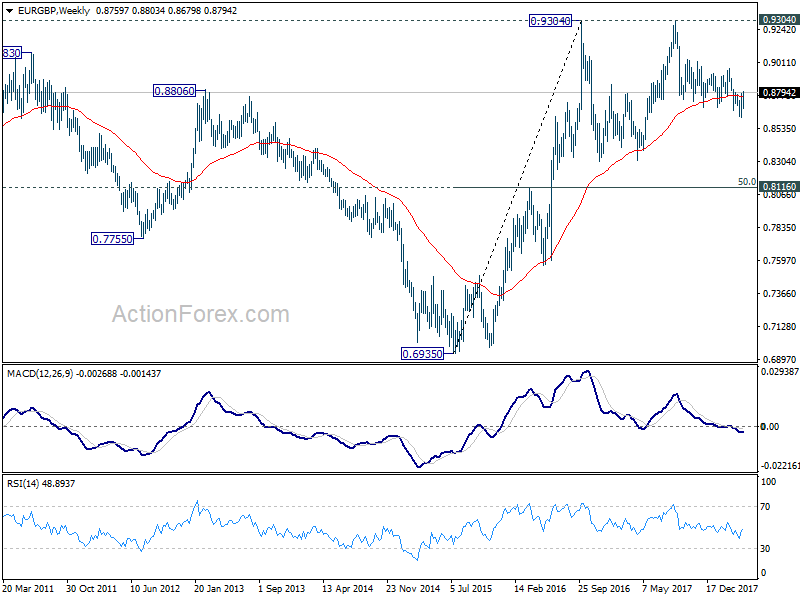
After deeper than expected pull back, EUR/GBP's rebound resumed by breaking 0.8790 last week. The development affirmed the case of near term reversal. That is, decline from 0.9305 has completed at 0.8620. Initial bias remains on the upside this week for 0.8967 cluster resistance next (50% retracement of 0.9305 to 0.8620 at 0.8963). Break will confirm this view and target retesting 0.9305. On the downside, below 0.8679 will turn bias to the downside for 0.8620 instead.
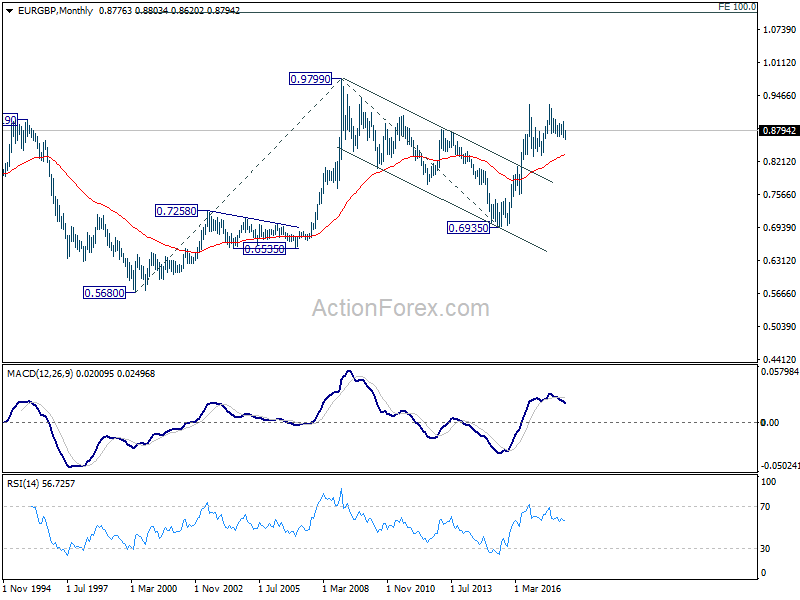
In the bigger picture, for now, the decline from 0.9305 is seen as a leg inside the long term consolidation pattern from 0.9304 (2016 high). Such consolidation pattern could extend further. Hence, in case of strong rally, we'd be cautious on strong resistance by 0.9304/5 to limit upside. Meanwhile, in another decline attempt, we'd expect strong support from 0.8116 cluster support (50% retracement of 0.6935 to 0.9304 at 0.8120) to contain downside.
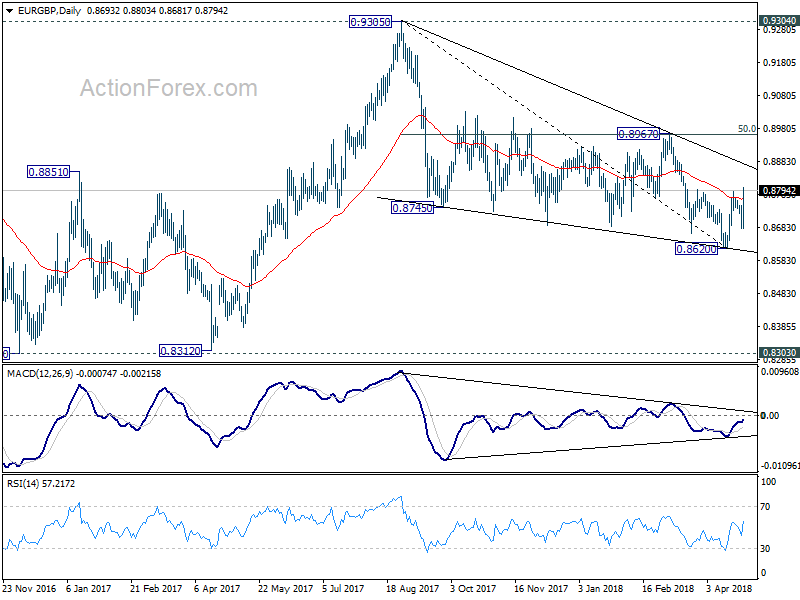
In the long term picture, we're holding on to the view that rise from 0.6935 (2015 low) is resuming the up trend from 0.5680 (2000 low). Hence, after the consolidation from 0.9304 completes, we'd expect another medium term up trend through 0.9799 to 100% projection of 0.5680 to 0.9799 from 0.6935 at 1.1054.
EUR/AUD Weekly Outlook
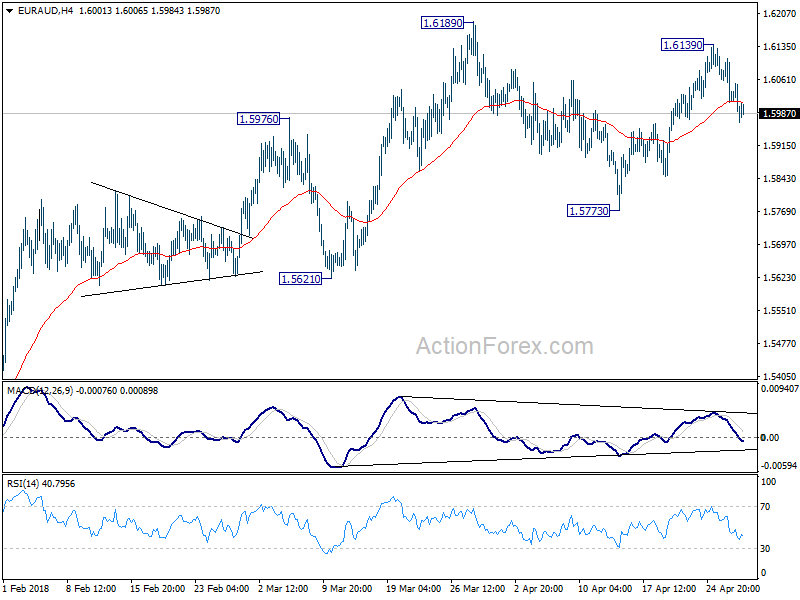
EUR/AUD rebounded to 1.6139 last week but failed to break through 1.6189 resistance and reversed. Initial bias remains mildly on the downside this week for 1.5773 support, and possibly below. But for the moment, we're viewing price actions from 1.6189 as developing into a consolidation pattern. Hence, downside should be contained above 1.5621 support to bring another rally. On the upside, above 1.6139 will target 1.6189 high again.
In the bigger picture, while there is bearish divergence condition in daily MACD, there is no clear sign of reversal yet. EUR/AUD also drew strong support from 55 day EMA and rebounded. Current rally from 1.3624 could still extend to 1.6587 key resistance (2015 high). Nonetheless, we'd expect further loss of upside momentum, and strong resistance from 1.6587 to limit upside and bring reversal. On the downside, sustained break of 1.5621 support should confirm reversal and turn outlook bearish for 1.5153 support and below.
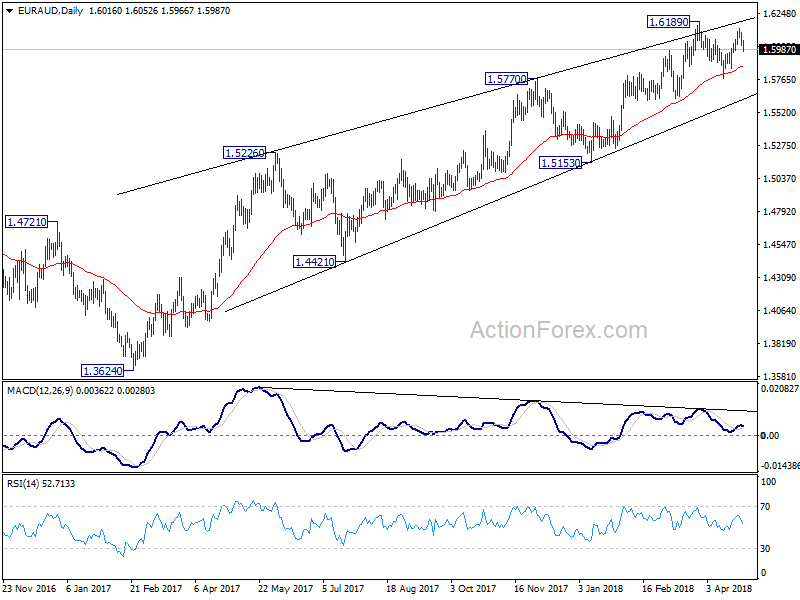
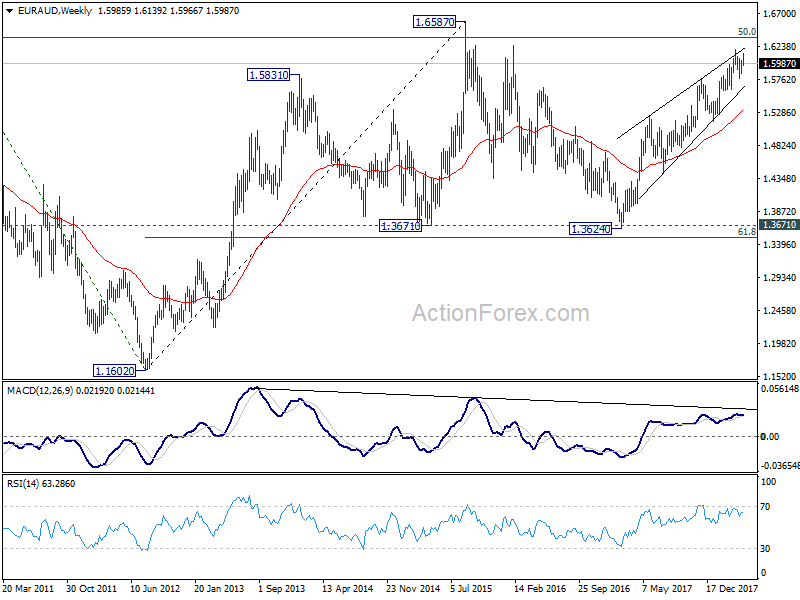
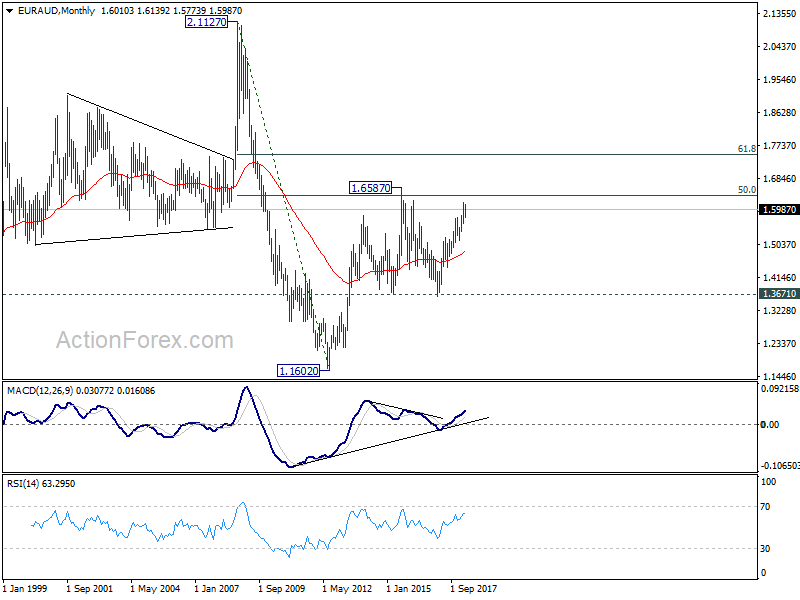
In the longer term picture, the rise from 1.1602 long term bottom (2012 low) isn't over yet. We'll keep monitoring the development but there is prospect of extending the rise to 61.8% retracement of 2.1127 to 1.1602 at 1.7488 and above. However, sustained trading below 1.3671 should indicate long term reversal and target 1.1602 long term bottom again.