Sample Category Title
EUR/CHF Weekly Outlook
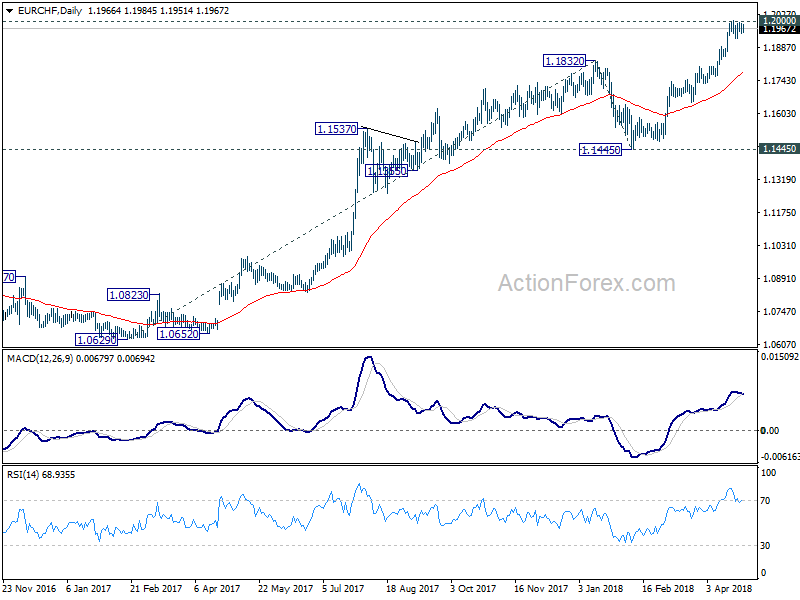
EUR/CHF stayed in consolidation below 1.2004 temporary top last week and outlook is unchanged. Initial bias remains neutral first week first. Further rally is expected as long as 1.1888 minor support holds. Decisive break of break of 1.2 will pave the way to 61.8% projection of 1.0629 to 1.1832 from 1.1445 at 1.2188. However, consider bearish divergence condition in 4 hour MACD, break of 1.1888 will indicate short term topping. In that case, deeper pull back would be seen back to 1.1445/1832 support zone.
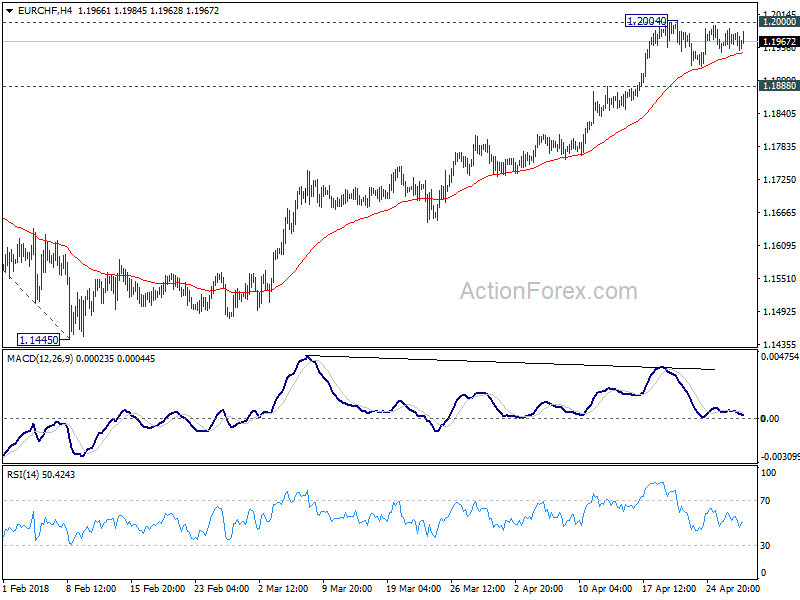
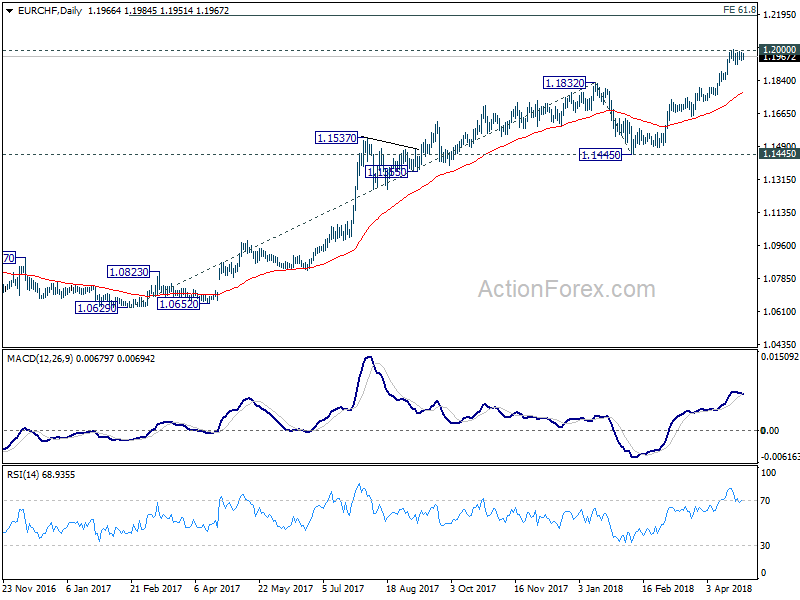
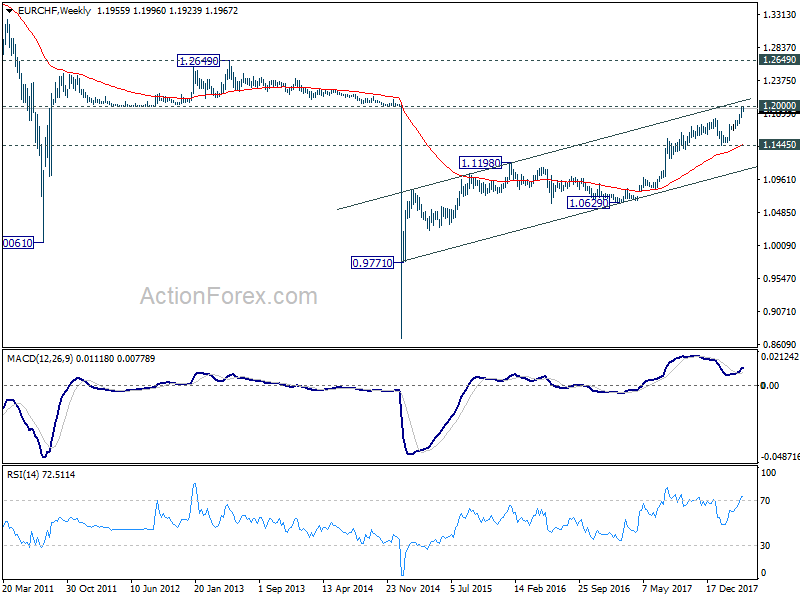
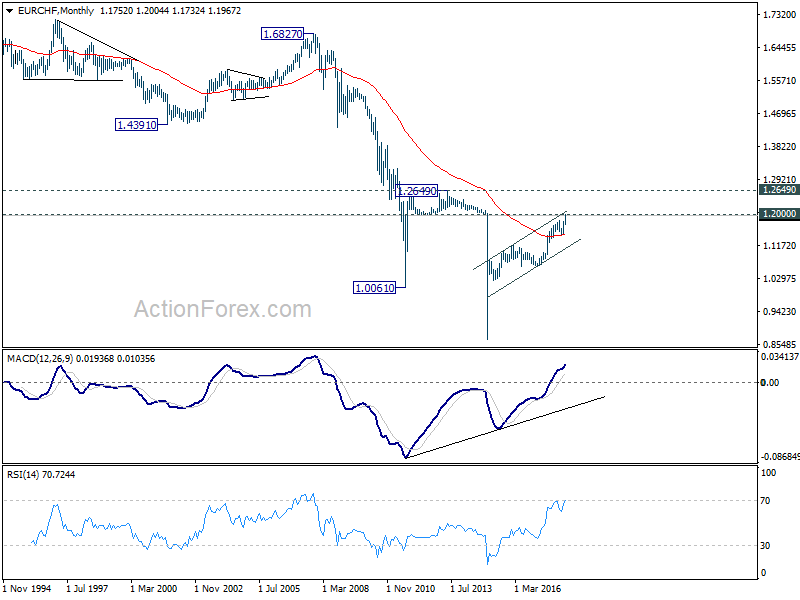
In the bigger picture, long term up trend in EUR/CHF is still in progress. Prior SNB imposed floor at 1.2003 was already met but there is no sign of reversal yet. As long as 1.1445 support holds, we'd expect the up trend to extend to 2013 high at 1.2649 next.
Dollar and Yield Reached Critical Junctures after Strong Rally, Determining Events ahead
Dollar was given a powerful boost last week on a couple of factors. Firstly, 10 year yield extended recent bull run and hit 3% level for the first time since 2014. Secondly, Euro was sold off steeply after the confusing messages from ECB President Mario Draghi during the post meeting press conference. The common currency was then pressured further after French GDP miss. Thirdly, Sterling joined the selloff after poor Q1 GDP result that almost killed off the chance of a May BoE rate hike. Fourthly, Dollar managed to secure most of the weekly gains after better than expected Q1 GDP result from the US.
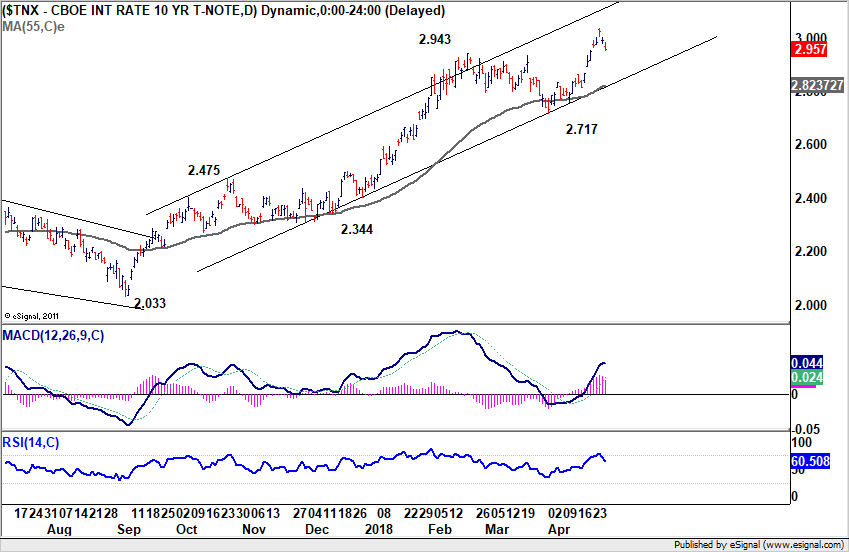
However, it should be noted that there was notable retreat in 10 year yield (TNX) on Thursday and Friday, it closed the week at 2.957, just above prior week's close at 2.951, and even below the weekly open at 2.975. Dollar index also reversed the daily gains on Friday after better than expected GDP report. We'd view TNX and DXY in critical juncture where more is needed to prove their underlying power.
The coming week will feature many heavy weight events that would finally confirm the main trend in the markets. US events include FOMC rate decision, PCE inflation, ISM indices and non-farm payrolls. Eurozone data include Q1 GDP, April CPI flash and European Commission economic forecasts. UK data include manufacturing, services and construction PMIs.
Euro tumbled on ECB outlook, but CAC cheered French data miss
Let's have a quick recap on Euro first. ECB left monetary policy unchanged last week as widely expected. President Mario Draghi's post meeting introduction statement noted there was "solid and broad-based expansion" in the Eurozone despite weaker than expected data. However, in the Q&A, Draghi said that Governing Council didn't even discuss monetary policy "per se" during the meeting. And that's because more time was needed to assess whether the slowdown in Q1 was "temporary or permanent". And Draghi also cautioned that understanding the factors behind the moderation in growth is "essential for informing our next decisions."
The clearly showed ECB policy makers were wondering what recent weak batch of data actually meant in terms of economic outlook. French GDP released on Friday showed only 0.3% qoq growth, down from prior quarter's 0.7% qoq and missed expectation of 0.4% yoy. The data could prompt some worry among policy makers that Q1's slowdown was deeper than they originally thought. For now, it is still early to tell if ECB would stop the asset purchase program after September. But it's getting less likely that ECB will have a decision on it by June meeting.
The upcoming Eurozone GDP on May 2 will provide further evidence on how deep the slowdown was back in Q1. And CPI flash on May 3 will tell us how, or whether, inflation was starting to pick up again at the start of Q2. European Commission forecasts will also tell us how economists there view the outlook.
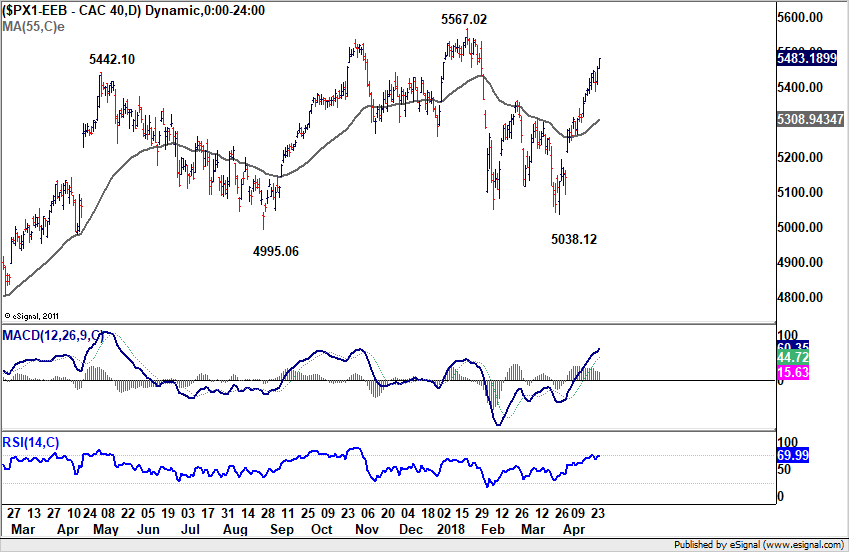
The solid rally in CAC last week showed that investors were not bothered with the French GDP miss. Instead, they cheered as that could keep ECB's stimulus longer. CAC closed the week strongly at 5483.19 and is on course to retest 5667.02 high.
Meanwhile, it should be noted that Euro's performance was not too bad as it closed the week up against Yen, Swiss Franc, Sterling and Kiwi. Clearly, Yen was troubled by surging US yield. Sterling was troubled by receding BoE rate expectation. Kiwi was troubled but its own sluggish inflation and dovish RBNZ. And finally, solid risk appetite in major European markets, like CAC, kept Franc pressured. Despite failing to sustain above 1.2 historical level, EUR/CHF stayed firm in tight range, close to that level.
Poor UK GDP killed May hike chance, FTSE jumped
Sterling's selloff started the prior week after triple data misses, wage growth, CPI and retail sales. And, BoE Governor Mark Carney hinted that May rate hike was far from being certain. The Pound looked resilient for most part of last week as traders looked forward to GDP data for rescue. However, that was a big disappointment as the UK economy merely grew 0.1% qoq, much worse than expectation of 0.3% qoq and prior quarter's 0.4% qoq. Also, that's the weakest quarterly growth figure in five years.
Q1 GDP data was like the final straw that closed the case for a May hike. According to a Bloomberg survey, investors are now seeing only 20% chance of a May hike, comparing to around 90% earlier in April. But of course, that won't be the end of the story. As Carney said before, the policy makers are "conscious that there are other meetings" that they could act this year. And the Q1 slowdown could be a result of bad weather only, like Chancellor of the Exchequer Philip Hammond blamed. The upcoming data including PMIs this will show how well the economy rebounds in Q2.
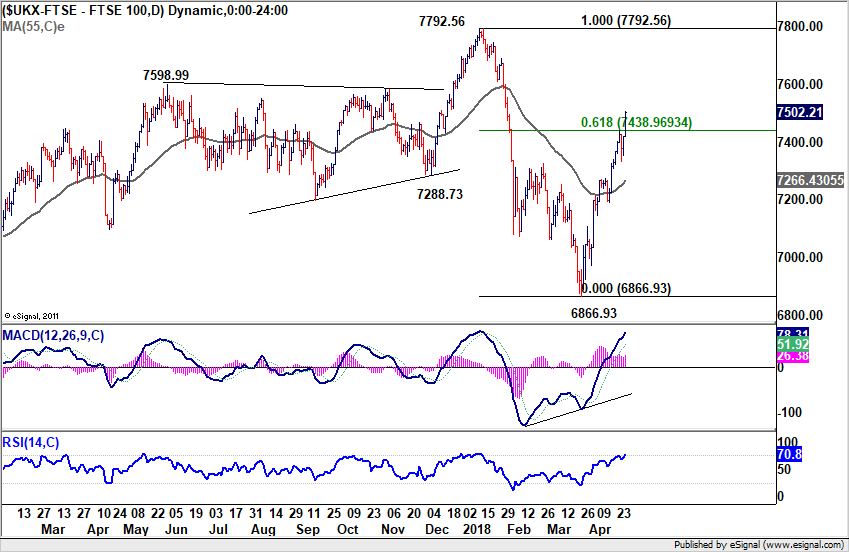
Just like CAC, FTSE surged strongly last week, in particular on Friday on relieve that BoE won't be ready to hike soon. And depreciation of the Pound also helped. Now with 61.8% retracement of 7792.56 to 6866.93 at 7438.96 firmly taken out, further rise should be seen to historical high at 7792.56.
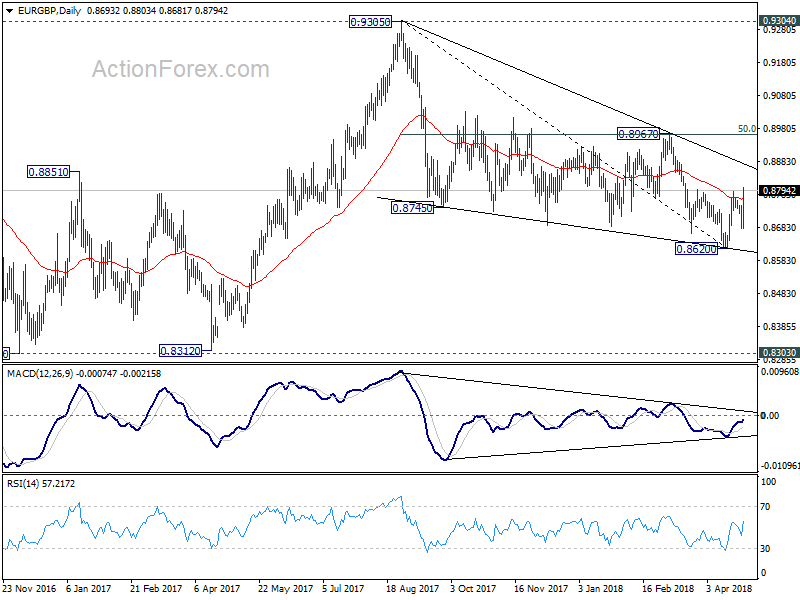
One more point to note is that EUR/GBP's case of bullish reversal was saved by poor UK GDP. And the rebound from 0.8620 is still on course to 0.8967 resistance in near term. Given the interactive nature of the currency markets, performance of EUR/GBP would have an impact on Euro elsewhere.
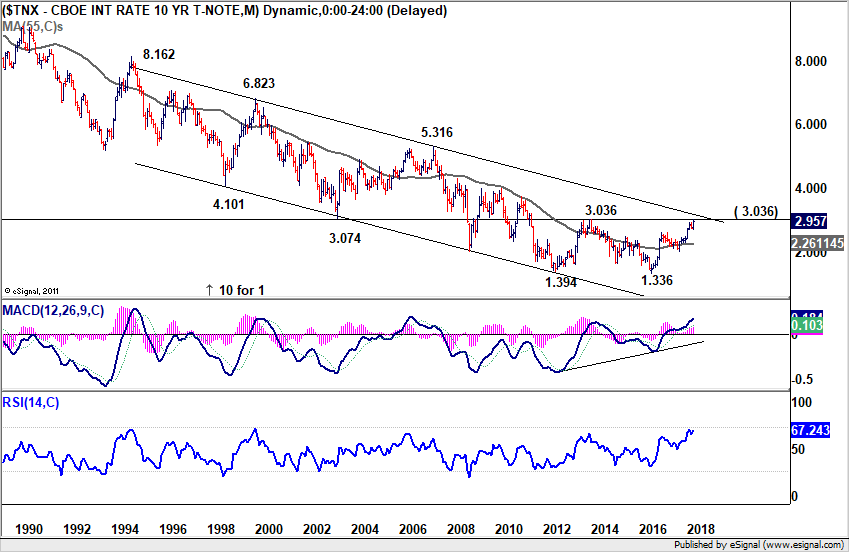
TNX hesitated ahead of key long term resistance at 3.036
Now, back to the US... TNX reached as high as 3.035 last week but closed at 2.957 only. We'd like to repeat that 2013 high at 3.036 represents the start of the most important resistance zone. It's also close to multi-decade channel resistance. Decisive break of which will complete a long term double bottom 1.394 (2012), 1.336 (2016), on bullish convergence condition in monthly MACD. That would also mark the end of the era of persistently falling US benchmark yield. So, given the importance of the level, it's natural for TNX to have some hesitation.
From near term point of view, 3.035 now looks like a short term top after the exhausting gap up on Wednesday and the gap down on Thursday. And if that's the case, then rise 2.033 could have completed a five wave impulsive sequence with rise from 2.717 as the fifth. That is, we could seen some consolidation with TNX gyrating down to 2.7/8 zone before having another attempt on the key 3.036 resistance. We'll have to see how it plays out this week given the heavy weight events from the US. Though, we're not anticipating that yield would drag down the Dollar. But consolidation in TNX means it won't give Dollar much boost until the consolidation finishes.
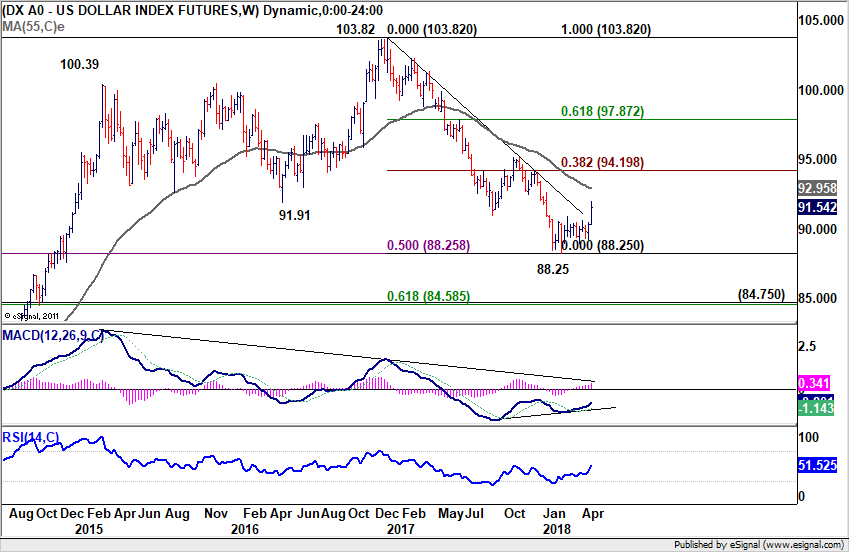
Dollar index's rise from 88.25 yet to prove it's impulsive
Last week's sharp rally in Dollar index built up the case of medium term reversal. Medium term trend line resistance was firmly taken out, so was 91.01 support turned resistance. There is bullish convergence condition in weekly MACD. And Dollar index was supported by 50% retracement of 72.69 to 103.82 at 88.25. The ingredients are in place.
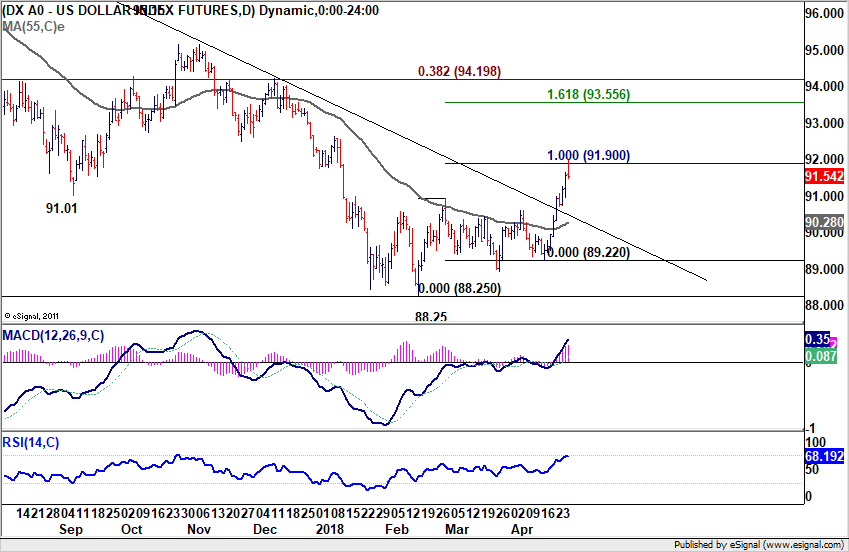
However, there is one more thing needed. Rise from 88.25 has to show that it's impulsive in nature. For now, it's not proven yet, maybe because of timing. DXY reached as high as 91.98, hitting 100% projection of 88.25 to 90.29 from 89.22 at 91.90. But it failed to stay above this level and closed down at 91.54. Sustained break of 91.90, and better, hitting 61.8% projection at 93.55 will give us much more confidence that it's a medium term bullish reversal. However, rejection from 91.90 will make the rebound from 88.25 corrective, and thus dampen the bullish case. The coming week, with heavy weight US events, and interaction with Euro, will hold the key.
EUR/USD Weekly Outlook
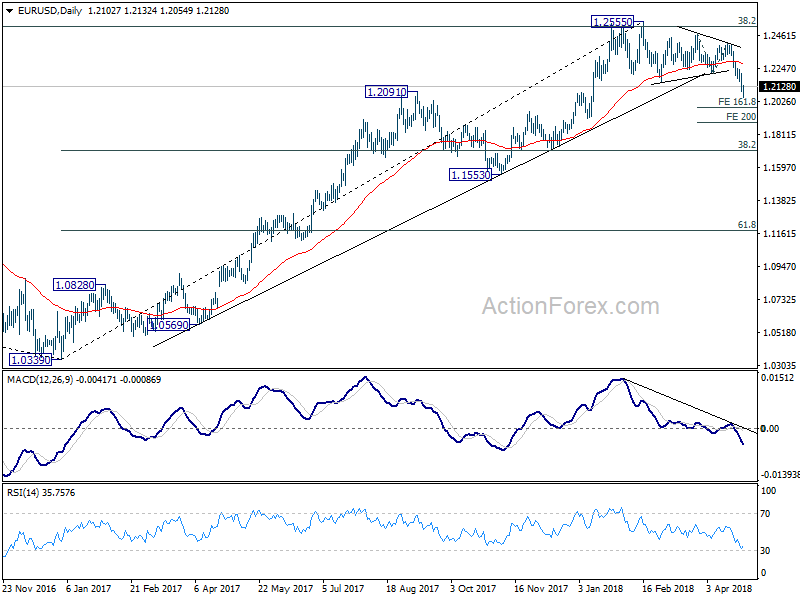
EUR/USD's dropped sharply to 1.2054 last week. The strong break of 1.2154 key support confirmed medium term topping at 1.2555. But as a temporary low as formed at 1.2054, initial bias is neutral this week for some consolidations first. Upside of recovery should be limited by 1.2214 support turned resistance to bring another decline. Below 1.2054 will target 161.8% projection of 1.2475 to 1.2214 from 1.2413 at 1.1991 first. Break will target 200% projection at 1.1891.
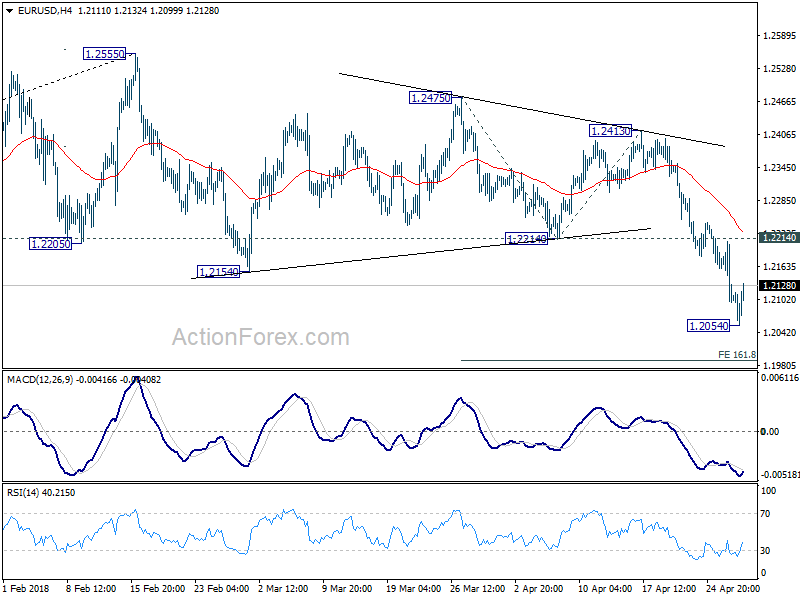
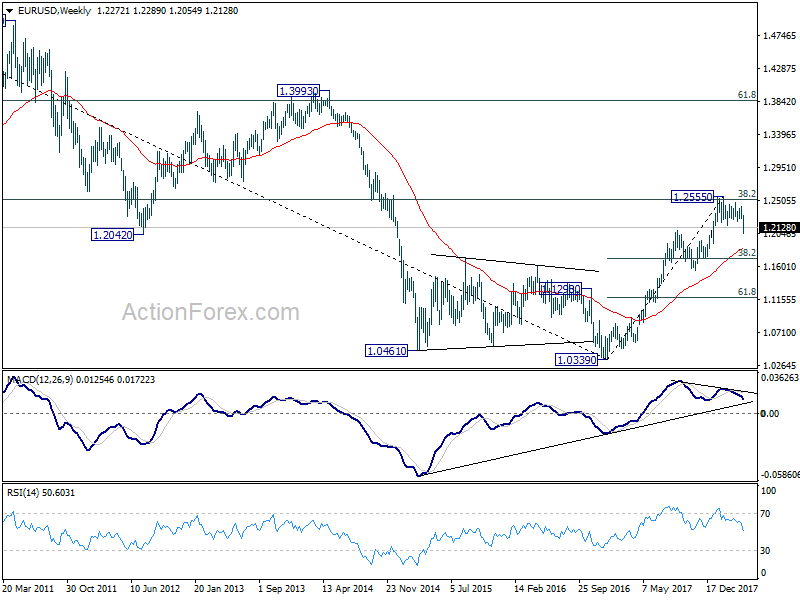
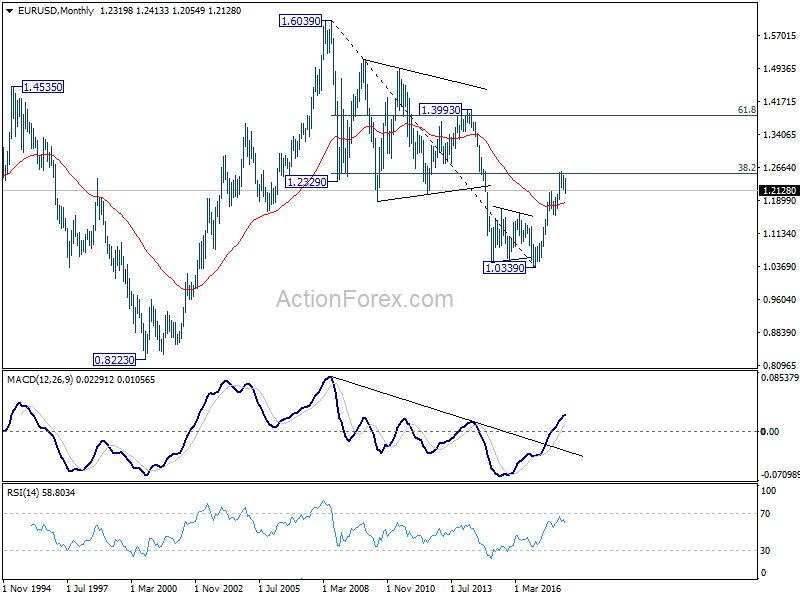
In the bigger picture, current decline and firm break of 1.2154 support confirms rejection by 38.2% retracement of 1.6039 (2008 high) to 1.0339 (2017 low) at 1.2516. A medium term top should be in place at 1.2555 and deeper decline would be seen back to 38.2% retracement of 1.0339 to 1.2555 at 1.1708 first. We'll look at the structure and momentum of such decline before decision if it's an impulsive or corrective move.
In the long term picture, 1.0339 is seen as an important bottom as the down trend from 1.6039 (2008 high) could have completed. It's still early to decide whether price action from 1.0339 is developing into a corrective or impulsive pattern. Reaction to 38.2% retracement of 1.6039 to 1.0339 at 1.2516 will give important clue to the underlying momentum.
Summary 4/30 – 5/4
Monday, Apr 30, 2018
[php_everywhere instance="1"]
Tuesday, May 1, 2018
[php_everywhere instance="2"]
Wednesday, May 2, 2018
[php_everywhere instance="3"]
Thursday, May 3, 2018
[php_everywhere instance="4"]
Friday, May 4, 2018
[php_everywhere instance="5"]
BoJ: Deadline is the Best Motivator, Its Absence is Good Cover
The Bank of Japan (BoJ) held interest rates steady and kept its comprehensive stimulus program intact, but it also dropped the deadline for achieving its 2.0 percent target making it easier to wait for the medicine to take.
The Deadline is the Ultimate Motivator, Its Absence is Good Cover
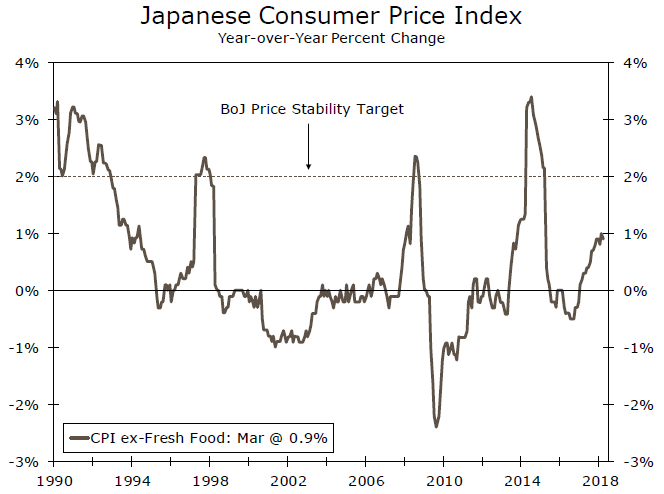
At its scheduled meeting this week, the Bank of Japan (BoJ) held interest rates steady and maintained its comprehensive program of monetary policy support, but it dropped any reference to a timeline for achieving its 2.0 percent inflation target. Previously it had been targeting the end of fiscal year 2019 (March 2020). CPI inflation in Japan has rarely been in range of the 2.0 percent stability target over the past 20 years.
Financial markets seized upon the dropping of any date reference hitting the inflation target, but at the press conference that followed, BoJ Governor Kuroda affirmed multiple times that the removal of the date was not in any way an indication of monetary policy bias.
The BoJ decision was decided in an 8-1 majority vote, with the lone dissenter (Mr. Kataoka), again preferring additional easing measures. Notably, this was the first meeting that included recently appointed Deputy Governor Wakatabe who is generally viewed as a dovish policymaker.
The fact that Mr. Wakatabe did not join Mr. Kataoka in calling for additional easing measures may explain why the target date for achieving 2.0 percent inflation was removed.
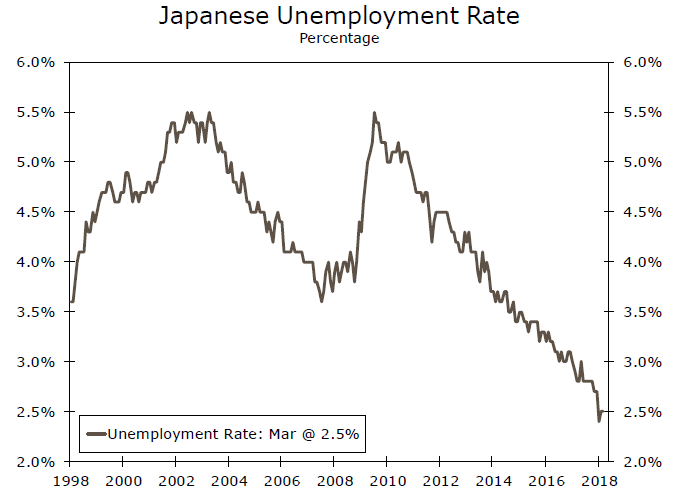
Without the clock ticking and a specific deadline approaching, there is less urgency in the administration of monetary policy. In that regard, the removal of the deadline offered the newly minted Deputy Governor the opportunity to go along with the majority in good conscience that doing so would not betray his dovish tendencies. That does not preclude Mr. Wakatabe from eventually calling for additional measures, but for now at least, it provides time for the monetary policy medicine to take without the need for an immediate additional dose. The historically low unemployment rate may eventually result in wage-push inflation, but we are skeptical given the absence of any serious indication of employers raising wages.
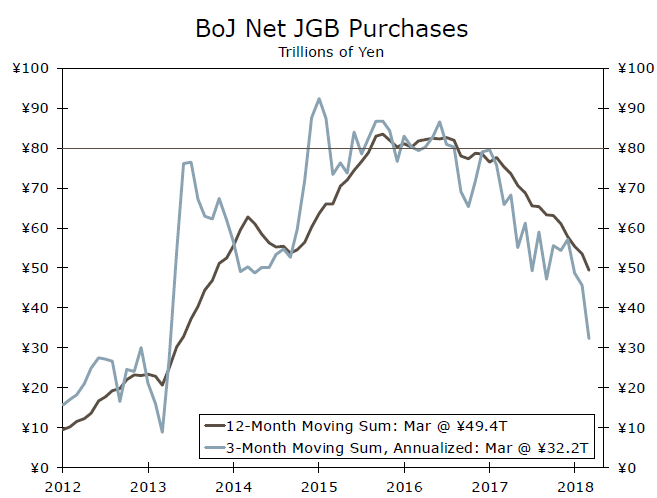
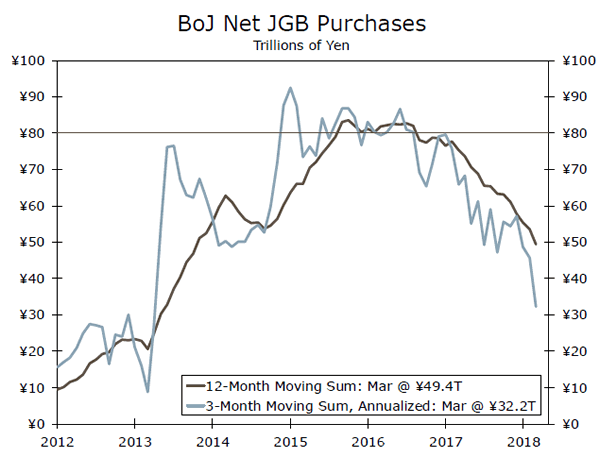
The BoJ said it would continue to purchase 10-year Japanese government bonds (JGBs) such that yield will remain at "around zero percent" and that it would maintain its bond purchases at more or less the current pace of ¥80 trillion annually.
As we have observed previously, however, there is a practical limit to how much JGBs the BoJ can purchase. Over the past 12 months for example, the BoJ has only purchased about ¥50 trillion. Still, with 10-year JGBs yielding less than 0.06 percent as of this writing, the BoJ's pace of purchases is sufficient to keep the yield close to zero as it said it would.
In summary, we see the dropping of the target date for hitting the inflation target as further affirmation that any tightening remains a long way off. Between now and the end of next year, the fastest pace of year-over-year CPI inflation we have in our forecast is just 1.5 percent.
Weekly Economic and Financial Commentary: Better Off the Blocks in 2018
U.S. Review
Better Off the Blocks in 2018
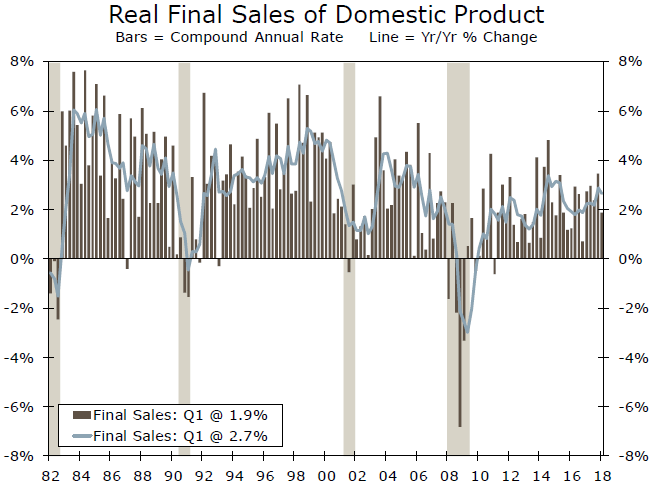
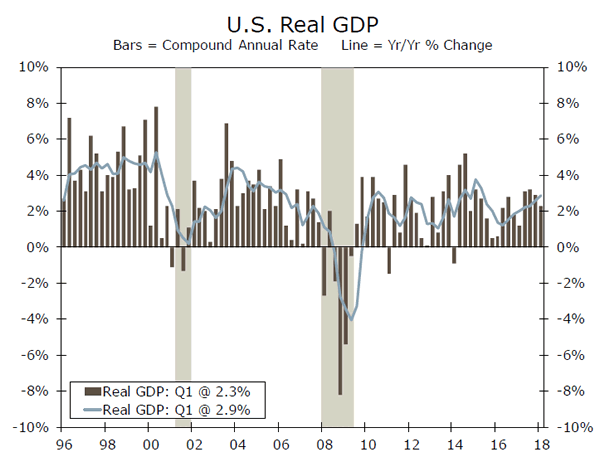
- First quarter GDP growth came in at an annualized rate of 2.3 percent. While that represents a slowing from the roughly 3 percent pace in the prior three quarters, the outturn was better than the 2.0 percent growth that had been expected.
- Low expectations for Q1 GDP may have to do with data quirks, which have been blamed for crummy first quarter growth in three out of the past four years.
- Elsewhere this week, the latest readings for new home sales and consumer confidence both came in better than expected.
Motor Vehicles Get Pulled Over
Real GDP growth slowed in the first quarter to an annualized pace of 2.3 percent. One key reason for the slower growth rate was that consumer spending grew at just a 1.1 percent annualized clip. That is the slowest pace in more than four and a half years. What happened to surging consumer confidence and tax cuts?
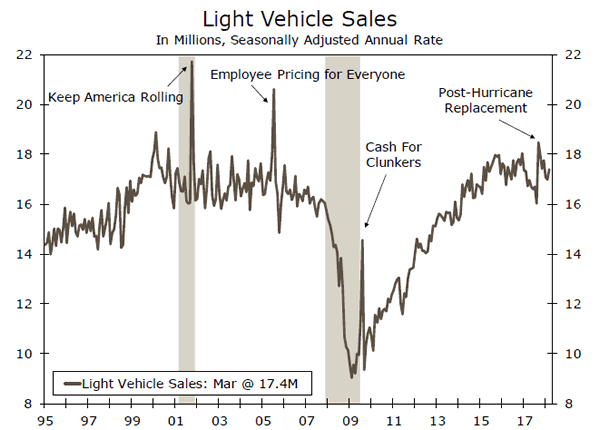
Admittedly, the 4.0 percent growth rate in the final quarter of 2017 was a tough act to follow. Some of the Q4 strength in consumer spending had to do with revved-up auto sales after hurricanerelated flooding resulted in replacement spending at the time. Outlays for motor vehicles added 0.45 percentage points to Q4 growth and subtracted 0.42 percentage points from Q1.
We are not worried about the consumer. We learned this week that consumer confidence rose to 128.7—the second-highest level reached for this bellwether since 2000. Similarly, the unemployment rate, which presently is 4.1 percent, has not been so low since 2000. In fact, we are just a few ticks away from 3.8 percent, the cycle low in 2000. To find a lower unemployment rate, you need to go back to the 1960s. While participation is not what it used to be, it stands to reason that the job market is presently in good enough shape to sustain further growth in consumer spending.
Durables Report Offered Last-Minute Preview for GDP
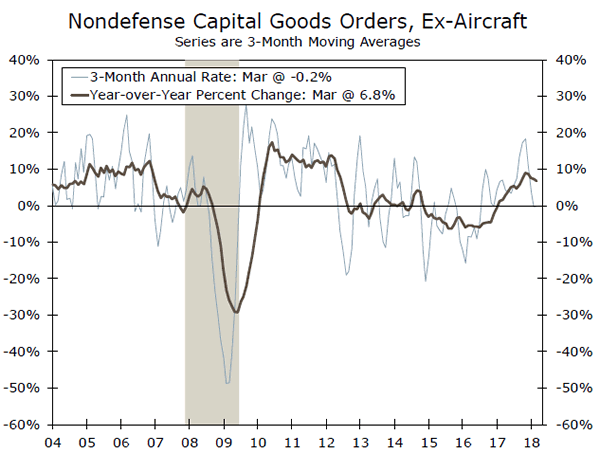
Double-digit percentage gains in orders for both civilian and defense aircraft lifted overall durable goods orders to a betterthan- expected monthly increase of 2.6 percent. But elsewhere, orders were flat in March when you exclude the volatile transportation sector. Despite sustained high levels for ISM new orders, actual orders remain inconsistent.
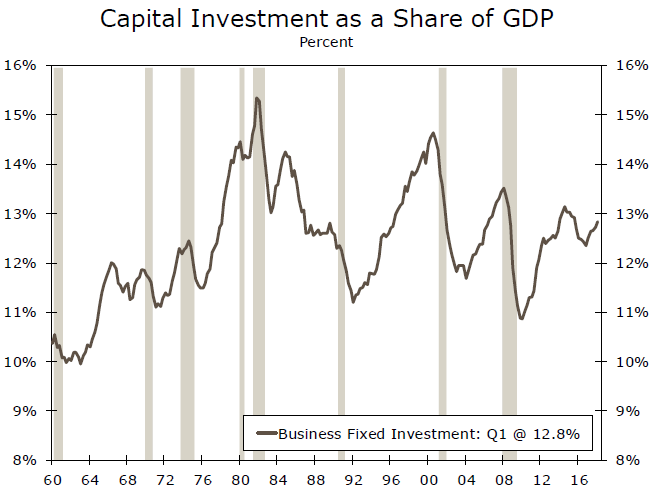
Core capital goods shipments tend to be a good indicator for equipment spending, and that offered a last minute preview for the equipment line in Friday's GDP report, as this series posted a three-month annualized growth rate of just 4.1 percent. The equipment spending line in the GDP report was 4.7 percent.
The notion that the soft patch in capital spending might only be delayed is sullied by the fact that core capital goods orders fell in March, and the three-month annualized rate is in negative territory. We have been forecasting a moderation in the pace of capital spending despite the tax cuts, and that forecast (regrettably) remains intact.
Although business spending on equipment slowed, spending on structures picked up. Nonresidential fixed investment spending grew at a 12.3 percent clip in Q1.
New Home Sales Picked up in March
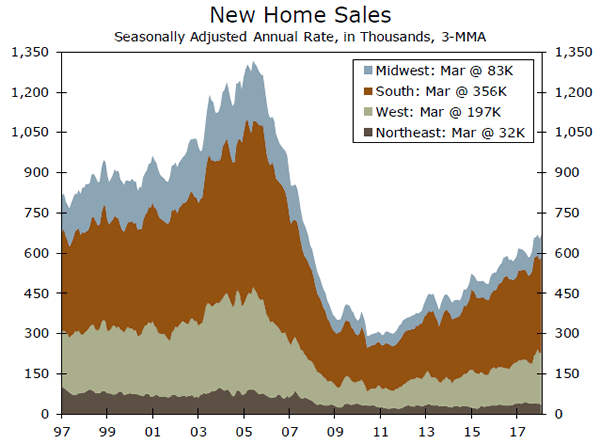
March new home sales jumped 4.0 percent, which exceeded the 1.9 percent gain that had been expected. Not only that, the data for the prior month (February) were revised higher as well. The annualized pace of new home sales, now at 694K, represents the fastest pace of the current expansion. Weather still appears to be playing a factor. New home sales were down in the Northeast as realtors perhaps found it difficult to get potential buyers to look at listings in a month in which four nor'easters pummeled the region.
U.S. Outlook
Personal Spending • Monday
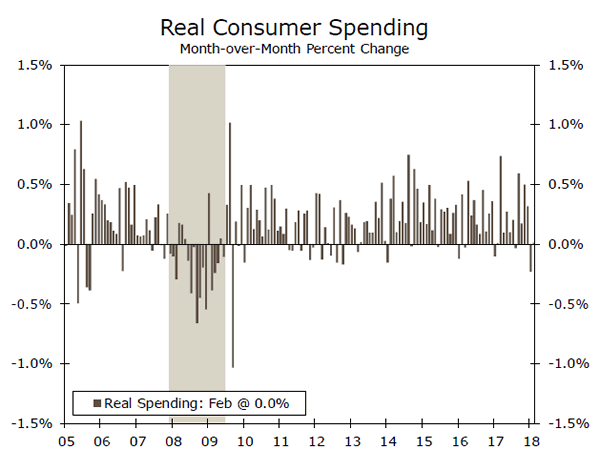
Personal spending grew only 0.2 percent in February. This matched January's pace, but marked a significant downshift from breakneck growth rates registered in late 2017. Adjusting for inflation, expenditures were flat on the month. The consumer had been providing strong support to GDP growth, adding 2.75 percentage points to the headline in Q4-2017. However, the initial GDP estimate shows this contribution falling to 0.73 points in Q1. This suggests that March spending continued to be weak.
While spending has slowed, disposable income rose a strong 0.4 percent in February, boosted by tax cuts and rising wages. This helped push the saving rate up to 3.4 percent in February, after falling to a 12-year low of 2.4 percent in December. We expect another month of strong income growth for March. Given rising incomes and continued high levels of consumer confidence, we expect spending to pick back up as 2018 progresses.
Previous: 0.2% Wells Fargo: 0.3% Consensus: 0.4% (Month-over-Month)
ISM Manufacturing • Tuesday
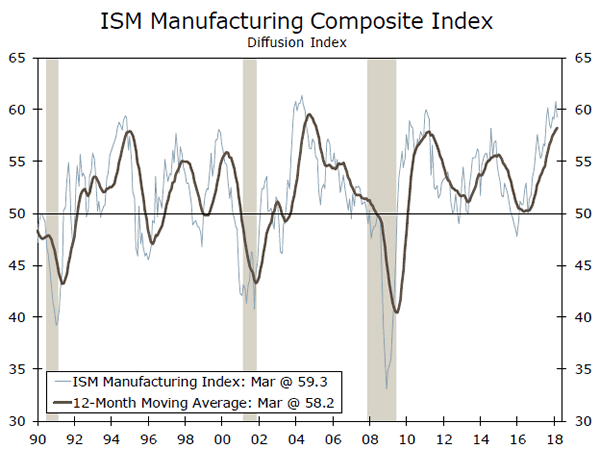
The ISM manufacturing index came in at 59.3 in March, moderating from 60.8 in February. The decline was broad-based, with the indices for production, new orders and employment all falling. However, the ISM index remains strong, in-line with levels at the end of 2017 and consistent with an expanding manufacturing sector. Seventeen of 18 industries reported growth in March, led by fabricated metals, plastics and computer & electronic products.
The biggest concern for manufacturers from the March report was a jump in the prices paid index, to 78.1 from 74.2 in February. Fifty-seven percent of respondents reported paying higher prices. We will be watching the April report for signs that price pressures are continuing to build. Higher input costs have been helping to lift inflation, and we expect this trend to continue as resource constraints push prices up further.
Previous: 59.3 Wells Fargo: 58.5 Consensus: 58.5
Employment • Friday
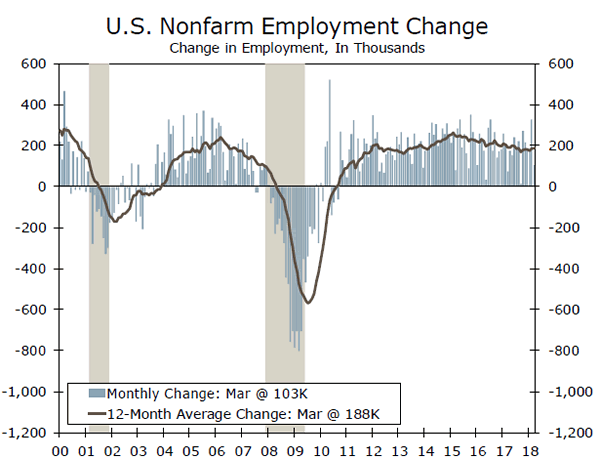
Nonfarm payrolls rose 103,000 in March, below expectations. The three-month average gain remains at a solid 202,000 jobs, suggesting strong underlying momentum. Weather played a role in the lower March job gain; construction jobs–which are particularly sensitive to weather, like the storms in the Northeast–were down 15,000. A standout on the positive side was the manufacturing sector, where the three-month average job gain rose to 25,000. As the labor market continues to tighten, and the pool of workers on the sidelines shrinks, monthly job gains are likely to slow somewhat. We expect payrolls to have increased 195,000 in April.
Average hourly earnings grew 0.3 percent in March and are up 2.7 percent on the year. The gradual rise in earnings over the past six months has been helping to support income growth and inflation, but is also increasing pressure on profit margins. We expect another strong month for average hourly earnings in April.
Previous: 103,000 Wells Fargo: 195,000 Consensus: 185,000
Global Review
Developed Countries' Central Banks: Staying the Course
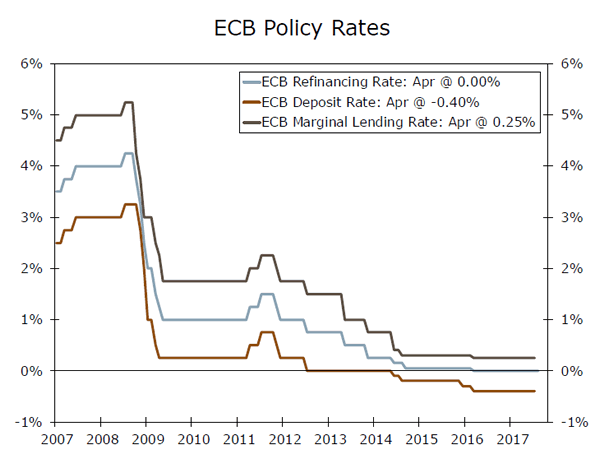
- The European Central Bank (ECB) decided to leave interest rates unchanged while it kept its purchase of assets at €30 billion per month until at least September.
- The Bank of Japan (BoJ) kept its own monetary policy measures basically unchanged and is even further away than the ECB from any move to start unwinding its expansionary monetary policy.
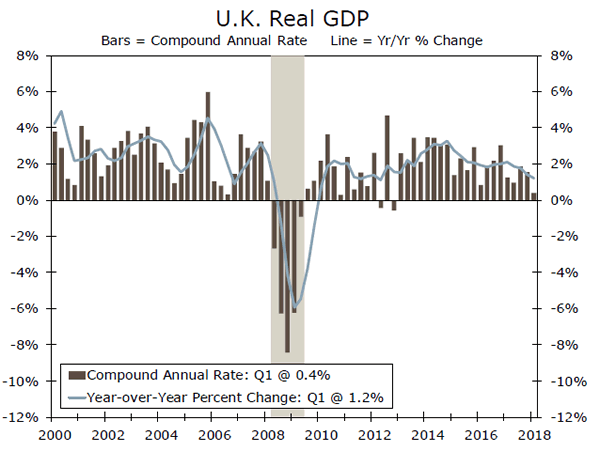
- Economic growth in the U.K. downshifted in Q1 as it increased only 0.1 percent, not annualized. Before this release consensus expectations were for the Bank of England (BoE) to increase interest rates at its May 10 Monetary Policy Committee meeting. However, this seems unlikely now.
ECB and Bank of Japan Decisions as Expected
As expected, the European Central Bank (ECB), decided to leave interest rates unchanged while it kept its purchase of assets at €30 billion per month until at least September. Perhaps the biggest issue with the ECB's decision was the fact that the latest economic data have been weaker-than-expected, so markets were anxious to hear the spin the ECB president put on the communication of the institution's decision. To this, ECB President Mario Draghi said that he believed that the recent weaker-than-expected economic data were expected to be temporary and that he remained upbeat on the pace of economic growth for the Eurozone for the rest of the year. While the purchase of assets will probably run until September, we do not expect the ECB to start increasing rates until mid-2019. Meanwhile, the Bank of Japan (BoJ) kept its own monetary policy measures basically unchanged, as expected, and is even further away than the ECB from any move to start unwinding its expansionary monetary policy. The communication from the BoJ took away reference to the timing to get back to the target rate of inflation of 2 percent, which prompted speculation that the BoJ may be indicating a change in policy. However, (at the press conference), Governor Kuroda affirmed that the removal was not an indication of policy change.
U.K. Economic Growth Weakest Since 2012
Economic growth in the U.K. downshifted in Q1, as it increased 0.1 percent, not annualized. The outturn was lower than the 0.3 percent expected by markets and sent analysts to revise their view on the timing for when the Bank of England (BoE) may start tightening monetary policy. Economic growth in Q1 was driven by industrial production, up 0.7 percent, while services increased at a 0.3 percent rate, not annualized and compared to the previous quarter. However, much of the weakness was allocated to the construction sector, which nose-dived 3.3 percent in the quarter. Before this release, consensus expectations were for the BoE to increase interest rates at its May 10 Monetary Policy Committee meeting. However, this seems unlikely now. We still believe that the economy may have been affected, at least in part, by weatherrelated issues in Q1 and expect these temporary factors to ease in the coming quarters. However, the weakness in Q1 will raise questions on the underlying health of the British economy going forward.
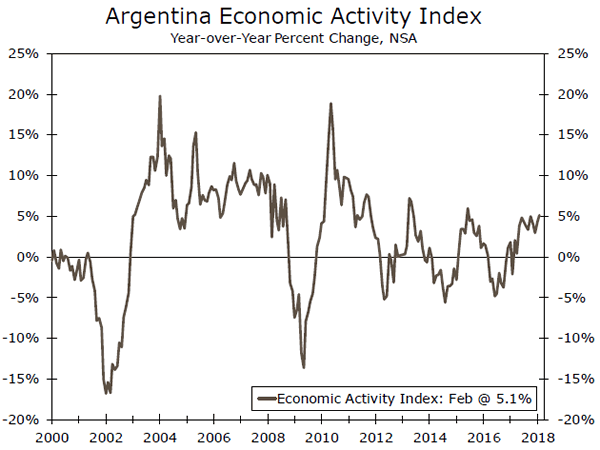
Economic Activity in Argentina Mixed in February
In Argentina, the economic activity index showed mixed results, as it increased 5.1 percent compared to a year earlier, while declining 0.2 percent on a seasonally-adjusted basis compared to January. This was the first decline on a month-on-month basis since July 2017. Meanwhile, the strong year-over-year increase was due to a low base of comparison in February 2o17 for almost every sector of the economy. The index of economic activity in February 2017 declined 2.1 percent compared to February 2016. Meanwhile, the Macri administration has run into trouble with its planned increase in utility rates, threatening this year's inflation target. At the same time, the Argentine central bank has needed to intervene in the foreign exchange rate market in an attempt to reduce the pressure on the Argentine peso.
Global Outlook
Mexico GDP • Monday
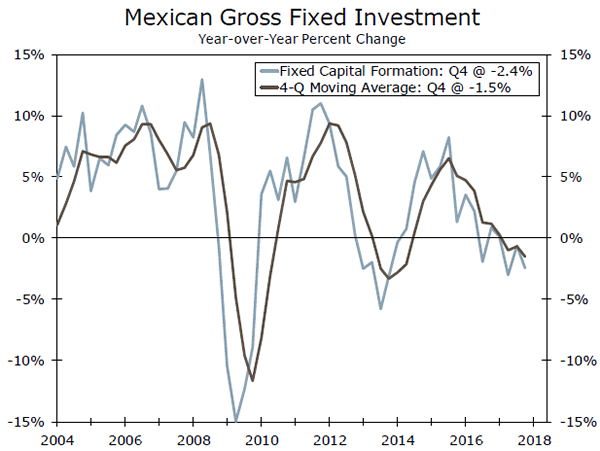
The Mexican economic environment proved challenging in 2017 amid increased inflation due to adjustments in regulated prices and the central bank's monetary tightening campaign. Real GDP growth was just 1.5 percent year over year in Q4-2017, the slowest pace in four years. The contraction in gross fixed capital formation in Mexico suggests uncertainty is weighing on investment spending. NAFTA is perhaps the biggest uncertainty, but political uncertainty and the major corporate tax overhaul in the United States are likely also influencing investment decisions by Mexican firms.
Despite the challenges, domestic consumption managed to hold up at the end of the year, particularly for services. Faster economic growth in the United States should be a tailwind to economic growth in Mexico this year. We look for real GDP growth in Mexico to grow 1.9 percent this year, more or less in-line with its pace last year.
Previous: 1.5% Wells Fargo: 1.7% Consensus: 1.6% (Year-over-Year)
Eurozone GDP • Wednesday
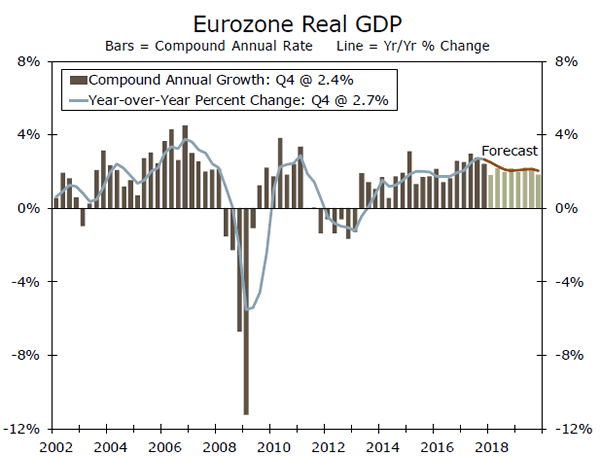
Real GDP growth in the Eurozone in Q4-2017 was 2.7 percent yearover- year, the fastest pace since Q3-2007. In its policy report this week, the Governing Council of the European Central Bank (ECB) noted that favorable financing conditions and a robust labor market have been supportive to aggregate demand.
Some of the momentum at the end of last year appears to have faded slightly. Purchasing Manager Indices have moved lower since January, and industrial production growth was negative in the first two months of the year. Looking forward, ECB policymakers see the risks to the outlook as broadly balanced, while noting protectionism as a key downside risk. We look for real GDP in the Eurozone to decelerate in the coming quarters, but for actual growth to remain modestly above the potential growth of most countries in the Eurozone, which would continue to gradually narrow the output gap.
Previous: 2.7% Wells Fargo: 2.5% Consensus: 2.5% (Year-over-Year)
Eurozone CPI • Thursday
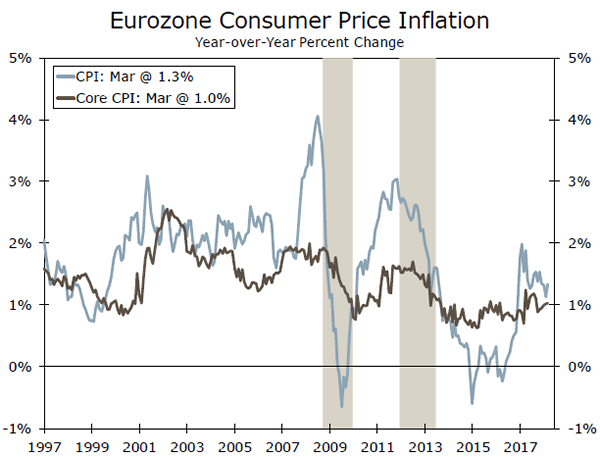
Despite a relatively positive growth outlook in the Eurozone, the lack of inflationary pressures have limited any sense of urgency by ECB policymakers to signal an end to its asset-purchase program. Core CPI inflation is just 1.0 percent year over year at present, well short of the "below, but close to, 2 percent inflation" the ECB targets. Not only has actual inflation remained in check, but inflation expectations based on market and survey-based measures "were largely unchanged since the January meeting," according to the notes from the Governing Council meeting last week.
If inflation shows signs of picking up steam in April and May, the ECB would likely be more inclined to send strong signals at its June meeting about the end of quantitative easing. With the Federal Reserve actively winding down its balance sheet, stronger inflation in the Eurozone remains the final missing link to bring a decade of bond buying by the world's two biggest central banks to a close.
Previous: 1.3% Wells Fargo: 1.4% Consensus: 1.3% (Year-over-Year)
Point of View
Interest Rate Watch
Interest Rates in a Global Context Two themes underlie our view on the interaction of global developments and domestic interest rates. First, the global marketplace allocates financial capital through global capital flows. Financial incentives matter.
Second, interest rates, exchange rates, economic growth and the flow of funds are part of the same economic system, even though research often splits the analysis of each of these areas among different analysts.
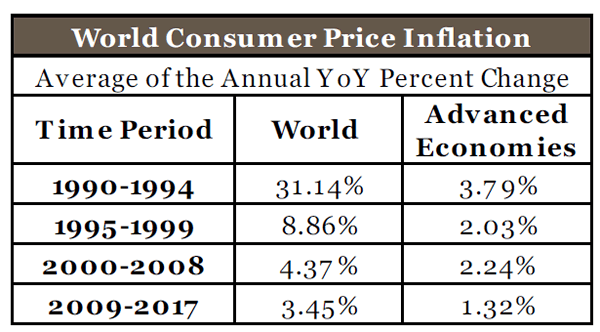
Global Inflation: Lower
Before we jump into the analysis of interest rates, our approach today is to start with the fundamentals—particularly inflation. As illustrated in the top table, inflation rates for both the world and advanced economies have slowed over the past thirty years and especially since the 2007-2008 recession.
Therefore, nominal interest rates would follow this lower path as well over the long run.
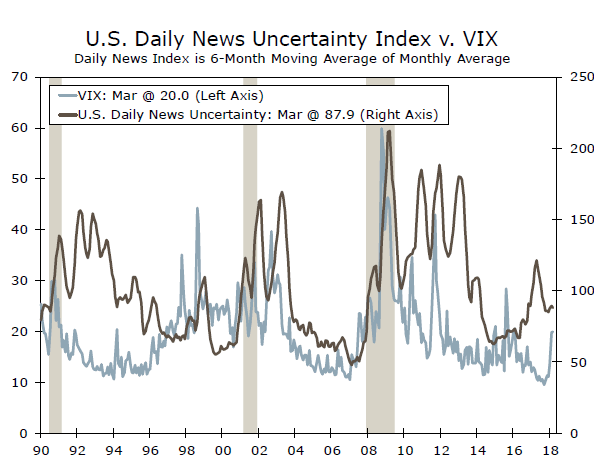
Short-Run Volatility
In contrast, over shorter periods of time, financial flows respond to changes in investor confidence. In the middle graph, we highlight a measure of daily news uncertainty as an illustration of the information that greets investors every day and how that uncertainty may lead to periods of risk aversion or risk seeking. For example, note the low level of uncertainty during the 2004-2007 period that was associated with risk-seeking behavior in both the equity and housing markets. In addition, note the high level of uncertainty associated with the 2010-2012 period, but the drop in risk aversion with equity market gains during the 2014-2016 period. It is interesting that the current market volatility would be associated with higher uncertainty indications.
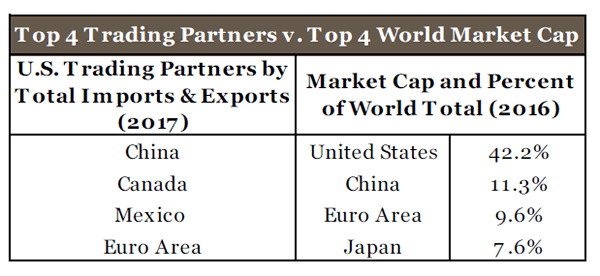
Trade and Market Capitalization
Finally, notice the link between international trade relationships and allocations of financial capital as measured by market capitalization (bottom table). Finance and real economic activity are indeed linked.
Credit Market Insights
Loan Growth Revival?
Loan growth data, related to the commercial and industrial (C&I) space, have recently shown sign of a pick-up. Following nearly four years of slowing year-over-year growth, C&I loan growth appears to have reversed that pattern. Over the past four months, C&I loan growth has been strengthening, a trend we expect to continue, albeit at a restrained pace. This trend is consistent for both small and large domestic banks, as well as foreign banks.
The encouraging trend is not limited to just C&I lending, as commercial real estate lending appears to have hit an inflection point as well. Likewise, consumer loan growth has ticked up, a trend consistent with the Federal Reserve's Senior Loan Officer Survey, which shows stronger levels of demand for these types of loans. Interestingly enough, banks continue to tighten lending standards to protect against potentially delinquent borrowers. Although net charge-off rates have slowly inched up over the past several months, the series is still near its all-time low.
The reversal of the decelerating year-overyear growth rates for loans is perhaps partially attributable to borrowers looking to lock in lower rates in an environment in which the FOMC is prepared to continue to tighten policy. The tax reform bill may have also stoked loan demand and encouraged businesses to focus on equipment and structural investment projects.
Topic of the Week
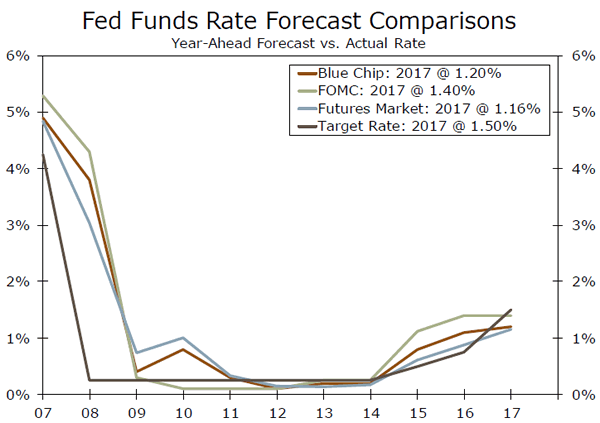
How Accurate Are Fed Funds Rate Forecasts?
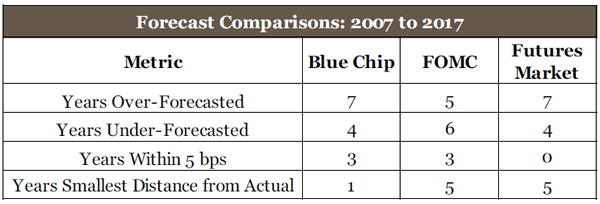
The FOMC will meet next week for its May policy meeting. Although we do not look for any change to the fed funds rate next week, we take this opportunity to examine the accuracy of fed funds rate forecasts from popular forecasting sources. We highlight findings from our recent report "Forward Rates Part 2: Who is the Oracle," as decision makers continue to watch the FOMC for insights on the path of the fed funds rate this year.
We use 11 years of historical forecast data from the Blue Chip Financial Forecasts, the FOMC and the fed funds futures market to compare the accuracy of three wellknown forecasting sources in predicting the fed funds rate from 2007 t0 2017. We take the year-ahead projected fed funds rate and compare it to the year-end actual fed funds rate for each forecast horizon. We found that the FOMC and futures market forecasts have the smallest distance from the actual rate in five of the 11 years, while the Blue Chip forecasts have the smallest distance in just one year (top table). In terms of direction, Blue Chip and the futures market over-predict the actual rate more than 60 percent of the time. The FOMC's projections have a more balanced 5-6 split on over- and under-forecasting the actual rate, respectively. For more details on our methodology, see the report referenced above.
Our analysis also has implications for comparing public and private sector forecasts. Both private sector sources were similar in terms of over-forecasting the actual rate. However, the Blue Chip and FOMC forecasts come within 5 bps of the actual rate the same number of times, and the FOMC and futures market were tied for the number of years with the smallest distance from the actual rate. It is also interesting to note the more recent trend that all sources over-forecasted the actual rate in 2015 and 2016, yet under-forecasted the actual rate in 2017 as the FOMC picked up the pace of tightening (bottom chart). As market participants keep a close watch on expected rates from various forecast sources, it is key to remember that each source has tradeoffs when used as a benchmark for future rates.
The Weekly Bottom Line: First Quarter Growth Softens Less than Expected
U.S. Highlights
- First quarter GDP growth came in at 2.3% (annualized) - slower than fourth quarter growth, but still better than expected. Softer consumer spending was the main culprit behind the slowdown.
- Consumer spending should regain a firmer footing ahead, buoyed by a healthy labor market and tax cuts.
- Rising oil prices accentuated concerns about rising inflation, helping to push the 10-year Treasury yield to the 3% mark. The rise in yields weighed on equity valuations midweek, but a slew of broadly positive earnings reports coupled with the upside surprise on GDP helped markets recover.
Canadian Highlights
- Another week of elevated oil prices helped bring the TSX composite index into positive territory to end the week. The discount received by heavy oil producers remains modest relative to the start of the year, with the benchmark contract holding above $50/barrel for a third week.
- A solid payroll employment report bodes well for monthly GDP next week, but a fairly modest start to the year remains likely. We continue to track Q1 GDP at 1.6% annualized.
- There were encouraging signs of progress on NAFTA negotiations this week, but with a number of contentious issues still unresolved, it seems more likely to be weeks, not days, before an agreement in principle is reached.
U.S. - First Quarter Growth Softens Less than Expected
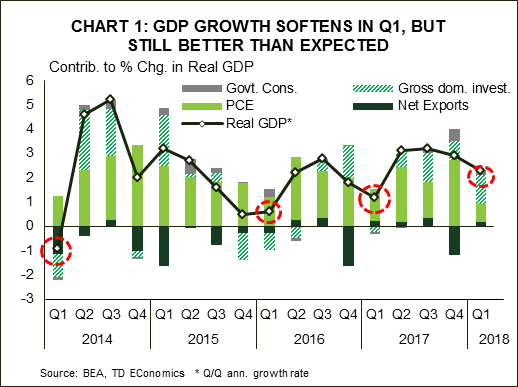
Over the past few years, first-quarter growth has slowed notably from the fourth quarter, often attributed to a phenomenon known as residual seasonality. This year was no exception. First-quarter growth came in at 2.3% (annualized) – slower than the 2.9% recorded in the fourth quarter, but still better than market expectations for a 2.0% advance. Economic activity was supported by improved business investment, which recorded a solid performance thanks in part to a surge in activity in the petroleum and natural gas sector (+43% Q/Q ann.), and by an unexpected small positive contribution from net trade (Chart 1).
Following a 4% annualized expansion in the fourth quarter that was partly boosted by post-hurricane recovery spending, consumer spending slowed markedly, contributing just a measly 0.7 percentage points to growth. Consumer spending should regain a firmer footing ahead, buoyed by upbeat consumer confidence, a healthy labor market and tax cuts. This narrative is corroborated by stronger monthly spending toward the end of the first quarter, including the surge in March retail sales and a second consecutive monthly gain in existing home sales. The latter rose 1.1% m/m, but the recent performance would have likely been even better if it weren't for very tight inventories.
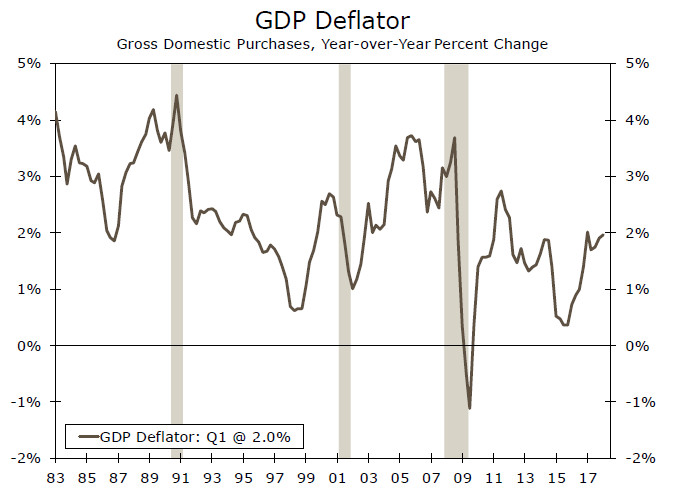
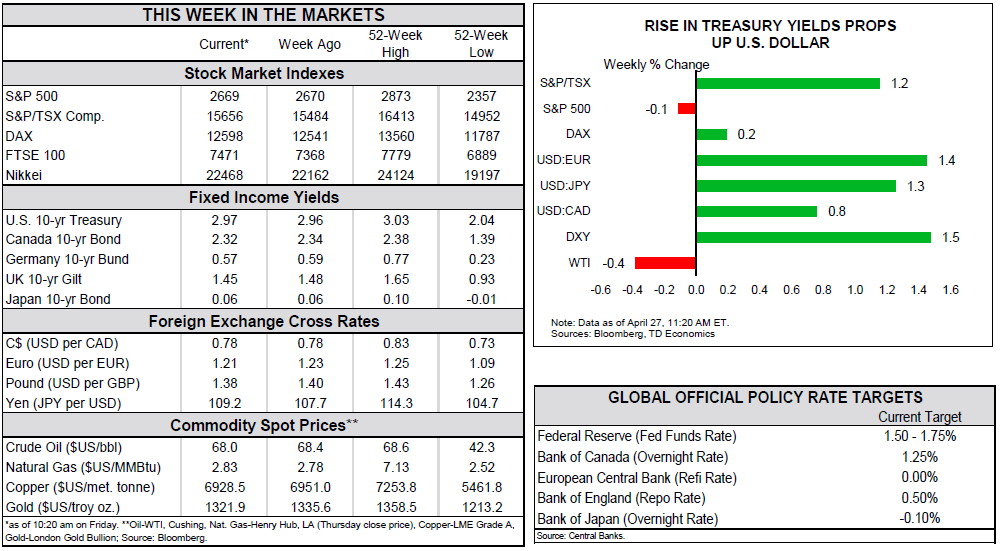
Overall, the better-than-expected GDP outturn and healthy outlook ahead may augur a faster pace of rate hikes. But the evolution of price pressures will be the deciding factor. On that front, higher oil prices this week –WTI reached $68/barrel for the first time since late 2014 – accentuated concerns about rising inflation. This helped push Treasury yields higher, with the 10-year yield briefly breaching the 3% mark for the first time since 2014. The rise in yields propped up the trade-weighted U.S. dollar and weighed on equity valuations midweek. But a slew of broadly positive earnings reports, coupled with the upside surprise on GDP, eventually helped markets recover losses.
This week's selloff reinforces our view that volatility has made a comeback. The return of volatility, something which is likely here to stay, suggests that investors are now responding to, rather than shrugging off, negative news. Perhaps one of the best examples of this reality is the market reaction to elevated trade tensions between the U.S. and China earlier this month.
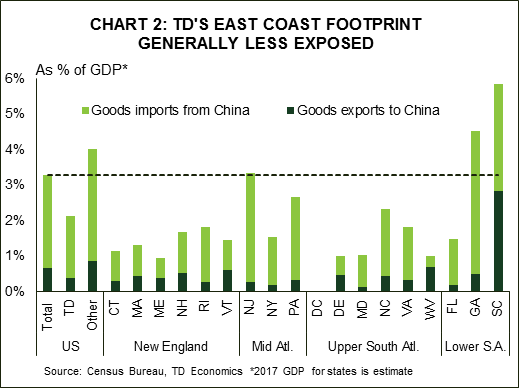
Ultimately, we believe that there is still time for the U.S. and China to settle their trade differences without much collateral damage – something that appears more likely now with the Treasury secretary scheduled to embark on a trip to China shortly. However, there is still a possibility that the talks fail and tariffs are implemented, with this scenario expected to weigh on economic growth. In a recent report that considers the impact on regional economies, focusing on TD's East Coast footprint, we find that the Eastern Seaboard is roughly half as exposed to trade with China compared to the rest of the country combined (Chart 2). This would enable most states in the footprint to duck much of the blow from the prospective tariffs. That said, South Carolina's elevated trade with China leaves it's economy more vulnerable to the economic drag from protectionist trade policy.
Canada - Getting Closer To 'Normal'
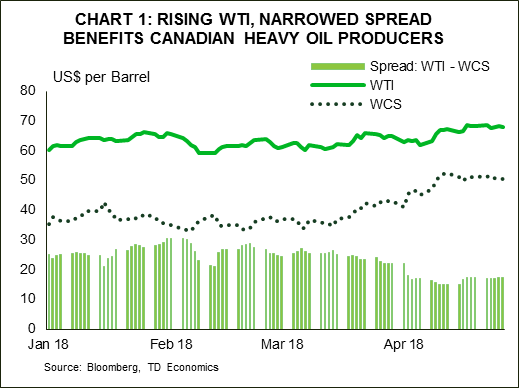
With little in the way of major economic news, it was a fairly calm week in Canadian financial markets. After a slow start to the week the S&P/TSX Composite Index looks poised to end the week slightly higher on relatively broad-based strength. Helping things along were yet another week of elevated oil prices. The benchmark West Texas Intermediate (WTI) price remained in the high US$60/barrel range, while the Western Canada Select (WCS) contract, representative of what heavy producers in the oil sands receive, remained above US$50/barrel for a third week (Chart 1).
Indeed, recent developments including some restoration of transportation capacity and ongoing issues in Venezuelan production (which produces a similar grade of oil) have helped narrow the price gap between Canadian heavy oil and the benchmark to roughly $17/barrel, well below the roughly $25 to $30 discount that prevailed early in the year. While elevated, the spread is now much closer to the $10 to $15 discount that typically prevails due to quality differences and normal transportation costs.
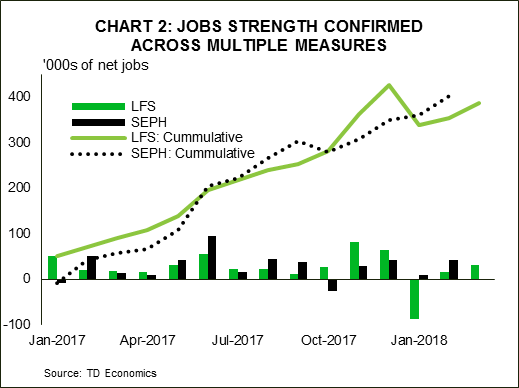
It wasn't entirely quiet on the data front this week, with Statistics Canada Survey of Employment, Payrolls and Hours for February released. Although it comes with a much greater lag than the Labour Force Survey (which provides the unemployment rate), economy watchers pay attention to it for several reasons. One is that, since it is based on employer responses (rather than workers), it provides a 'cross-check' of the labour market. On this basis, it is encouraging to see that outside of usual monthly differences the trend across the two measures is roughly the same, with employers reporting a faster overall pace of hiring since the start of 2017 (Chart 2).
The other reason to watch this series is that it functions as an input into GDP calculations for a number of industries (particularly service sectors). In the event, the 42.2k rise in payroll employment and slight tick-up in overall hours worked in February bodes well for next week's monthly GDP report. We look for a 0.3% monthly gain, reversing the weakness of January and consistent with our current Q1 tracking of 1.6%. Looking through the various shocks buffeting the Canadian economy so far this year, the data continues to point to an economy trending around 2%; a reasonably 'normal' pace of growth given the business cycle and our economic fundamentals.
The other aspect of 'normality' is the potential for a near-term resolution of NAFTA renegotiations. Reports have indicated that the U.S. team hopes to have an agreement in principle by this coming Tuesday (May 1st), in time for Trade Representative Robert Lighthizer's trip to China. Such a tight timeline, even for just an agreement in principle, seems optimistic. Rules governing the auto sector have been getting most of the attention, with indications that the teams are close to a conclusion. However, a number of contentious issues are reportedly still unresolved, including investor-state dispute resolution, supply management, government procurement, and others. As a result, while there are some reasons to be optimistic that this cloud of uncertainty may soon be lifted, the timeline to a conclusion seems more likely to be measured in weeks, not days.
U.S.: Upcoming Key Economic Releases
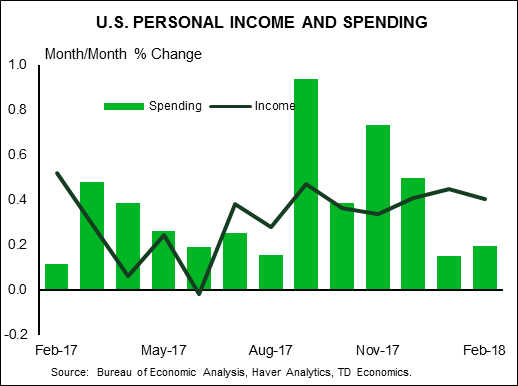
U.S. Personal Income & Spending - March
Release Date: April 30, 2018
Previous Result: Income 0.4% m/m; Spending 0.2% m/m
TD Forecast: Income 0.3% m/m; Spending 0.4% m/m
Consensus: Income 0.4% m/m, Spending 0.4% m/m
We look for headline PCE inflation to accelerate to 2.0% y/y in March, reflecting a flat m/m print. In line with the CPI report, energy prices will be lower on the month with food prices up a modest 0.1%. We expect a relatively weak 0.1% m/m print in the core PCE, pushing the y/y rate to 1.9% y/y. A move to 2.0% is unlikely given the quarterly data released in the Q1 GDP report, where core PCE recorded a 1.7% y/y increase.
Nominal PCE (personal spending) should post a 0.4% increase in March on a rebound in durables, translating to the reported 1.1% advance in real Q1 real consumer spending. We look through the weakness as temporary since residual seasonality, weather and delayed tax refunds partly contributed to the slowdown. Solid incomes, confidence and tight labor markets also underpin a solid rebound in Q2 back near 3%. We look for a 0.3% increase in March personal income, in line with a robust 3.6% advance in Q1 incomes.
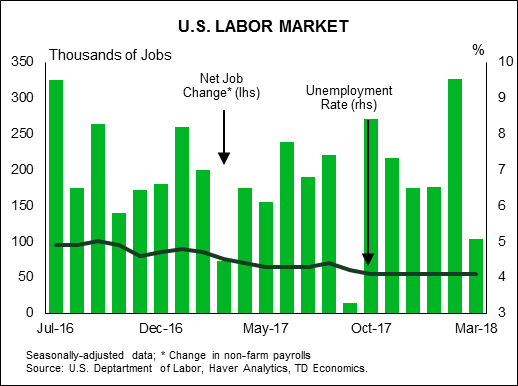
U.S. Employment - April
Release Date: May 4, 2018
Previous Result: 103k; unemployment rate
TD Forecast: 210k; unemployment rate: 4.0%
Consensus: 185k; unemployment rate: 4.0%
We expect nonfarm payrolls to bounce back, adding 210k jobs in April. The weak 103k print in March largely reflects a giveback from the blockbuster February gains that were concentrated in construction and certain services categories such as retail trade. We expect a return back toward trend consistent with continued strength across survey indicators (employment surveys, consumer confidence), with some upside as April payrolls tend to beat expectations and outperform ADP employment in particular.
Given the still solid pace of job gains, we expect the unemployment rate to move lower to 4.0% assuming a stable to lower participation rate. We expect average hourly earnings to rise 0.2% m/m, as reference week distortions suggest a high bar for a 0.3% or higher print. That should leave the y/y pace steady at 2.7%, consistent with the prevailing view at the Fed that wage growth remains only moderate.
Canada: Upcoming Key Economic Releases
Canadian Real GDP - February
Release Date: May 1, 2018
Previous Result: -0.1% m/m
TD Forecast: 0.3% m/m
Consensus: 0.3% m/m
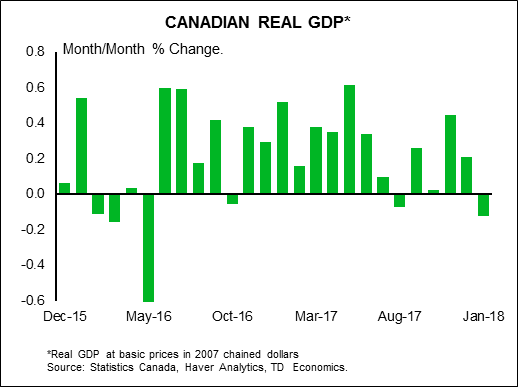
Real GDP is forecast to advance by 0.3% in February on a broad increase in goods output while services should make a more modest contribution. Manufacturing will benefit from a rebound in motor vehicle output, as evinced by the sharp increase in factory sales while construction should also make a positive contribution on strength in the residential multi-unit component. Multiple oil sands facilities reduced production in February due to transportation bottlenecks, but these will be offset by a rebound from weather-related outages last month. For services, we expect continued weakness in home sales to drive a decline in real estate while a sharp increase in financial market volatility may weigh on the financial sector. Wholesales sales were also down sharply on the month, but strength in hours worked suggests momentum remains solid outside these industries. A 0.3% print would be consistent with Q1 growth in the mid to high 1% range, slightly above the Bank of Canada's 1.3% projection from the April MPR.
Canadian International Trade - March
Release Date: May 3, 2018
Previous Result: -$2.7bn
TD Forecast: -$2.3bn
Consensus: -$2.0bn
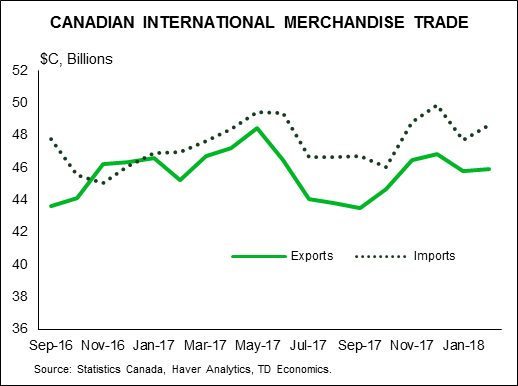
The international merchandise trade deficit is forecast to narrow to $2.3bn in March, reflecting a sharp increase in goods exports offset by more modest import growth. Export growth will be led by agricultural products after transportation bottlenecks led to an unprecedented 17% decline in February, concentrated in grains. CAD depreciation should also lend a hand, with the cumulative decline from the Q1 highs reaching 6.7% by mid-March. However, energy products represent a downside risk on maintenance shutdowns that were pulled forward due to market conditions. On the other side of the ledger, imports should see a more modest increase after a 1.9% advance in February. Aircraft should make a positive contribution on strong Boeing deliveries though the deceleration in core retail sales will weigh on consumer goods imports.
Dollar Slows Down Awaiting Employment Data
The US dollar had massive weekly gains against all majors. The release of the gross domestic product for the first quarter of 2018 beat expectations but did little for a dollar that had rallied all week. Dovish central bank rhetoric from the European Central Bank (ECB) and the Bank of Japan (BOJ) have increased the anticipation for the U.S. Federal Reserve’s Federal Open Market Committee (FOMC) on Wednesday, May 2 at 2:00 pm EDT. There is little chance that the Fed will hike rates in May, but the strong data has put three more rate hikes firmly on the table. Employment data will play a big part in that decision and with the release of the U.S. non farm payrolls (NFP) on Friday, May 4 at 8:30 am EDT all eyes will be on average hourly earning for any insight into inflationary pressures.
- Reserve Bank of Australia (RBA) to keep rates unchanged on Tuesday
- U.S. non farm payrolls (NFP) rebound expected with all eyes on inflation data
- Strong US GDP in Q1 probably not enough for US hike in May
Inflation to be Key in U.S. non farm payrolls (NFP) Report
The EUR/USD lost 1.28 percent during the week. The single currency is trading at 1.2129 after the growth of the US economy beat the forecast. Gross domestic product in the United States came in at 2.3 percent when the market expected 2.0 percent. The hawkish tone of the Fed’s latest comments and strong indicators are boosting the US across the board. In contrast European data has been disappointing and has put the European Central Bank (ECB) in a tough spot, as its QE program is nearing its end in September.
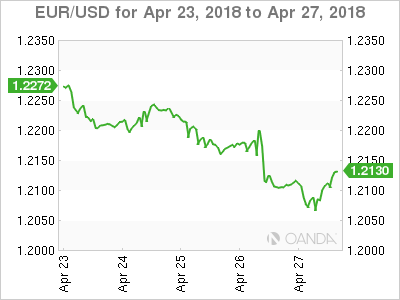
The week of April 24 to 27 had few economic calendar releases. The European Central Bank (ECB) and the Bank of Japan (BOJ) were the highlights, but as expected held their respective quantitive easing programs unchanged. The US dollar is ahead versus major pairs after Fed members have been talking up the probabilities of three more interest rate hikes this year. The U.S. Federal Reserve already hiked once in March and with steady growth of the economy it aims to increase the interest rate divergence with the major central banks.
The European Central Bank (ECB) opted to leave its benchmark rate intact and made no announcements regarding the end of the quantitative easing program. ECB President Mario Draghi was neither hawkish nor dovish, which resulted in little support for the euro. The eyes of the market will now be fixed in the June and July meetings for some insights into the plans of the central bank.
US companies reported earnings this week with the good results driving stock prices higher in particular the tech sector. US yields continue to flirt with the 3.0 percent line, but this time it is under as the 10 year note fell to 2.990 percent. US unemployment claims fell to 209,000 fell to its lowest level in 48 years with next week’s U.S. non farm payrolls (NFP) to show if there is any impact of strong US employment on wage growth.
RBA expected to hold rates unchanged at 1.5 percent. The RBA could be on the sidelines for the rest of 2018. Central bank has a balanced outlook. Global trade uncertainty to be a factor coupled with a Chinese economic slowdown.
US jobs reports to have strong headline numbers, but the devil is in the inflation details. Employment has been a strong pillar of the US recovery, but wages have lagged behind. The more dovish members of the Fed make a point to cite the lack of inflationary pressure when they point to their more hawkish colleagues. Higher wages would validate the Fed’s plans for 3 or 4 rate hikes this year.
The Fed will meet next week with no changes expected to be announced on Wednesday. The Fed has hinted through rhetoric that if growth keeps up 3 more rate lifts would be needed. The market had already priced in 3 this year, so the fourth bump in borrowing costs has given the US dollar a boost in April.
Pound Looking Ahead at PMIs after Disappointing Q1 GDP
The GBP/USD lost 1.59 percent in the past five days. The currency pair is trading at 1.3780 after the disappointing GDP reading for the first quarter is putting serious doubts on a May rate hike by the Bank of England (BoE).
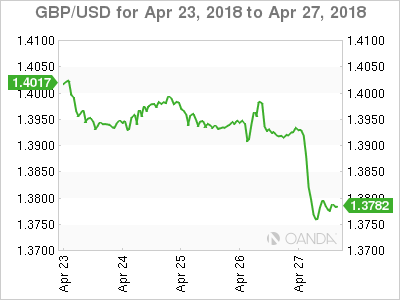
The British economy had a slow start to 2018. Purchasing manager indices (PMIs) for manufacturing, construction and services have disappointed this year. With Bank of England (BoE) Governor Mark Carney surprising investors last week with comments suggesting the central bank could not hike rates in May, economic indicators, specially leading ones such as PMIs gain more relevance in trying to forecast the moves of the central bank. Carney has pointed out that mixed data could push out a rate rise until later this year.
Market events to watch this week:
Sunday, April 29
- 9:00pm NZD ANZ Business Confidence
Monday, April 30
- Tentative AUD RBA Gov Lowe Speaks
Tuesday, May 1
- 12:30am AUD Cash Rate
- 12:30am AUD RBA Rate Statement
- 4:30am GBP Manufacturing PMI
- 8:30am CAD GDP m/m
- 10:00am USD ISM Manufacturing PMI
- 2:30pm CAD BOC Gov Poloz Speaks
- 6:45pm NZD Employment Change q/q
Wednesday, May 2
- 4:30am GBP Construction PMI
- 8:15am USD ADP Non-Farm Employment Change
- 10:30am USD Crude Oil Inventories
- 2:00pm USD FOMC Statement
- 9:30pm AUD Trade Balance
Thursday, May 3
- 4:30am GBP Services PMI
- 8:30am CAD Trade Balance
- 10:00am USD ISM Non-Manufacturing PMI
- 12:00pm CHF SNB Chairman Jordan Speaks
- 9:30pm AUD RBA Monetary Policy Statement
Friday, May 4
- 8:30am USD Average Hourly Earnings m/m
- 8:30am USD Non-Farm Employment Change
*All times EST
Week Ahead – Fed, Jobs Report and PCE Inflation Eyed by Dollar Bulls; RBA and Eurozone GDP also in...
The central bank theme will continue next week as the US Federal Reserve and Reserve Bank of Australia hold policy meetings. The latest nonfarm payrolls report and PCE inflation figures look set to keep the US dollar at the centre of attention for much of the week. Another keenly awaited data will be the flash GDP and CPI numbers out of the Eurozone, while PMI readings from China, the United Kingdom and the United States will also be important.
RBA unlikely to budge
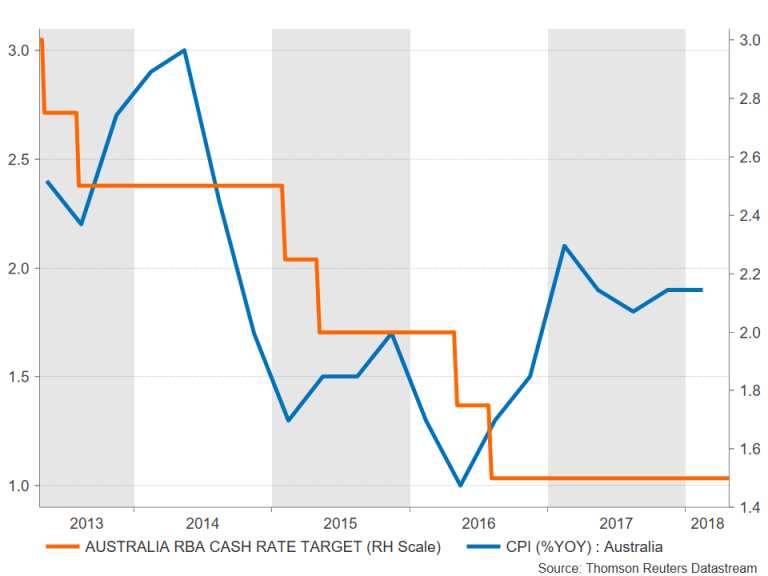
After tumbling to 4-month lows this week, the Australian dollar will struggle to find much support from the RBA policy meeting and could be headed for further declines. The RBA is almost certain to keep its cash rate unchanged at 1.50% on Tuesday as inflation remains stubbornly low. Data this week showed annual CPI in the March quarter fell short of the bank’s 2-3% target band for the fourth straight quarter, while days earlier, March employment numbers disappointed. The RBA is unlikely to be too concerned by the soft indicators though and will probably maintain its optimism about the outlook. However, any shift to a more cautious tone could send the aussie spiralling downwards. Also to watch out of Australia next week are private sector lending on Monday, and building approvals and trade figures on Thursday (all for March).
Like its Australian counterpart, the New Zealand dollar has also been underperforming against the US currency. Quarterly job figures out of New Zealand on Wednesday could determine whether there’s an end to the kiwi’s downslide anytime soon.
Canadian GDP eyed
The Canadian dollar hasn’t been spared from the greenback’s wrath either, though higher oil prices have limited its losses. Data out of Canada next week may provide the loonie with some upside momentum. Monthly GDP numbers on Tuesday are forecast to show the economy expanding by 0.1% in February from the previous month, after a 0.1% drop in January. Other data will include March producer prices on Monday, trade data on Thursday and the Ivey PMI for April on Friday. If the data is broadly positive, expectations of a rate hike by the Bank of Canada this summer may get a boost.
UK and Chinese PMIs in focus
As flash PMIs are not published for the UK and China, the first and only release for April will be looked at closely next week. China’s National Bureau of Statistics will publish the manufacturing and non-manufacturing PMIs on Monday. The Caixin/Markit manufacturing will follow on Wednesday, with the services PMI coming up on Friday. Both manufacturing gauges are forecast to show a moderation in activity in April, likely raising some concerns about China’s growth outlook amid trade tensions with the US.
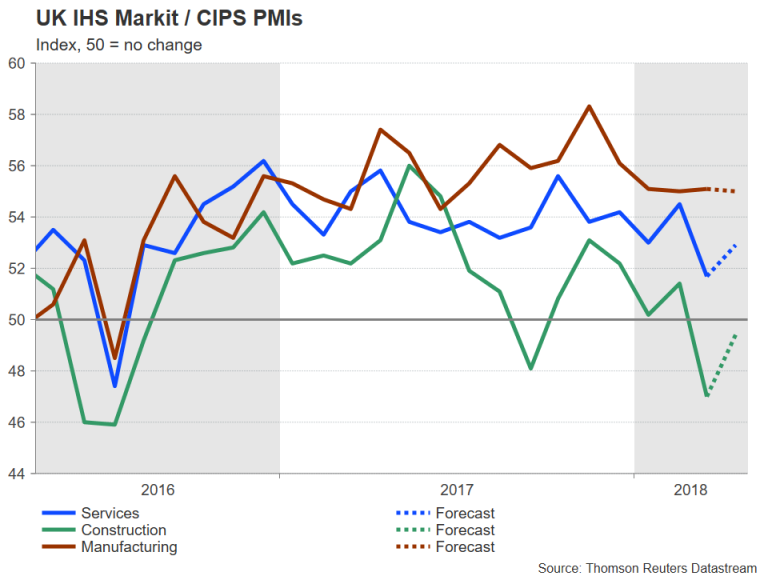
In the UK, the manufacturing, construction and services PMIs are due on Tuesday, Wednesday and Thursday respectively. The manufacturing PMI is expected to move marginally lower in April to 55.0 but a descent rebound from 51.7 to 52.9 is forecast for the services PMI. After the recent run of weak data, including this week’s poor GDP reading for the first quarter, which sent the pound tumbling to 7-week lows below $1.38, upbeat data with the PMIs next week could provide sterling a much-needed lift.
Eurozone flash GDP and inflation under the spotlight
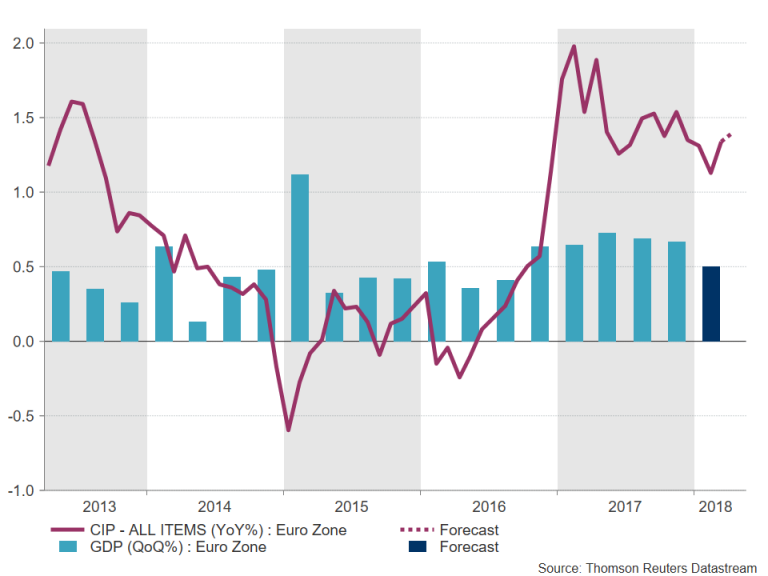
It will be an important week for Eurozone economic data over the coming seven days as flash readings for both first quarter GDP and April inflation are released on Wednesday and Thursday respectively. The preliminary flash print of GDP is expected to show the euro area lost some steam in the three months to March, with growth easing from 0.6% to 0.5% quarter-on-quarter. A negative surprise could trigger further sharp losses for the euro, putting it at risk of losing its grip on the $1.20 handle. The inflation data could provide some support however, as flash CPI is forecast to edge up from 1.3% to 1.4% year-on-year in April. Producer prices are also due on Thursday, while on Friday, the final Eurozone PMIs for April are published along with March retail sales.
Also on the horizon in Europe is a monetary policy meeting by Norway’s central bank on Thursday. After its Swedish counterpart this week pushed the timing of a rate hike later towards the end of the year, the Norges Bank is unlikely to follow suit and is expected to reaffirm its guidance of raising rates in the third quarter. The Norwegian krone could gain versus the dollar and the euro if the Norges Bank maintains confidence in its outlook.
Fed to hold rates; slew of US data coming up
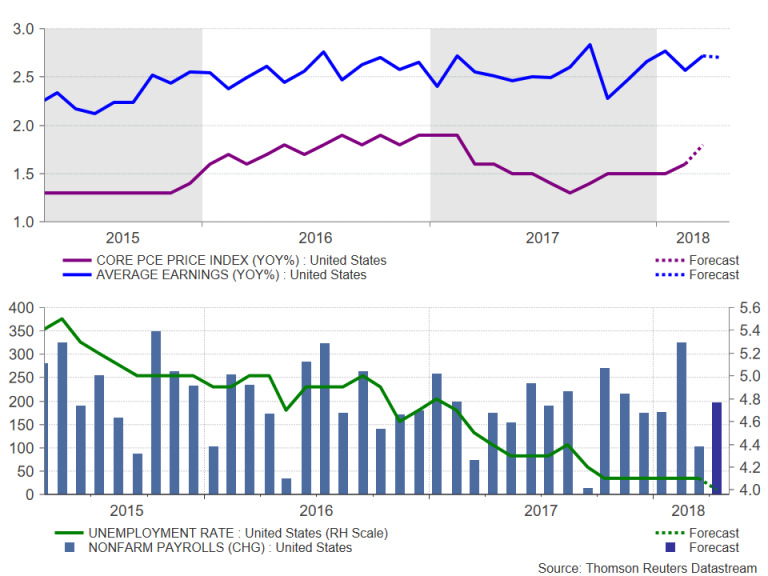
The Fed will hold a two-day monetary policy meeting on Tuesday and Wednesday, but with rates expected to be kept on hold at 1.50-1.75% and with no press conference, the event will struggle to compete with key US indicators due next week. Starting with the personal consumption expenditures (PCE) report on Monday, personal income and consumption are forecast to increase by a solid 0.4% month-on-month in March. The core PCE price index meanwhile, is expected to pick up from 1.6% to 1.8% y/y in March, taking the Fed’s favourite inflation measure closer to their 2% target. Also due on Monday are pending home sales and the Chicago PMI. On Tuesday, the ISM manufacturing PMI will be watched, with the non-manufacturing composite following on Thursday. Both indices are forecast to fall slightly in April but remain well above the 50 threshold, inside expansion territory.
Finally, on Friday, the all-important nonfarm payrolls report for April will round up the US calendar. Jobs growth is anticipated to have accelerated in April, with 198k jobs expected to have been created. The unemployment rate is forecast to fall to 4.0 from 4.1% in March. However, average hourly earnings are not expected to show any acceleration in wage growth in April, despite the ever-tightening labour market, with the annual rate remaining unchanged at 2.7%.
If the data come in broadly in line with estimates, the dollar may find it difficult to advance further following the recent impressive gains. However, positive surprises to either or both the PCE inflation data and NFP report could act as a catalyst for an extension of the current rally. The Fed though will probably stick to the message of gradual rate hikes even as economic indicators strengthen, at least for now.
Australia & New Zealand Weekly: RBA to Hold Stance but Likely to Lower Growth Forecast
Week beginning 30 April 2018
- RBA to hold stance but likely to lower growth forecast.
- RBA: policy decision, Governor Lowe speaks, Statement on Monetary Policy.
- Australia: dwelling approvals, house prices, private credit, trade balance.
- NZ: labour force survey, business confidence, building consents.
- China: Official NBS and Caixin PMIs.
- Euro Area: Q1 GDP.
- US: FOMC meeting, Treasury's Quarterly Refunding announcement, nonfarm payrolls.
- Key economic & financial forecasts.
Information contained in this report current as at 27 April 2018.
RBA to Hold Stance but Likely to Lower Growth Forecast
The Reserve Bank Board meets next week on May 1. The decision is certain to be to hold rates steady for another month.
We do not expect to see any significant changes in the Governor's Statement, although it will be interesting to see whether he follows the lead on the April minutes and notes "members agreed that it was more likely that the next move in the cash rate would be up, rather than down". Note that he did not use that terminology in his Statement on April 3 just the April Board minutes.
I have no doubt that such sentiment will be retained by the Board in the minutes but adopting that terminology in the Statement seems unlikely. Using that sentence in the much shorter Statement does impact flexibility given that if that sentence becomes "standard" then any exclusion of the sentence might be interpreted as a signal to preference lower rates even before the decision had been reached.
There have been a number of significant developments, particularly in financial markets, since the last Board meeting on April 3.
The US 10 year bond rate has risen from 2.77% to 3.03% The "2.77%" was described by the Governor as "still low", whereas 3.03% is the highest 10 year bond rate since January 2014 during the "Taper Tantrum". At that time markets were expecting the cessation of QE to lift bond rates significantly despite ample spare capacity in the economy. That action proved to be an over-reaction. This time markets are responding to the prospects of a huge fiscal stimulus in the US being superimposed on an economy with little spare capacity. Inflation risks have lifted pointing to a further sustained lift in bond rates.
The Governor also seems very "relaxed" about the rise in short term interest rates due to changes in both demand and supply conditions in US money markets. "Financial conditions generally remain expansionary. There has, however, been some tightening of conditions in US dollar short-term money markets, with US dollar short-term interest rates increasing for reasons other than the increase in the federal funds rate. This has flowed through to higher short-term interest rates in a few other countries, including Australia".
Combined with the rise in the long bond rates that sentiment seems somewhat over relaxed. That may be because the Bank expected conditions to ease in the money market. In fact, the three month LIBOR spread to OIS is only around 5bps off its mid April peak. The direct impact that increase is having on short term rates in Australia can be seen with the lift in BBSW from 2.03% to 2.08% inter Board meetings but that has since come back to 2.045%. Any potential easing in that rate as might have been indicated by the fairly relaxed assessment from the Governor in April has been dashed and the Statement may well refer to a marked tightening in financial conditions.
Further, although interest rate conditions have tightened the AUD has not fallen much to compensate. In TWI terms the AUD has fallen around 0.1% despite a fall in USD terms from USD0.77 to USD 0.755.
The labour market also seems to be slowing down. Jobs growth has moderated from the 3.4% in 2017 to a three month annualised pace of 1.2% in 2018. Perhaps the Governor might "tone down" his obvious exuberance around the labour market.
Next week we also see the release of the Statement on Monetary Policy.
In the Statement the Bank has an opportunity to review forecasts. The only forecasts contained in the SOMP are for GDP growth; inflation (both headline and underlying) and the unemployment rate. Recall that in February the Bank expected GDP growth to lift from 2.5% in 2017 to 3.25% in 2018 and 2019 - that is 0.5% above trend and would certainly be consistent with rising inflation pressures as the output gap closed.
Signals from the Bank on the growth outlook have varied: a bit above 3%; trend; and stronger than last year. My expectation is that the Bank will back off a little with its 2018 growth forecast from 3.25% to 3.0%. The 2019 forecast will remain the same at 3.25%.
It is interesting to observe that the Bank's growth forecasts in February were above the Government's forecasts in the Mid- Year Economic and Fiscal Outlook (released in December). The Government forecast fiscal year (year average) growth of 2.5% (2017/18); 3.0% (2018/19); and 3.0% (2019/20).
The Bank's equivalent forecasts are: 2017/18 (2.75%); 2018/19 (3.25%) and 2019/20 (3.25%).
It is likely that when the Government refreshes its forecasts for the May Budget (announced on May 8) it will retain its MYEFO numbers. Different views in the "official family" are not uncommon but the changed rhetoric at the Bank and the lower official forecasts point to a change in the May SOMP.
A second forecast in the SOMP which is of interest is the forecast for underlying inflation. In February the Bank forecast: 1.75% (Dec 2017); 1.75% (Dec 2018); 2% (Dec 2019) and 2.25% (June 2020).
The body of the SOMP specifically discusses the Trimmed Mean when referring to Inflation so it is reasonable for us to follow suit.
Recall that the Bank's track record with the Trimmed Mean has been disappointing in recent years. In the year to December 2016 (1.6%); and 2017 (1.8%).
The forecast for underlying inflation to December 2018 is 1.75% and to December 2019 the forecast is 2.0%. In the last 11 quarters the Trimmed Mean has printed: 0.3 (x2); 0.4 (x4); 0.5 (x4); and 0.6 (x1).
There is clearly no sign of any uptrend in the Trimmed Mean although the measure for March, which printed on April 24 was 0.5.
If the Bank were to raise the 1.75% forecast for December 2018 to 2.0% there would be no real raised eye brows although it would be based on the Trimmed Mean stringing together a series of 0.5's - not supported by the track record.
Such an adjustment would signal a more confident assessment of the inflation outlook as a result of the March quarter Inflation Report. We do not think that conclusion is justified.
With the exception of motor vehicles (which fell a significant 1.1% in the September quarter) the evidence of ongoing competitive pressures impacting deflationary forces on Australia's inflation rate were once again apparent. Clothing and footwear fell 2.0%; household contents fell 0.4%; communication fell 0.4%; audio visual fell 4.1% and holiday travel fell 0.5%. There was some emerging evidence of the impact of the weakening housing market on inflation with "house purchase" (the cost of building a new home excluding land value) up only 0.5% (a figure around 1% has been consistent with a solid market) and rents remaining particularly weak at 0.2%.
Overall the Statement and the SOMP are unlikely to see any significant changes in market sentiment.
The week that was
Market attention was captured by the US 10 year treasury's venture above 3% and a jump in the USD saw the AUD cross fall to 0.755, while the notion of peak earnings saw developed market equities tread water. In terms of data, the focus in Australia was on the Q1 CPI release.
Q1 Australian CPI printed at 0.4% (0.45% at two decimal places) just below the market consensus of 0.5%. That marks six consecutive quarters where the consensus has overestimated the CPI. However, the core measures met expectations with both the trimmed mean and weighted median rising 0.5% with the annual pace of the average of the core measures ticking up to 2.0%yr, just at the bottom of the RBA's 2-3% target band. Tradable prices continue to be a drag down 0.5%yr as the competitive margin squeeze in the retail sector remains a significant factor. Nontradables have been holding up inflation at 3.1%yr. Health and education had their normal Q1 price reset but the pace softened compared to what it was a few years back and in regards to housing costs, the push from rising utilities have been more muted than expected. In short, the Q1 result continues to suggest there are few signs of inflationary pressure in Australia.
On the RBA, Assistant Governor Kent gave a speech on interestonly (IO) loans. The 2017 macroprudential measures were targeted at slowing IO loan growth and included a cap of 30% on their proportion of new mortgages. Ultimately this saw a rise in IO interest rates and many borrowers switched to principal and interest (P&I) but some remained on IO. For the borrowers that remained on IO, the 30% cap means that some will not be able to roll over their interest-only period come expiry and will consequently need to switch to P&I. The key take out from Kent's speech is that while the RBA acknowledge that the 'step-up' to P&I payments for some individual households is non-trivial, they estimate that the aggregate cash flow effect is small and will only have a marginal effect on total household consumption.
Also to do with macroprudential, APRA has removed the investor lending cap and now expects banks to introduce their own lending restrictions. APRA stated that lending standards have improved since the 10% cap on investor credit growth was introduced in late-2014. The cap will be removed on July 1 for lenders that have been operating below the benchmark for six months, and can confirm their lending policies meets guidance on serviceability. APRA Chairman Byres also stated that there is more to do to strengthen the assessment of borrower expenses and existing debt, and the oversight of lending outside of policy.
Ahead of the budget, Treasurer Scott Morrison spoke to the Australian Business Economists, "Lower taxes for a stronger economy". The Federal Budget is to be delivered on May 8, potentially the final annual budget ahead of the next Federal Election which is due by May 18 2019. The budget position for 2017/18 is running ahead of forecast by around $10bn after the recent unexpected resilience of commodity prices and the jobs surge in 2017. The Government is scrapping the Medicare levy increase announced in the May 2017 Budget and is likely to announce personal income tax cuts in this years' Budget.
Across the Tasman, March net migration in New Zealand rose by 5.5k. Net migration has been easing back since mid-2017 and in annual terms, it is now just under 68k. While that is still strong, it is the lowest level in two years. Our economics team in NZ also put out a piece this week on their not so dissimilar inflation outlook.
Starting the week internationally, flash Markit manufacturing PMIs jumped to a 43 month high in the US but held fairly steady in Europe and Japan. Europe and Japan eased back through the first quarter of 2018, consistent with similar plateauing seen in other major Asian economies.
Over to central banks, the ECB held its policy stance and gave little away before their June 14 meeting which includes updates to their quarterly growth and inflation forecasts. The most interesting point from the press conference was Draghi's recount of member's discussion on current conditions. He noted that all countries (to different extents) reported some moderation in growth and that it was broad-based across sectors. Though this was unexpected, he emphasised that indicators are still above average and that the easing in momentum follows a period of strong growth. As such, they view the slowing as a normalisation but also acknowledge that temporary factors have played a part. All in all, Draghi described the ECB's view on recent data prints as "caution tempered by an unchanged confidence of the convergence of inflation to our inflation aim".
We also saw the Swedish Riksbank hold rates but surprise with a change in forward guidance. The Riksbank now expect to hike rates "towards the end of the year" as opposed to their previous statement of the "second half of this year".
As we go to publication, the BoJ policy hold came with little surprise and we are still awaiting US Q1 GDP and the Q1 ECI.
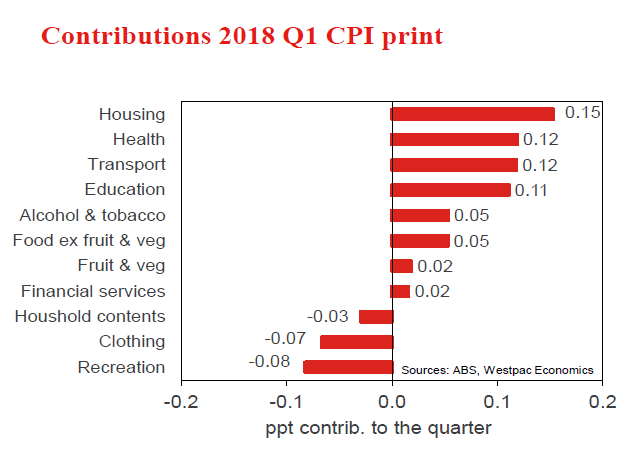
Chart of the week: CPI component contribution
So far in 2018 we struggle to find any broad inflationary pressure in the Australian economy. Core inflation is just at the bottom of the RBA's target band (held there by non-traded prices and in particular housing, health and education) and we can find little to suggest a risk of a dangerous acceleration. But nor can we find signs that the disinflationary pulse is widening suggesting we could see a significant dip in the rate of core inflation.
A number of sectors are stuck in a disinflationary or even deflationary cycle while the normal cyclical inflationary push you would expect at this point in the cycle is absent. Will analysts now over adjust their estimates for inflation for this and the next quarter we see an upwards surprise from inflation? It is possible but we feel it is an unlikely outcome.
New Zealand: week ahead & data wrap
In recent years, the combination of low interest rates and the favourable tax treatment of housing saw house prices rising rapidly. These same conditions also saw household debt rising to record levels. Now, with the housing market cooler than it was in previous years, the creep upwards in household debt has slowed. And over the coming years, policies aimed at dampening housing market pressures will put a brake on further debt accumulation. These changes also signal an important drag on households' spending, and will have an important impact on the RBNZ's policy stance.
Household debt levels in New Zealand have risen by 35% since 2012. That's roughly double the increase in incomes over the same period. As a result, households are now carrying debt that is equivalent to 168% of their annual disposable income - a level that's well above the peak of 159% that we saw just prior to the financial crisis.
As we've previously highlighted, the major contributor to the run up in household debt has been the low level of interest rates in recent years, and the related increases in house prices. With low interest rates generating low nominal returns on savings, investors have sought to diversify into housing and other assets. Combined with the favourable tax treatment of investment housing in New Zealand, this boosted the demand for housing assets and pushed house prices higher. Aspiring buyers have had to borrow more. In addition, as has historically been the case, strength in the housing market also saw homeowners spending some of the windfall they perceive when the value of their house rises. The net effect has been more borrowing and more spending, with the low cost of borrowing reinforcing both of these trends.
In recent years, this run up of household debt has raised concerns about the economy's longer-term financial stability. That includes concerns about the eventual drag on economic activity from increased debt servicing obligations, particularly if interest rates rise. In addition, higher debt levels mean that the economy is more vulnerable to unfavourable changes in economic or financial conditions, especially as such disruptions could be amplified through changes in the housing market. Such concerns are a key reason why the RBNZ introduced restrictions on high loan-tovalue (LVR) lending in recent years.
However, while debt levels are at historically high levels, the past year has actually seen debt accumulation slowing, and the ratio of household debt to income has been steady since the start of 2017. That follows the slowdown in house price inflation over the past year that came as a result of a tightening in lending restrictions by the RBNZ, as well as an increase in mortgage rates in early 2017.
In recent months, the housing market has firmed again as borrowing restrictions have been eased and mortgage rates have pushed down again. At the same time, mortgage borrowing has picked up a little. However, as we discussed in our recent Home Truths report1, we expect this resurgence will be short lived. The Government plans to roll out a series of policies aimed at dampening housing market conditions. That includes policies affecting physical demand and supply, such as restrictions on foreign buyers, a tightening in migration settings, and efforts to increase the housing stock (such as the KiwiBuild program).
More important, however, are a range of policies that will affect the financial incentives associated with property investment. The Government has already extended the holding period for taxing capital gains on investment properties from two to five years (the so-called 'bright line' test). Over the coming years we also expect the ability to use losses on rental properties to offset other tax obligations (i.e. negative gearing) will be significantly curtailed. Finally, there is the possibility that the government will look at introducing a broad-based capital gains tax if elected to a second term in office.
This wide reaching suite of policies will significantly dampen the demand for housing, especially by investors. Consequently, we expect that the nationwide level of house prices will fall by a total of 2% over the next four years.
The slowdown in the demand for housing will also put the brakes on debt accumulation, with debt to income levels expected to remain broadly stable over the next few years. This will have important implications for the Reserve Bank's choice of policy settings, potentially allowing for a further loosening of LVR lending restrictions. A slowdown in the housing market will also be important for monetary policy and the level of the Official Cash Rate. As discussed below, the slowdown in the housing market will have a more general dampening impact on economic activity, removing any need for the RBNZ to hike the OCR in the near term.
New Zealanders hold a significant proportion of their wealth in either investment or owner-occupied housing. As a result, we expect that the coming slowdown in the housing market will also see softness in household spending growth. This is likely to be reinforced by associated changes in the access to credit. The strong housing demand that encouraged the build-up of debt in recent years also pushed up house prices. That flattered household debt positions, with debt-to-asset ratios falling. However, the stalling in the housing market over the past year has seen debt-to asset positions rising modestly. And with further housing market softness expected, such gauges of the economy's financial health could deteriorate further. In such circumstances, many borrowers could find their borrowing ability curtailed, while debt servicing requirements result in their disposable incomes being squeezed.
Policy changes also mean that the Government will be collecting more tax from rental properties over the coming years. This signals a further drag on households' disposable incomes and spending.
The run up in household debt in recent years and associated increases in financial vulnerabilities are important clouds on the horizon, but are unlikely to topple the economy. Despite the increase in debt levels, low interest rates mean that households' debt servicing costs remain modest: households currently spend an average of 8.3% of disposable incomes on debt servicing (well below the peak of 14% in 2009). On top of this, the labour market is in good health, and New Zealand hasn't had difficulties funding its current account deficit in recent years.
Data Previews
Aus Mar private credit
Apr 30, Last: 0.4%, WBC f/c: 0.4%
Mkt f/c: 0.4%, Range: 0.3% to 0.6%
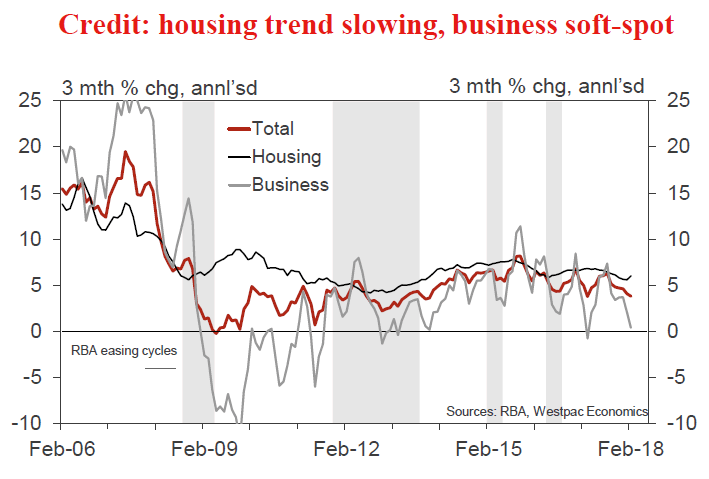
- Private sector credit is expanding at a modest pace as the housing sector cools. In 2017, credit grew by 4.9%, slowing from 5.6% for 2016, with a Q4 average of 0.4% per month.
- For March, we expect a rise of 0.4%.
- Housing credit, at this late stage of the cycle, is slowing in response to tighter lending conditions. The 3 month annualised pace was 5.6% in January, down from 6.8% last March. However, in February, a surprise uptick - most likely noise - saw the 3 month pace rebound to 6.0%.
- Business credit, up 3.6% over the year, is volatile around a modest uptrend as businesses increase investment in the real economy. Over the past three months, business credit hit a soft spot, with outcomes of +0.1%, -0.1% and +0.1%. On balance, current fundamentals are positive pointing to a resumption of the modest uptrend.
Aus Apr CoreLogic home value index
May 1, Last: -0.2%, WBC f/c: -0.2%
- Australia's housing market continue to see price slippage in early 2018, the CoreLogic home value index dipping another 0.2% in March to be down 1.4% from its Oct peak.
- The detail shows more pronounced weakness in Sydney, for houses as opposed to units, and for the top 25% of properties by value.
- The daily index points to a further 0.2% decline in April that will take annual growth down to -0.3%yr, the first negative since 2012.
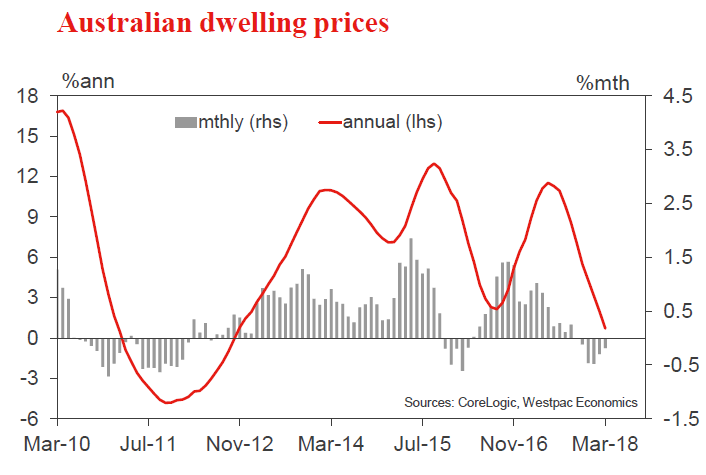
Aus RBA policy announcement
May 1, Last: 1.50%, WBC f/c: 1.50%
Mkt f/c: 1.50%, Range: 1.50% to 1.50%
- The RBA Board will leave rates unchanged at their May meeting, as they have since they cut rates in August 2016.
- The Governor has stated that: "further progress in reducing unemployment and having inflation return to target is expected, although this progress is likely to be gradual".
- The case for patience has been reinforced by recent data. Notably, inflation remained subdued in Q1 at 0.4%qtr, 1.9%yr. The jobs hiring boom of 2017, +3.4%yr, has given way to a consolidation in Q1, 1.9% annualised, and the unemployment rate has stalled at 5.5% after declining early in 2017.
- The RBA will likely trim their 2018 GDP growth forecast in the Statement on Monetary Policy to a still above trend 3.0%, rounded down from 3.25% previously.
- We expect GDP growth to be less robust, at 2.75% this year, slowing to 2.5% in 2019 and anticipate that the RBA will keep the cash rate unchanged at 1.5% in 2018 and 2019.
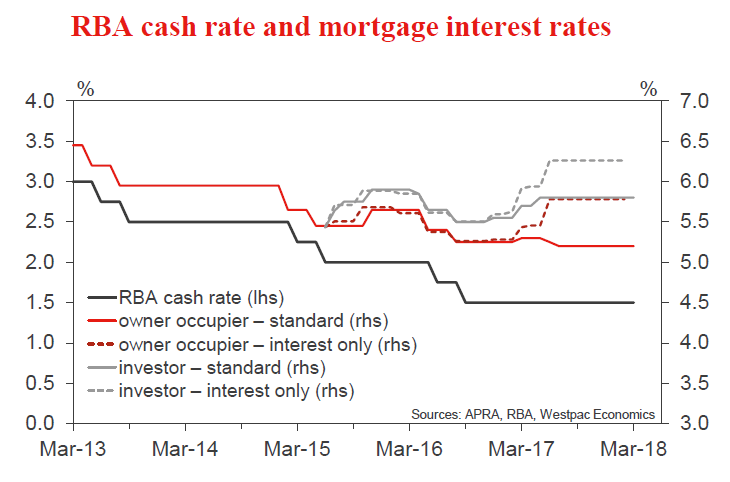
Aus Mar dwelling approvals
May 3, Last: -6.2%, WBC f/c: 1.0%
Mkt f/c: 1.0%, Range: -3.0% to 5.0%
- Dwelling approvals retraced 6.2% in Feb, giving back about two fifths of the 17.2% jump in Jan. Approvals have been extremely volatile month to month, making it difficult to pick out clear trends. Volatility has again centred on 'high rise' approvals.
- Construction-related housing finance approvals have softened since Sep after rallying through most of 2017. Given lags between finance and construction, that suggests non high rise dwelling approvals will fall away a bit in coming months.
- High rise is harder to call. The general picture from site purchases over the last year points to the segment taking another leg lower in 2018 although the month to month moves look to have overshot a little in Feb.
- On balance we expect total approvals to be up 1% in March.
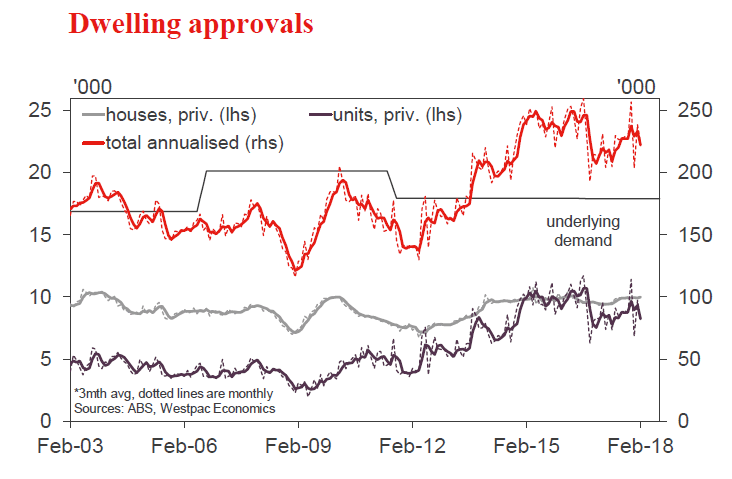
Aus Mar trade balance, AUDbn
May 3, Last: 0.8, WBC f/c: 0.2
Mkt f/c: 0.95, Range: -0.5 to 1.3
- For March, Australia's trade surplus is expected to narrow to $0.2bn from $0.8bn, led lower by exports.
- Export earnings are forecast to contract by 1.0% in March, down $350mn. The key negative, the iron ore spot price retreated from recent highs, declining to US$70/t from $76.50.
- The import bill rose a forecast 0.8% in the month, +$250mn. The cost of imports increased as the currency weakened, down around 1.5% to 76.7US¢ from 78.8US¢.
- Focusing on the March quarter, the trade balance improved to a surplus of $2.0bn, a turnaround from a deficit of $0.7bn in Q4 - based on our forecast and subject to revisions. The improvement was centred on a rise in the terms of trade associated with higher commodity prices (on a quarter average basis).
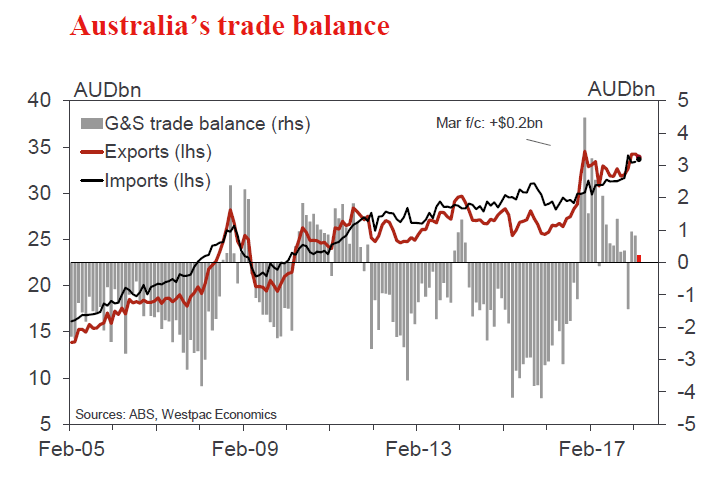
NZ April ANZ business confidence
April 30, Last: -20
- Business confidence treaded water in March, after bouncing off its post-election lows in back in February.
- While the economic backdrop has been steady over the last month, the Government did surprise some with the timing of its announcement to end offshore oil exploration permits. But it's an open question whether this will have an impact on broader business sentiment.
- March quarter CPI came out in line with expectations, but this did see the annual inflation rate drop fairly sharply to 1.1%. This could put downward modest pressure on the inflation expectations components of the survey, which were little changed in March.
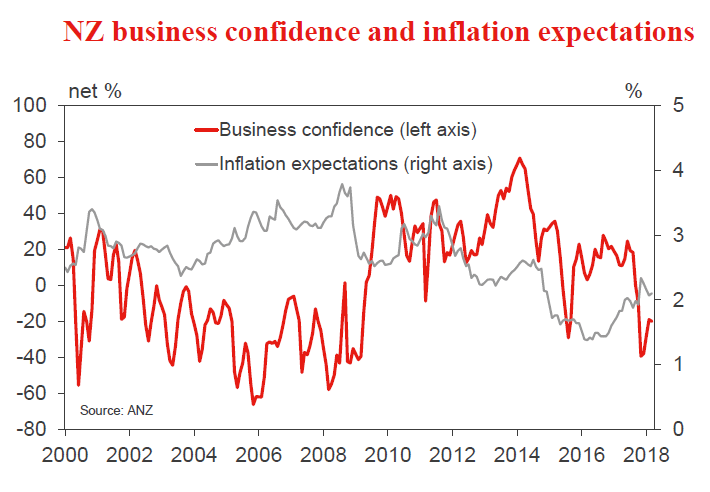
NZ Mar residential building consents
May 1, Last: 5.7%, WBC f/c: 1.6%
- Residential building consent issuance rose 5.7% in February after a flat outturn in the previous month. The solid lift in consent issuance was driven by a pickup in issuance for multiple dwelling/apartments.
- While strong population growth signals the need for a protracted period of rapid home building, we expect construction activity to rise at a gradual pace. Construction firms are highlighting shortages of skilled labour and difficulties with financing as important brakes on the pace of building.
- We'll be watching the regional breakdown of consents closely. Despite a large and growing shortage of homes, building levels in Auckland have flattened off in recent months. We're also seeing a trend decline in Canterbury as the region's housing market continues its gradual postearthquake transition.
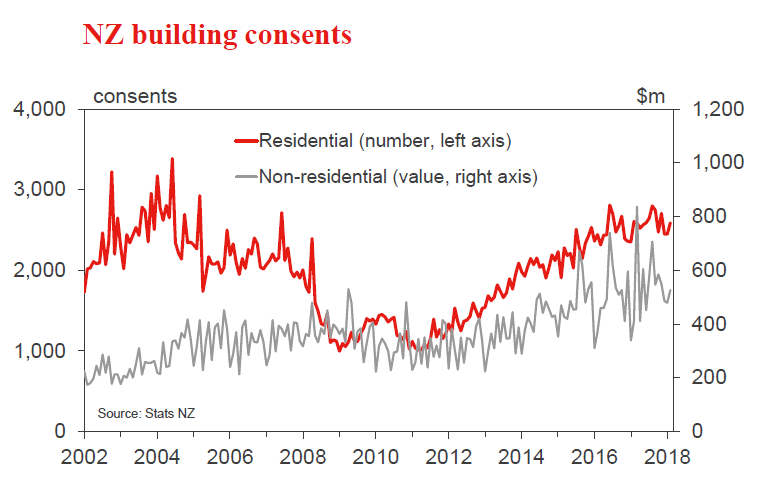
NZ Q1 Household Labour Force Survey
May 2, Employment last: 0.5%, WBC f/c: 0.3%, Mkt f/c: 0.6%
May 2, Unemployment last: 4.5%, WBC f/c: 4.5%, Mkt f/c: 4.4%
- We expect a subdued 0.3% rise in employment over the March quarter, and an unchanged unemployment rate of 4.5%.
- There are signs that the improving trend in the labour market has become bogged down more recently. Slower economic growth and uncertainty around government policy have weighed on firms' hiring decisions.
- Our estimates suggest that labour market conditions are currently 'neutral' in terms of their influence on inflation pressures. And with economic growth past its peak, we think that the labour market will struggle to push very far into 'tight' territory.
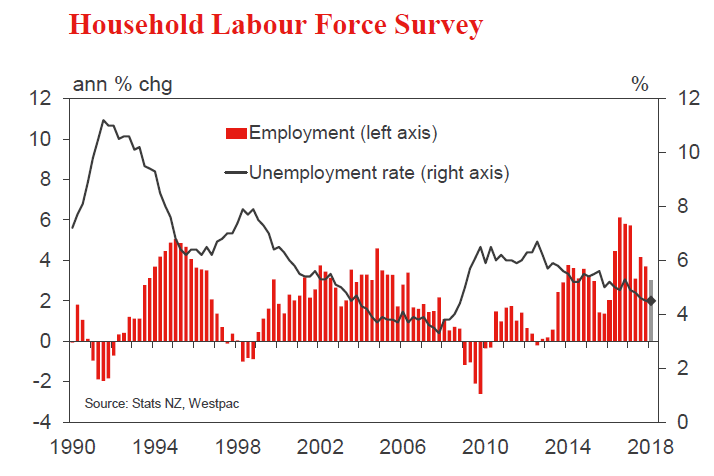
NZ Q1 Labour Cost Index
May 2, Private sector last: 0.4%, WBC f/c: 0.4%, Mkt f/c: 0.5%
- We expect a 0.4% rise in private sector labour costs for the March quarter. This is essentially the same quarterly pace that we have seen for the last few years, with the exception of the aged-care workers' pay settlement in Q3 last year.
- We do expect a modest pickup in wage growth over the next couple of years, on a combination of a tighter labour market, collective pay agreements and minimum wage hikes. But the case for a near-term pickup is weak. CPI inflation has ebbed lower over the last year, and the labour market is not currently tight enough to warrant much more than cost-of-living increases in wages.
- In contrast, the Quarterly Employment Survey (QES) measure of average hourly earnings has accelerated, and we expect a further pickup. But this appears to be payback from a sharp slowdown a year ago.
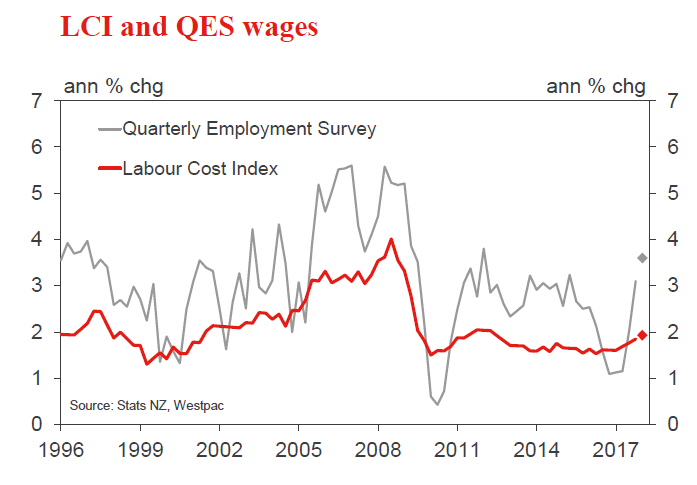
Euro Area Q1 GDP
May 2, Last 0.6%, WBC 0.5%
- The Euro Area has likely seen peak growth for this cycle, with growth in 2018 expected to come in at 2.1%yr versus 2.5%yr in 2017. The main driver of this slowdown is expected to be the abating of pent-up consumer demand that has been a key support in recent years.
- The consumer continues to benefit from job and credit availability, but their savings are limited and wage growth continues to lag momentum in activity by a wide margin. There is therefore a definite limit to their appetite for credit, and hence their discretionary spending.
- In this domestic environment, and given lingering global uncertainty, business investment growth is unlikely to accelerate to offset weaker consumption. Growth will slow progressively. Hence to our Q1 forecast of 0.5%, risks are skewed to the downside.
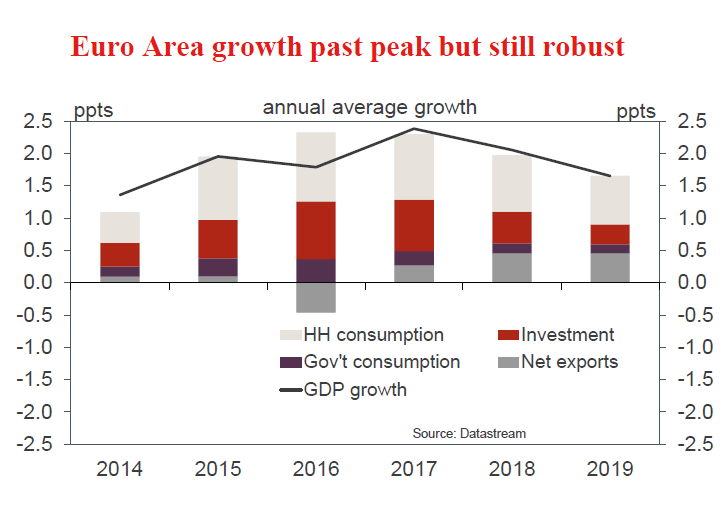
US FOMC May policy meeting
May 2, Last 1.625%, WBC 1.625%
- The FOMC has made clear their intentions for 2018 - repeatedly. If growth continues as it has and inflation also firms to target, then they will have strong justification to continue with their 'gradual' normalisation of the fed funds rate and balance sheet reduction.
- Indeed, from Chair Powell's recent comments and the March meeting minutes, the Committee clearly believe that risks to the outlook are skewed to the upside, thanks to the enacted tax and spending reform.
- For us, we have little doubt that government spending and business investment will drive growth higher in the near term, but inflation is unlikely to materially exceed target. We also expect that tighter financial conditions will shock growth later in 2019. Our core view therefore remains two more rate hikes in 2018 and two more in H1 2019, but then no more.
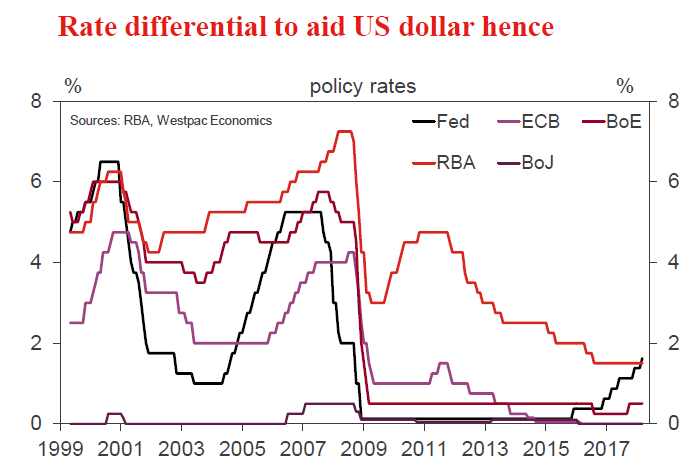
US Apr employment report
May 4, nonfarm payrolls, last 103k, WBC 180k
May 4, unemployment rate, last 4.1%, WBC 4.0%
- The Mar report delivered a surprise for many in financial markets, with not only the monthly gain for payrolls coming in well below consensus at 103k, but also a further 50k taken from Jan and Feb's gains.
- While the monthly loss of momentum was severe, the 2018 average has only been brought back into line with that of 2017. Hence, overall momentum is still very strong. Come April, another robust gain is anticipated circa 180k. There is also a risk of upward revisions to the prior number.
- As we move through 2018, the pace of employment growth will slow but still likely exceed 100k, seeing the unemployment rate move lower.
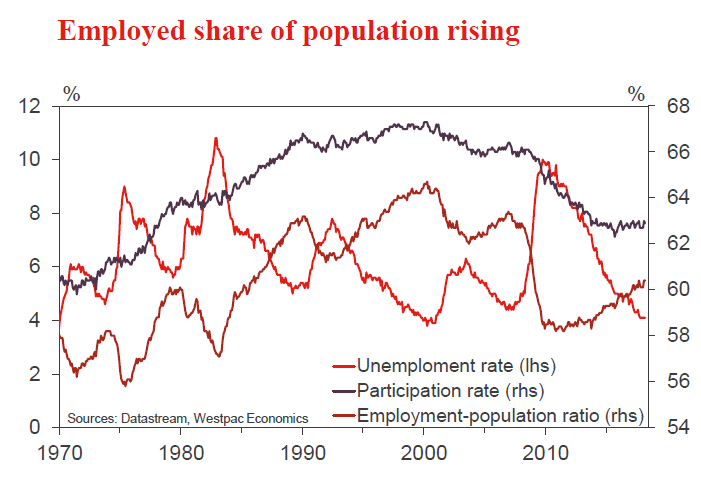
U.S. GDP: As Expected, First Quarter Slowdown – But Modest
First quarter 2018 GDP came in at 2.3 percent, an expected slowdown but less than feared given persistent seasonality issues. Consumer spending and business investment were slower and inflation continues to rise.
Real Final Sales: Q1 Slowdown—But Modest by Expectations
Real private final sales came in at 1.9 percent (2.7 percent year over year, top graph) with gains in consumer and business spending. Overall GDP came in at 2.9 percent year over year compared to 2.0 percent for Q1 2017— clearly a nice improvement. We expect GDP growth of 2.6 percent in 2018 compared to 2.3 percent in 2017.
Real consumer spending increased at a 1.1 percent annual pace in Q1, below the recent trend. The slowdown reflected a decline in durables spending, including motor vehicles which, in turn, may reflect the impact of hurricane recovery spending in the fourth quarter. Continued gains in consumer spending are expected given improvement in the labor market, compensation, consumer confidence and household wealth. For 2018, we estimate consumer spending to be up 2.5 percent.
Residential construction was flat, but government spending, both federal and state & local, contributed to growth. Residential investment is facing some headwinds as interest rates and land prices increase. Despite the notso- stellar growth in housing starts, demand for apartments remains strong.
Trade reflected an improvement in export growth compared to a year ago and was a net addition to GDP in the quarter. For 2018, however, we expect trade to subtract from GDP. Inventories also positively contributed to GDP in the first quarter and are more in line with the gains in final sales—we expect inventories to add to GDP for all of 2018.
Capital Investment: Now and Over the Cycles
To achieve improved economic growth at 3 percent, the economy needs better equipment with better trained workers. Business fixed investment rose 4.7 percent while structures improved 12.3 percent—and are up year over year. This is a good sign for growth. As illustrated in the middle graph, the pace of capital investment has moderated as a share of GDP since the early 1980s. This is consistent with a moderation in productivity gains. Over the past three quarters, however, we have seen gains in spending on information processing, industrial and intellectual property segments.
Inflation: Rising—So Will the Fed Funds Rate
Overall GDP inflation came in at 2.0 percent in the fourth quarter while the core PCE deflator, the Fed's benchmark, was up 2.5 percent compared to just 1.8 percent a year ago. Services are the culprit here, with a gain of 3.1 percent compared to 2.0 percent in Q1 2017. Services inflation has outpaced goods inflation throughout the 2015-2017 period.
Rising inflation and continued moderate economic growth provide the basis for a FOMC decision to raise the funds rate in June. Our outlook is also for rising 2- and 5-year Treasury rates in response. Our model is for a flatter yield curve for this year.