Sample Category Title
Sunset Market Commentary
Markets:
Global core bonds initially thrived on yesterday’s momentum generated by the ECB meeting. President Draghi confirmed recent comments, suggesting that the EMU growth peak is behind us. The ECB’s sidelined stance in order to find out whether the setback is permanent, indicates little haste to announce changes to its forward guidance/policy (only in July?). EMU eco data printed mixed with disappointing Q1 French GDP, but decent EC EMU confidence data. Trading slowed to a trickle going into Q1 US GDP (2.3% Q/Qa vs 2.1% Q/Qa). Core PCE rose to 2.5% Q/Qa from 1.9% Q/Qa and caught investors’ attention while being in line with forecast. The US Note future temporary lost some ground. Monday’s March PCE deflators (both headline & core) are expected to print both above 2% for the time in over six years. The Fed might acknowledge this development by upgrading the inflation assessment in the policy statement. We think that US yields will test key resistance levels next week. The US yield curve flattens with yield changes ranging between +0.6 bps (2-yr) and -2.6 bps (30-yr). The German yield curve bull flattens with yields 1 bp (2-yr) to 2 bps (30-yr) lower. 10-yr yield spread changes vs Germany are close to unchanged.
EUR/USD and USD/JPY extended yesterday’s trading pattern. The dollar maintained the benefit of the doubt. The euro remained in the defensive. European data were mixed, but at least not strong enough to restore confidence in the euro after yesterday’s breach of EUR/USD 1.2155. At the same time, US GDP was not too bad. The report was no Grand-Cru, but slightly above consensus. ST interest rate differentials widened further in favour of the dollar. EUR/USD touched a new ST correction low after the US GDP release, but for now there are no additional follow-through gains. EUR/USD trades in the 1.2080 area. USD/JPY hovers in the lower half of the 109 big figure, holding the relatively tight range that is in place since Wednesday evening. Even so, the technical picture for the dollar improved this week, with both EUR/USD and the trade-weighted dollar clearing technically relevant levels.
Sterling performed rather well over the previous days despite mixed eco data and as governor Carney sounded less convinced that the BoE should raise rates at the May meeting. EUR/GBP returned below the 0.87 handle yesterday /this morning. However, sterling bulls then could no longer ignore the bad news. The estimate of UK Q1 growth printed at only 0.1% M/M and 1.2% Y/Y (vs 0.3% M/M & 1.4% Y/Y consensus), down from an already mediocre 0.4% Q/Q in Q4. The harsh winter weather was partially to blame, but the ONS indicated that other factors were also at work, suggesting a sluggish underlying performance of the UK economy at the start of the new year. Poor Q1 growth evidently raised further doubts on the preparedness of the BoE to raise rates at the May meeting. Sterling fell off a cliff. EUR/GBP jumped to the 0.8785 area (currently 0.8775). Cable was in free-fall and dropped from the 1.3935 area to touch an intraday low below 1.3750. We look out whether EUR/GBP will regain the 0.88 mark. IF so, it would be an additional technical warning for sterling.
News Headlines:
EMU inflation could rise slower than earlier thought but growth may stay resilient to the recent slowdown, the ECB's Survey of Professional Forecasters showed, underpinning the bank's call for patience in removing stimulus.
US growth in the first quarter (2.3% annualized) slightly topped expectations of 2%. Growth was mainly driven by private investment and exports whereas private consumption (1.1% Q/Qa) contributed only marginally.
US Real GDP: Business Investment and Exports Drive a Better-than-Expected Start to the Year
The American economy got off to a better-than-expected start in 2018, advancing 2.3% (annualized) in Q1. While the outturn sounds fairly modest, we had expected residual seasonality to exert greater downward pressure on first quarter growth, and the number exceeded expectations.
Still, residual seasonality appeared to be a factor in consumer spending, which advanced only 1.1% in Q1, as expected. The first quarter pause in spending came after a 4% jump in Q4, which was boosted by post-hurricane related re-stocking activity.
On a more positive note, business investment rose 7.3%, slightly stronger than anticipated. The outperformance was due to a 12.3% jump in investment in nonresidential structures investment. While most sub-categories were up in Q1, investment in mining exploration, shafts and wells (which includes the shale oil industry) was up 38% annualized in the quarter, as higher oil prices drove drilling activity. Investment in equipment (+4.7%) and intellectual property (+3.6%) were in line with expectations.
Another source of positive growth surprise was exports, which rose 4.8% in Q1. Imports rose a more modest 2.6%, which meant net exports boosted growth 0.2 percentage points in Q1.
Residential investment was flat in Q1, as the housing sector took a breather after hurricane-related rebuilding boosted activity 12.8% in Q4.
Inventory investment added 0.4 percentage points to growth, reversing the drag in Q4.
Key Implications
The U.S. economy carried more momentum into the first quarter than we had expected, driven by healthy investment in the oil and gas sector and strength in exports. Meanwhile, residual seasonality appears to have been a factor for consumers as spending took a breather from a hot pace of spending at the end of 2017. We expect consumers will be back in action in the second quarter. Smoothing out the quarter-to-quarter swings, the U.S. economy ran at a very healthy 2.9% pace year-on-year in the first quarter. We expect the fiscal stimulus that is just getting going to lift that trend to 3.0% by the end of the year.
The Fed already knew that the economy had healthy momentum to start 2018, but Q1's better-than expected outturn probably puts some upside risk to their outlook. The fact that much of the upside surprise came from the volatile oil and gas sector may raise concerns about the sustainability of the heady pace of investment spending. Our outlook for two more Fed hikes this year, continues to have more upside than downside risk to it and today's GDP result only shifts those risks very slightly at the margin.
U.S. GDP growth slowed only modestly in Q1
Highlights:
- US Q1 GDP rose 2.3% — the softest in 4 quarters but above market expectations for a 2.0% gain and still a solidly ‘above-potential’ pace.
- Consumer spending growth slowed but following an outsized gain in Q4.
- Price growth showed further signs of firming. The core PCE deflator was up 1.7% on a year-over-year basis but jumped 2.5% (annualized) from Q4.
Our Take:
The 2.3% rise in Q1 GDP was still the slowest of the last 4 quarters but was slightly ahead of market expectations and above the 1.8% the Federal Reserve’s estimates as the long-run underlying ’trend’ rate. Business investment rose a solid 6.1%, its eight straight quarterly gain. Net exports also added modestly to growth after subtracting more than a percent from the Q4 GDP growth rate. Consumer spending was the main offset with just a 1.1% increase. That’s less disappointing, though, following the unsustainably strong 4.0% surge in Q4. Job growth has remained solid, on balance, and wages have been drifting higher. Along with tax cuts and still low interest rates, that leaves little reason for concern about underlying household income/spending trends.
Indeed, there has been little reason for concern about the strength of the U.S. economy for a while, with most indicator suggesting activity is already running at or beyond long-run capacity limits — and yet growth still running at an ‘above-potential’ pace. Perhaps the more important data point from the Q1 GDP release was a 2.5% (annualized) jump in the core PCE deflator from Q4. The year-over-year rate still averaged just 1.7% for Q1 as a whole but year-over-year rates have been biased lower by a big drop in telecom prices last March. The monthly price deflator numbers for March will be released next Monday and we expect will show the PCE deflator ticking up close-to or at the Fed’s 2% inflation objective after rising closer to 11/2% in January and February. The economy clearly looks strong enough to warrant a continuation of the current gradual rate hiking cycle.
U.K. Q1 GDP Growth Disappoints, BoE to Remain on Hold
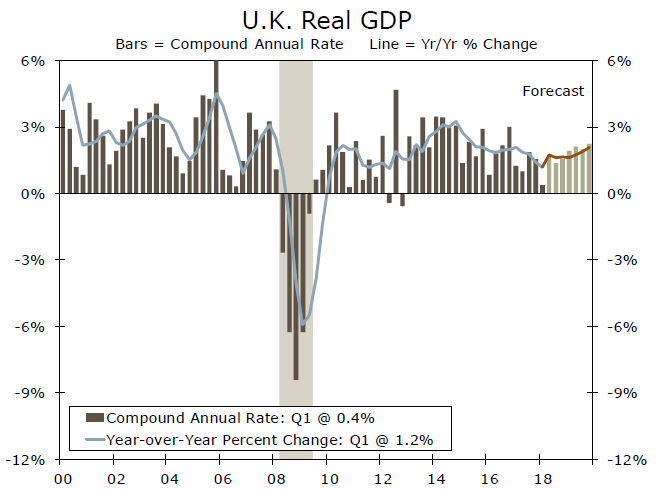
GDP in the United Kingdom grew just 0.1 percent in Q1, with today's print significantly weaker than consensus expectations. While growth should eventually pick up, we now look for the BoE to remain on hold until August.
Q1 GDP Growth Significantly Weaker Than Expected
Preliminary data released today showed that real GDP in the U.K. grew just 0.1 percent in Q1 (0.4 percent on an annualized basis) relative to the previous quarter (top chart). Today's print was significantly weaker than expected, with the consensus expecting a 0.3 percent increase. Although details on underlying demand components are not available at this time, monthly indicators point to the mixed nature of the U.K.'s economic expansion in the aftermath of the Brexit Referendum in 2016. While some of the Q1 weakness may be due to bad winter weather, the slower overall pace of growth raises questions about the underlying health of the British economy.
Production Drives Growth, Yet Consumer Spending Likely Weak Data included in today's release showed that industrial production rose 0.7 percent in Q1, driven by surging output in the mining sector, up 3.5 percent. Although overall industrial production was largely positive in Q1, output in the construction sector dropped sharply, down 3.3 percent.
While industrial production was a bright spot, the demand side of the equation was likely more mixed. The services sector expanded only 0.3 percent in Q1, and as most services are consumed domestically, the pace of consumer spending growth likely remained slow. Consumer spending, as measured by real retail sales, remains lackluster even as the labor market has tightened. Monthly real retail sales growth averaged just 1.5 percent year over year in Q1, compared to 2.6 percent in Q1-2017 and 4.1 percent in Q1-2016. At the same time, the unemployment rate hit a 42-year low of 4.2 percent in March, and nominal wage growth has also picked up, with average weekly earnings up 2.8 percent in February, year over year.
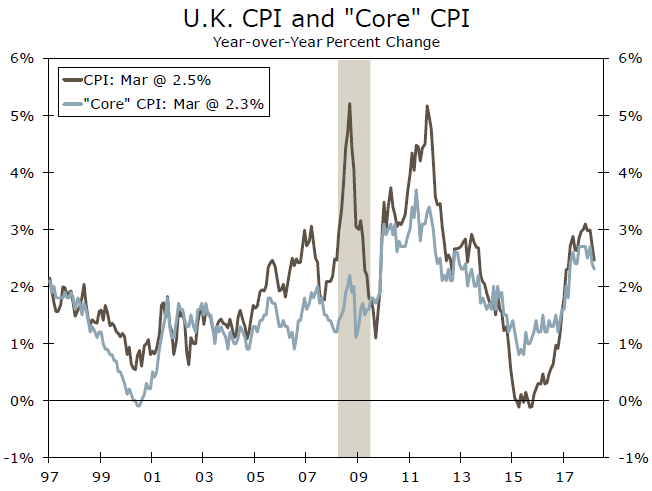
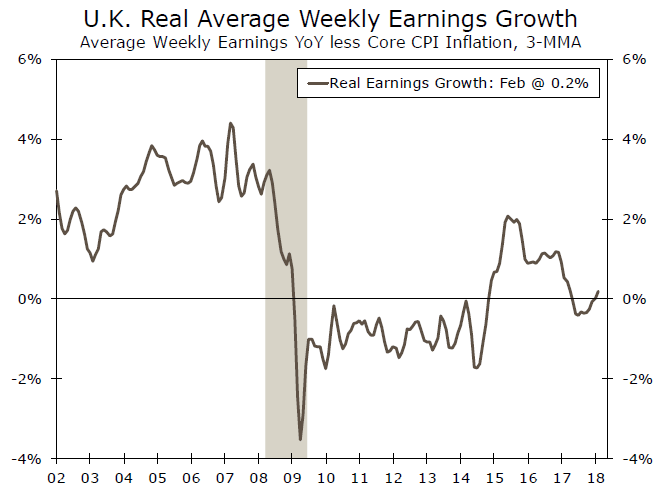
Slower growth in consumer spending likely stems from slower real wage growth even as nominal wages have increased. Real wage growth stagnated in the wake of Brexit as sterling depreciated sharply and drove consumer price inflation above 3 percent by mid-2017. But, inflation fell to 2.5 percent year over year in March (middle chart), and real wages are beginning to show signs of recovering (bottom chart). We look for inflation to continue to recede, which should lift growth in real income and consumer spending.
BoE Likely to Adopt A "Wait and See" Approach
In light of today's weaker-than-expected GDP print, we now look for the Bank of England (BoE) to remain on hold until August, rather than hiking rates at its May 10 meeting. The BoE will likely adopt a "wait and see" approach to examine incoming economic data in the coming months before tightening policy. We look for economic growth to eventually pick up as inflation continues to recede and real wage growth recovers. Stronger growth in the coming quarters should support further rate hikes from the BoE, albeit at a gradual pace.
Soft British GDP Sends Pound Plunging
The British pound has posted sharp losses in the Friday session. Currently, GBP/USD is trading at 1.3767, down 1.08% on the day. On the release front, there are key events on both sides of the pond. British Preliminary GDP for the first quarter posted a weak gain of 0.1% in the first quarter, missing the estimate of 0.3%. Later in the day, BoE Governor Mark Carney speaks at an event in London.We’ll also get a look at economic performance in the US, with the release of Advance GDP for the first quarter. The estimate stands at 2.0%. The US will also release UoM Consumer Sentiment, which is expected to drop to 98.0 points.
The streaking dollar has steamrolled the pound, which has fallen to its lowest level since late February. The pound has endured a miserable two weeks, losing 3.3% since April 16. Aside from the disappointing British GDP report, the dollar has received a strong boost from higher yields on US bonds, which hit 4-year highs this week. On Wednesday, 10-year US Treasury notes climbed above the symbolic level of 3.0%, which led to investors snapping up bonds at the expense of equities. As oil prices have been moving higher, this has led to expectations of higher inflation, which in turn, has increased sentiment that the Federal Reserve will increase rates four times in 2018, rather than three hikes. This has made the US dollar more attractive to investors.
One of the most thorny issues surrounding Brexit is the Northern Ireland border. Ireland is a member of the European Union and would like to avoid a hard border with the north. However, once Britain leaves the UK, there will have to be some type of border controls between Ireland and Northern Ireland. So far, no satisfactory solution has been found. On Wednesday, Brexit Secretary David Davis said that a solution isn’t needed until the end of the transition period, which concludes in January 2021, since the UK will remain in the single market until that date. What happens after that? Davis would like to see the UK reach a comprehensive trade deal with the EU and a frictionless border, but Brussels may not be interested, with European leaders still smarting over Britain’s exit. Any scenario, called the “backstop plan”, envisions some time of “harmonization” of trade rules between Northern Ireland and the EU. However, the May government has continually expressed opposition to such a plan, so a solution will likely remain elusive until the clock forces the sides to show more flexibility.
GBP/JPY Mid-Day Outlook
Daily Pivots: (S1) 151.74; (P) 152.23; (R1) 152.55; More...
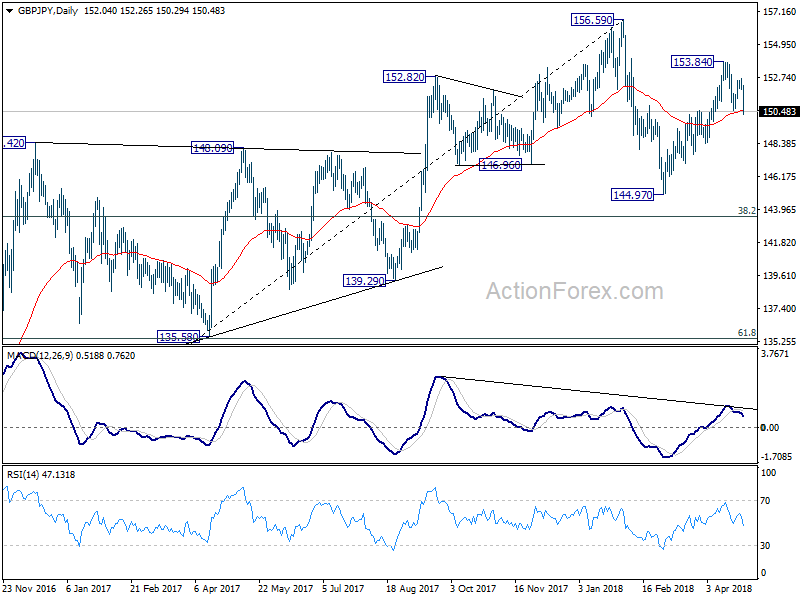
GBP/JPY's sharp decline and break of 150.60 support indicate resumption of fall from 153.84. Intraday bias is back on the downside for 148 .37 support first. Break will bring retest of 144.97 low. On the upside, break of 152.71 resistance is needed to indicate completion of the decline. Otherwise, near term outlook will remain cautiously bearish in case of recovery.
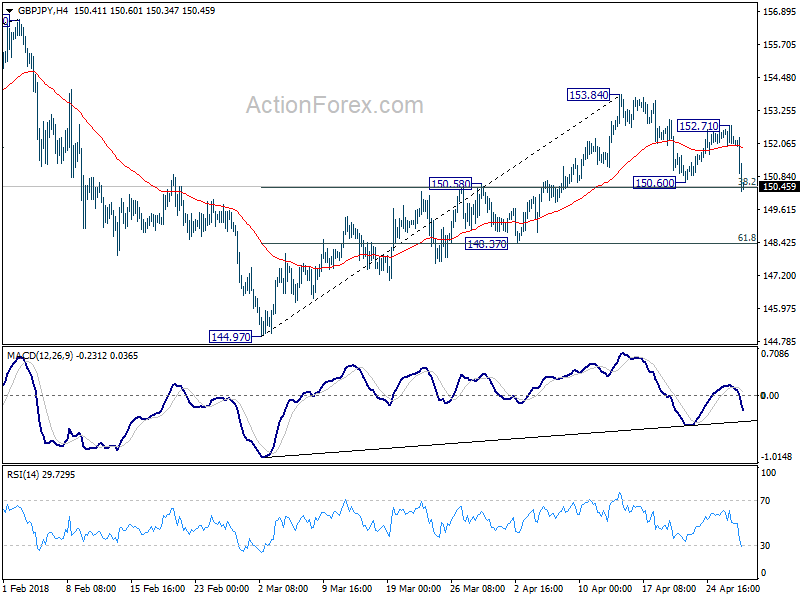
In the bigger picture, price actions from 156.59 are viewed as a corrective pattern. For now, we'd expect at least one more fall for 38.2% retracement of 122.36 to 156.59 at 143.51 before the consolidation completed. Though, firm break of 156.59 will resume whole up trend from 122.36 (2016 low) to 50% retracement of 195.86 (2015high) to 122.36 at 159.11 next.
EUR/JPY Mid-Day Outlook
Daily Pivots: (S1) 131.97; (P) 132.60; (R1) 132.93; More....
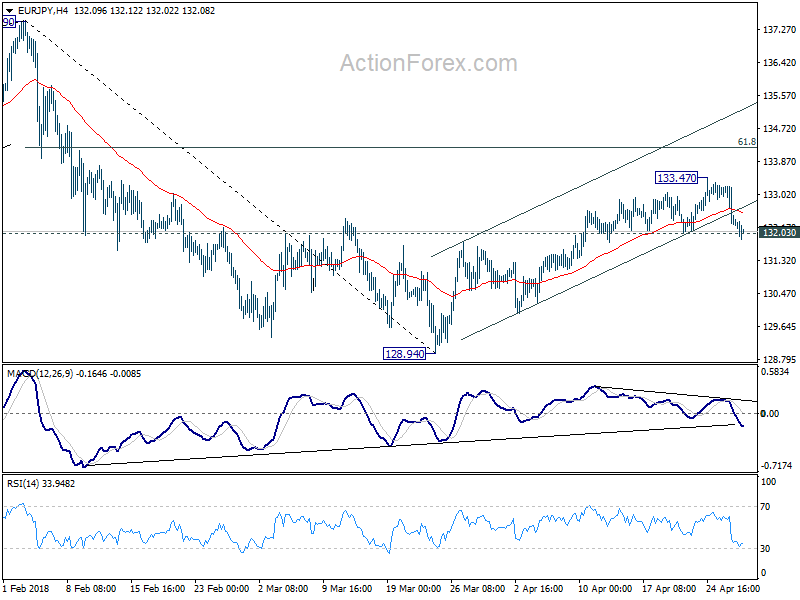
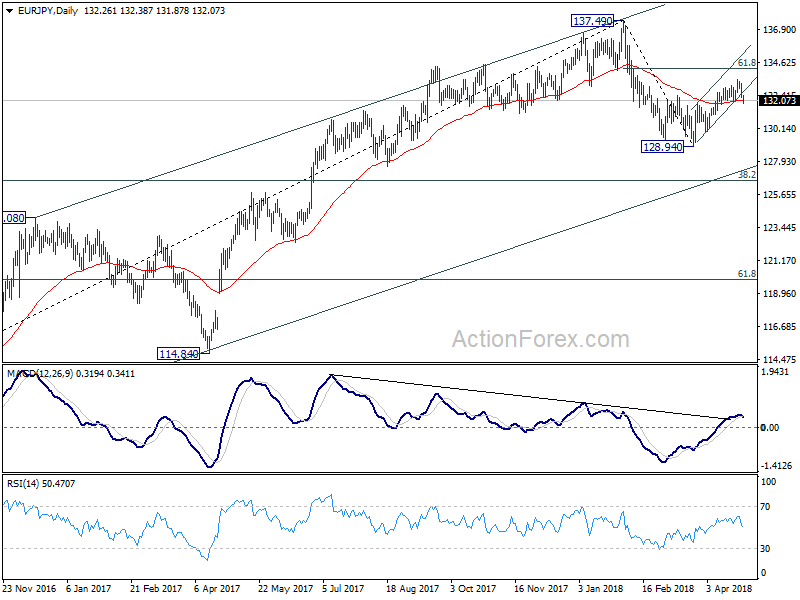
EUR/JPY break of 132.03 minor support suggests that corrective rise from 128.94 has completed at 133.47 already, on bearish divergence condition in 4 hour MACD. Intraday bias is turned back to the downside for retesting 128.94 low first. Break will resume whole decline3 from 137.49. In case of another rise, we expect strong resistance from 61.8% retracement of 137.49 to 128.94 at 134.22 to limit upside and bring fall resumption eventually.
In the bigger picture, price action from 137.49 medium term top are developing into a corrective pattern. Strong support from 55 week EMA (now at 129.91) suggests that the first leg has completed at 128.94 already. Nonetheless, break of 137.49 is needed to confirm resumption of the rise from 109.03 (2016 low). Otherwise, we'd expect more corrective range trading, with risk of another fall to 38.2% retracement of 109.03 to 137.49 at 126.61 before completion.
EUR/GBP Mid-Day Outlook
Daily Pivots: (S1) 0.8669; (P) 0.8709; (R1) 0.8739; More...
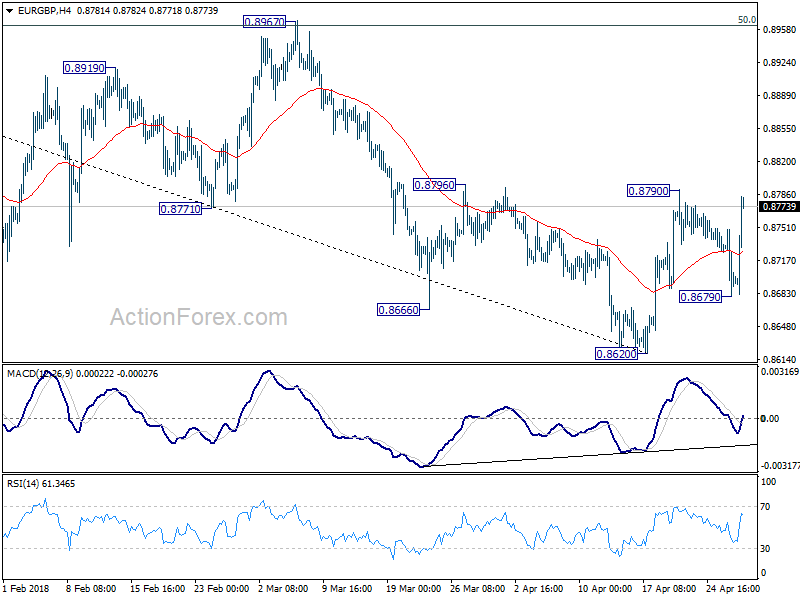
EUR/GBP's strong rebound today now put focus back to 0.8790 resistance. Break will resume the rebound from 0.8620, and revive the case of near term reversal. In that case, further rise should be seen to 0.8967 (50% retracement of 0.9305 to 0.8620 at 0.8963) next. On the downside, below 0.8679 will turn bias to the downside for 0.8620 instead.
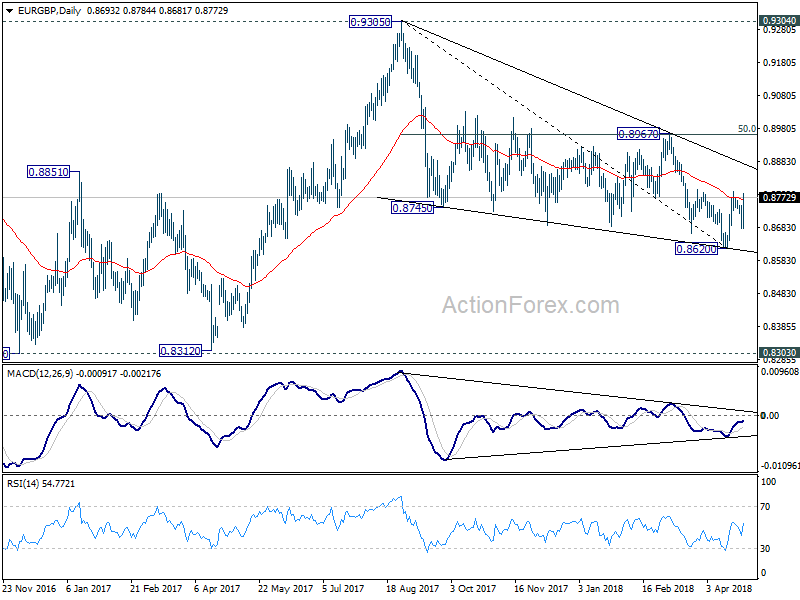
In the bigger picture, for now, the decline from 0.9305 is seen as a leg inside the long term consolidation pattern from 0.9304 (2016 high). Such consolidation pattern could extend further. Hence, in case of strong rally, we'd be cautious on strong resistance by 0.9304/5 to limit upside. Meanwhile, in another decline attempt, we'd expect strong support from 0.8116 cluster support (50% retracement of 0.6935 to 0.9304 at 0.8120) to contain downside.
EUR/USD Mid-Day Outlook
Daily Pivots: (S1) 1.2063; (P) 1.2136 (R1) 1.2176; More....
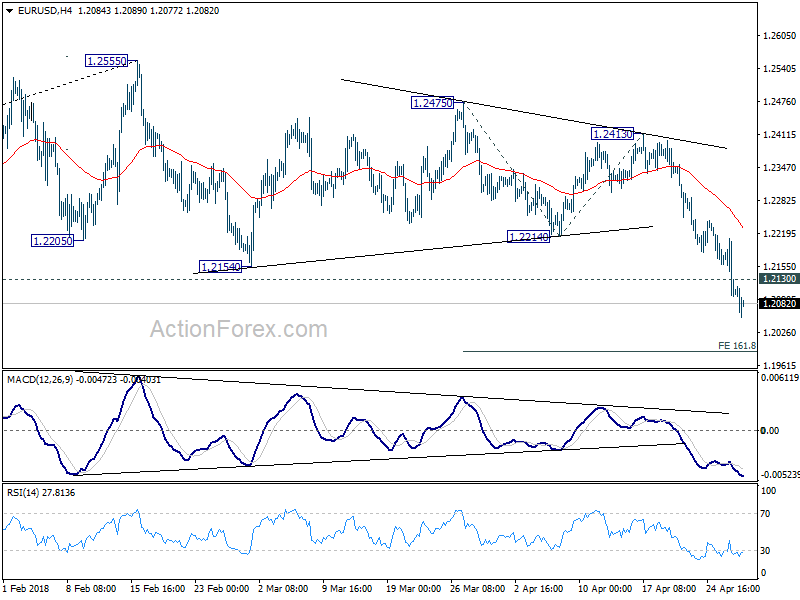
EUR/USD's decline extends today and reaches as low as 1.2054 so far. Intraday bias remains on the downside for for 161.8% projection of 1.2475 to 1.2214 from 1.2413 at 1.1991 first. Break will target 200% projection at 1.1891. On the upside, above 1.2130 minor resistance will turn intraday bias neutral and bring consolidation, before staging another decline.
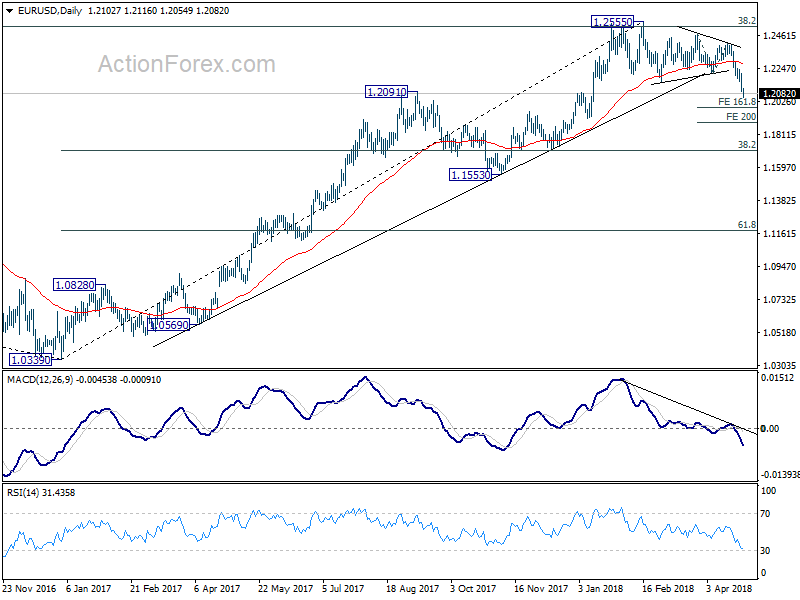
In the bigger picture, current decline and firm break of 1.2154 support confirms rejection by 38.2% retracement of 1.6039 (2008 high) to 1.0339 (2017 low) at 1.2516. A medium term top should be in place at 1.2555 and deeper decline would be seen back to 38.2% retracement of 1.0339 to 1.2555 at 1.1708 first. We'll look at the structure and momentum of such decline before decision if it's an impulsive or corrective move.
USD/CHF Mid-Day Outlook
Daily Pivots: (S1) 0.9840; (P) 0.9867; (R1) 0.9919; More...
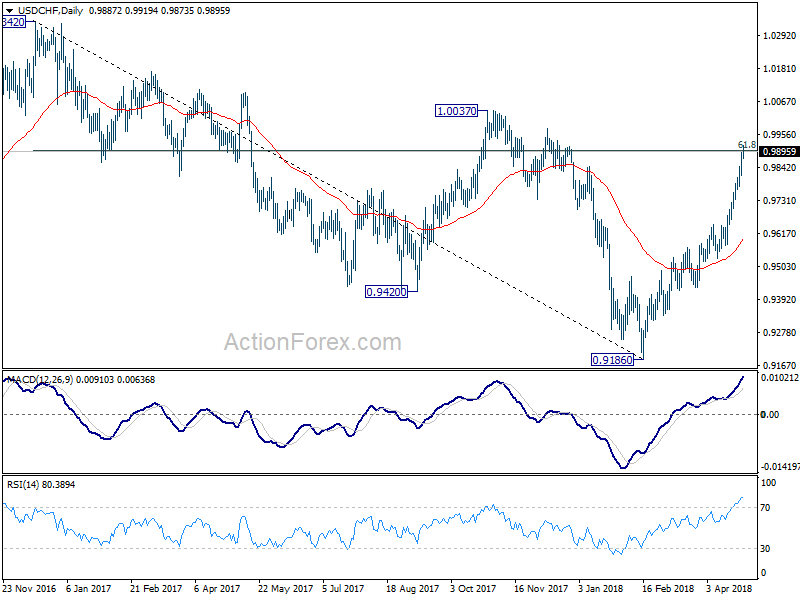
Intraday bias in USD/CHF remains on the upside for further rally. Sustained break of 0.9900 medium term fibonacci level will pave the way to 1.0037 resistance next. On the downside, below 0.9815 minor support will turn bias neutral and bring consolidations. But downside of retreat should be contained above 0.9648 resistance turned support to bring another rise.
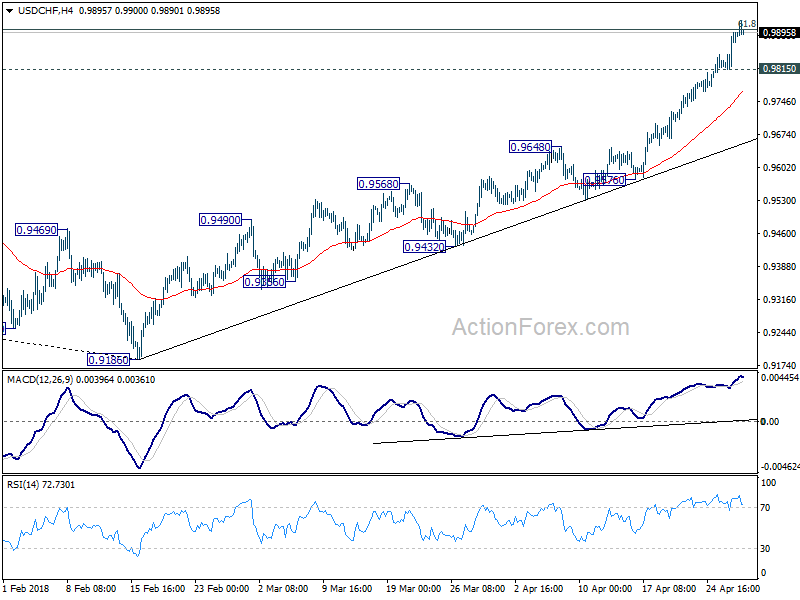
In the bigger picture, fall from 1.0342 is seen as a medium term down trend. The break of 38.2% retracement of 1.0342 (2016 high) to 0.9186 (2018 low) at 0.9626 suggests that it's likely completed at 0.9186 already. Further rally would be seen back to 61.8% retracement at 0.9900 and above. Sustained break there would pave the way to retest 1.0342 key resistance next. This will now be the preferred case as long as 0.9576 support holds.