Sample Category Title
Dollar Rally Continues, SEK Slides Further
The dollar strikes back
The US dollar finally took its revenge as it reversed the last few weeks’ losses against all its G10 peers. On last trading day session of the week, the buck rose 0.25% against the euro, the Kiwi and the Aussie. Safe haven currencies such as the Swiss franc and the Japanese yen have better resisted the pressure.
Investors are finally feeling more confident about the US economic outlook, and especially inflation perspective, as the Fed is moving closer to its target. Fed members seem confident that they can stick to their gradual tightening process without running the risk of a triggering an unexpected rise in inflation. Indeed, according to the data, the job market is doing just fine, growth is solid – even though a slight slowdown is expected in the first quarter – and most importantly, inflation is moving in the right direction. Against such a backdrop, investors took a more bullish stance on the greenback and started to reduce their exposure to US bonds.
Looking ahead, the economic calendar is busy for the day, especially in the US. Traders will be watching the advance estimate of first quarter GDP growth, personal consumption, Core PCE and Michigan Sentiment Index in the US. The UK’s first quarter GDP growth is also due for release today, while in Japan the BoJ already release its quarterly economic outlook report earlier this morning.
Next week will also be a busy one. On Monday, we’ll get March personal income and spending. April’s ISM manufacturing will be publish on Tuesday, while the Fed will communicate its decision about interest rate on Wednesday. Finally, ADP and NFP figures will also be released next week (Wednesday and Friday, respectively).
Regarding the Fed interest rate decision, it will be most likely a non-event as there won’t be any press conference. The statement may experience some changes but nothing important. We maintain our positive stance on the greenback but we believe it is time for a consolidation, especially after such a sharp rally.
Riksbank monetary decision doesn’t support the krona
Weakening against the single currency since August 2017, the Swedish krona takes a kicking, especially since the beginning of the year, depreciating by 9.62% and 6.78% respectively. Yesterday’s Riksbank monetary policy decision did not help appease the wound, as March inflation data remained weaker than expected for central bankers, given at 0.30% and 1.90% (prior: 0.70% and 1.60%) on month-over-month and year-over-year basis. Accordingly, Riksbank’s decision to maintain its key rate at -0.50% (unchanged since February 2016), came in disagreement with the market who was expecting a 25 basis points rise, pushing the EUR/SEK pair higher by 1.36% this week.
As the structural economy recovers from recent lows, with a recovery in March trade balance who remained in negative territory for three months in a row, an upturn in domestic consumption and improving manufacturing confidence, we therefore would assume that the Riksbank normalization policy start won’t take long, unless the ECB maintains its stance, a very likely scenario since Draghi’s statement during the same day on the EU economy momentum slowdown.
The EUR/SEK pair trades at its September 2009 level, given at 10.5446. There is still a long way to go before reaching strong resistance at 11.16 (23/06/2009 high). The pair is heading along the 10.55 range in the short-term.
EUR/USD Bearish Pressure Breaks Critical 1.21 Support Zone
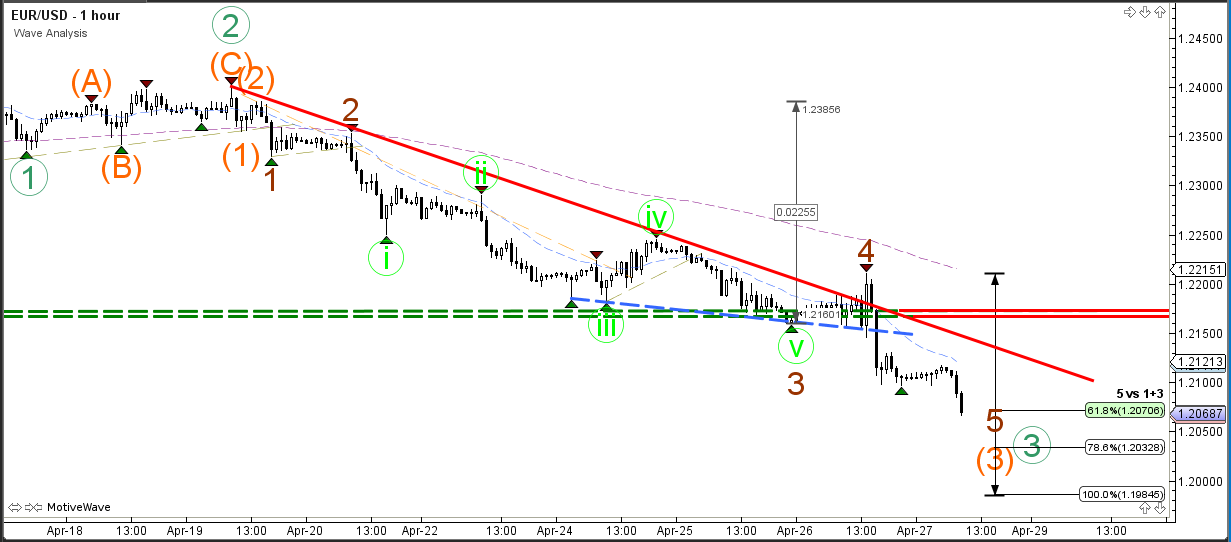
The EUR/USD bearish momentum is breaking below the key 1.21 support zone which marked the last hope for the bulls. Due to the bearish breakout, price is probably not in a long-term bullish wave 4 and a larger bearish ABC correction is taking place. For the moment, price is now probably building bearish wave 3 (green) of wave 3 (blue).
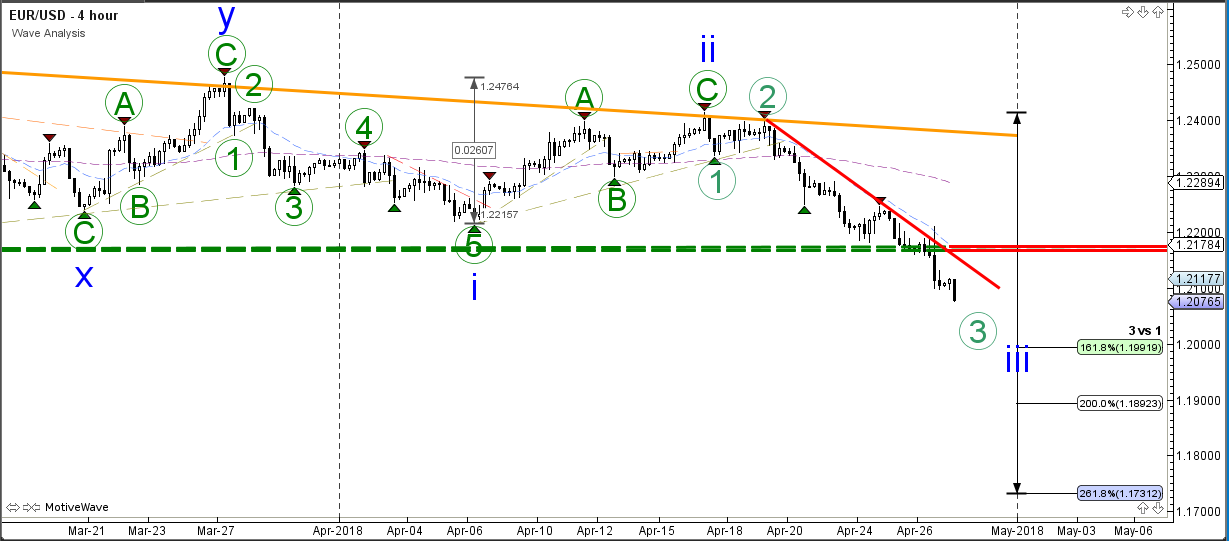
The EUR/USD broke below the support zone (dotted lines) and is expanding the bearish momentum with a new lower low. Considering the break of the key support zone, price is expected to continue with the downtrend via the wave 3 (orange) and then later on after a retracement via a wave 4.
USD/JPY Strong Uptrend But Watch For 109.77
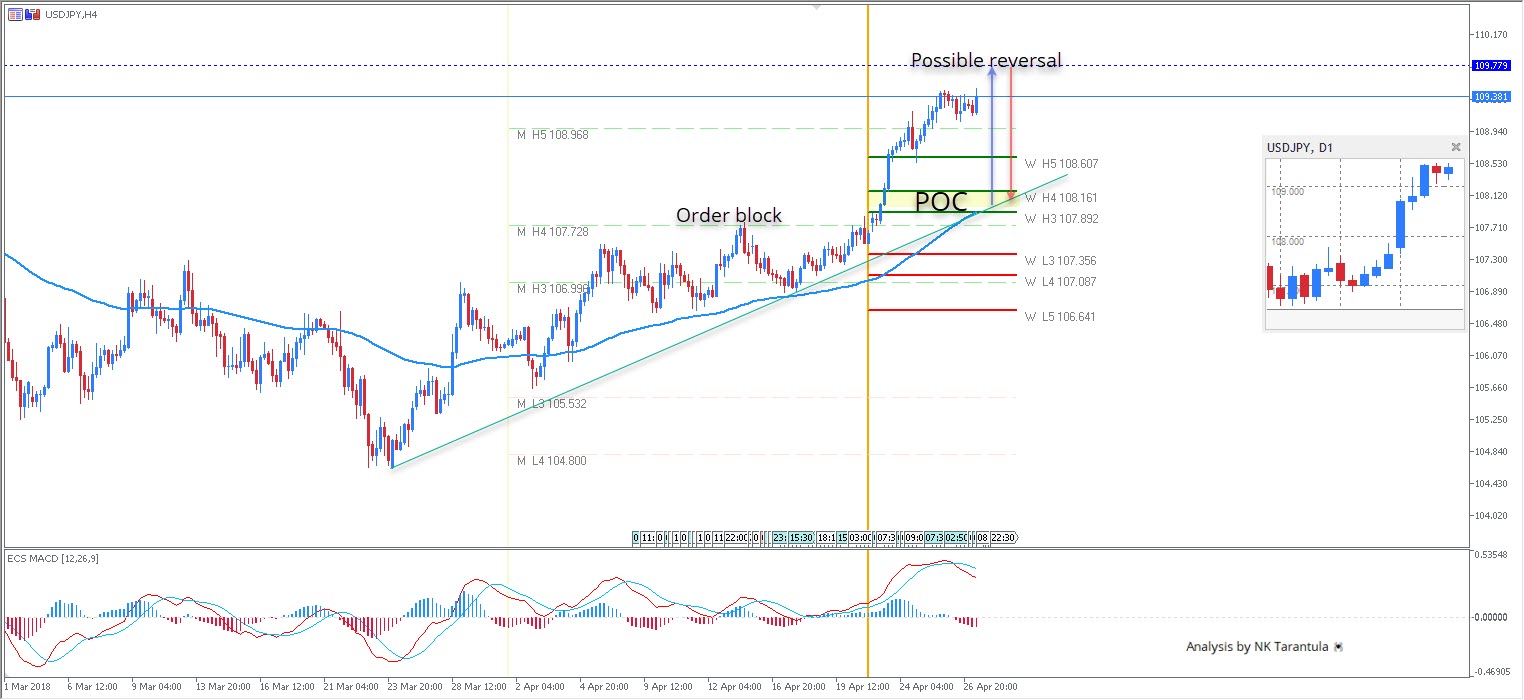
The USD/JPY has been in a very strong uptrend breaking both Monthly and Weekly H5 resistance levels. At this point traders should watch for 109.77 previous daily high and historical sellers spot. The price could reject towards 108.96 and 108.15 POC zone. POC zone is the spot where the price could bounce again. If 109.80 breaks watch for 110.20 and 110.50. Today it's Friday, so we might see some profit taking later in the day.
Source: Admiral Markets MT5 with MT5SE Add-on
W L3 - Weekly Camarilla Pivot (Weekly Interim Support)
W H3 - Weekly Camarilla Pivot (Weekly Interim Resistance)
W H4 - Weekly Camarilla Pivot (Strong Weekly Resistance)
M H4 - Monthly Camarilla Pivot (Very Strong Monthly Resistance)
M L3 – Monthly Camarilla Pivot (Monthly Support)
M L4 – Monthly H4 Camarilla (Very Strong Monthly Support)
POC - Point Of Confluence (The zone where we expect price to react aka entry zone)
Forex Technical Analysis: EUR/USD, USD/JPY, GBP/USD
EUR/USD
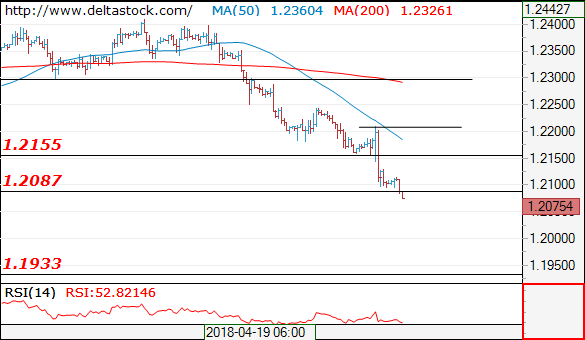
Current level - 1.2075
The pair is currently testing 1.2090 major support area and the intraday bias is still bearish, with a crucial high at 1.2115. Next major support is seen at 1.1930 and initial intraday base is projected around 1.2000 sentiment zone.
| Resistance | Support | ||
| intraday | intraweek | intraday | intraweek |
| 1.2160 | 1.2412 | 1.2000 | 1.2090 |
| 1.2300 | 1.2560 | 1.1930 | 1.1930 |
 USD/JPY
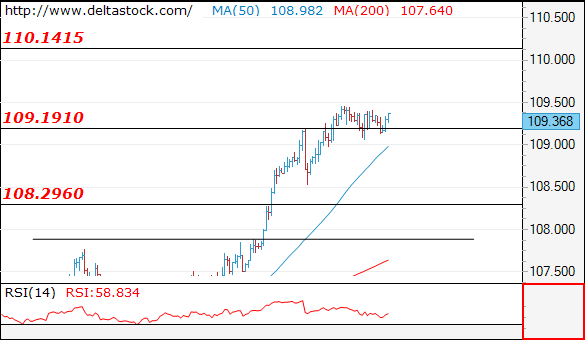
Current level - 109.36
The uptrend is still intact, for a rise towards 110.20 area. Crucial on the downside is 108.50 low.
| Resistance | Support | ||
| intraday | intraweek | intraday | intraweek |
| 110.20 | 110.20 | 109.00 | 106.60 |
| 110.20 | 111.90 | 108.50 | 104.60 |
GBP/USD
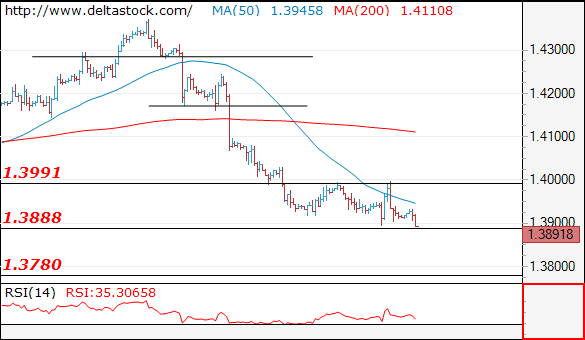
Current level - 1.3891
Expect a break through 1.3880 to challenge 1.3780. Key hurdle is projected at 1.3990.
| Resistance | Support | ||
| intraday | intraweek | intraday | intraweek |
| 1.3990 | 1.4280 | 1.3880 | 1.3780 |
| 1.4150 | 1.4280 | 1.3780 | 1.3710 |
Sterling Falls Further After Downbeat UK GDP Data
UK GDP fell below expectations in Q1, as markets feared such outcome on bad weather that hit Britain in early 2018, but this is just a part negative factors that impacted UK economy.
Data released today showed that UK economy grew at its weakest pace since late 2012, as results undershot forecasts (Q1 GDP q/q 0.1% vs 0.3% f/c / y/y 1.2% vs 1.4% f/c/prev).
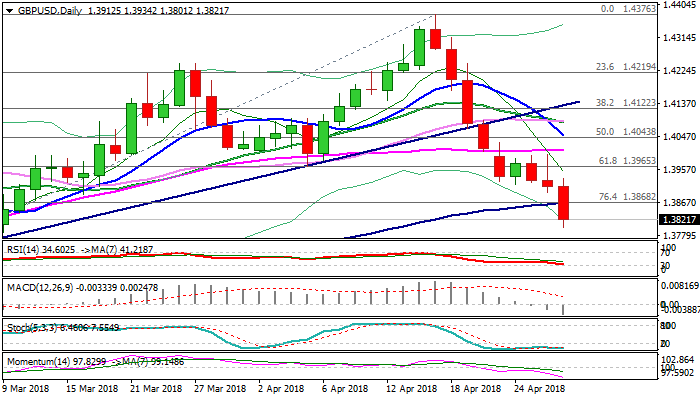
Cable spiraled through initial 100SMA support and hit session low at 1.3800 (the lowest since 09 Mar), signaling further weakness, as downbeat data further affected firm bearish sentiment, weakened by another hit on May rate hike expectations.
Minor support at 1.3780 (08 Mar trough) lies en-route to key support at 1.3711, which came in near-term focus.
Oversold conditions have so far been ignored, however, some corrective action could be anticipated.
Broken 100SMA (1.3868) now reverted to initial resistance, guarding daily cloud base at 1.3901.
Focus now turns towards US Q1 GDP data and speech of BoE’s Governor Carney, which are due later today. US GDP is forecasted at 2.0% in Q1 vs 2.9% previous, which could provide a breather to pound’s bears on weak release, while daily cloud twist, due next Tuesday, could attract stronger recovery,.
Res: 1.3868, 1.3901, 1.3965, 1.4005
Sup: 1.3800, 1.3780, 1.3711, 1.3655
Forex Analysis: UK100 And EURCAD
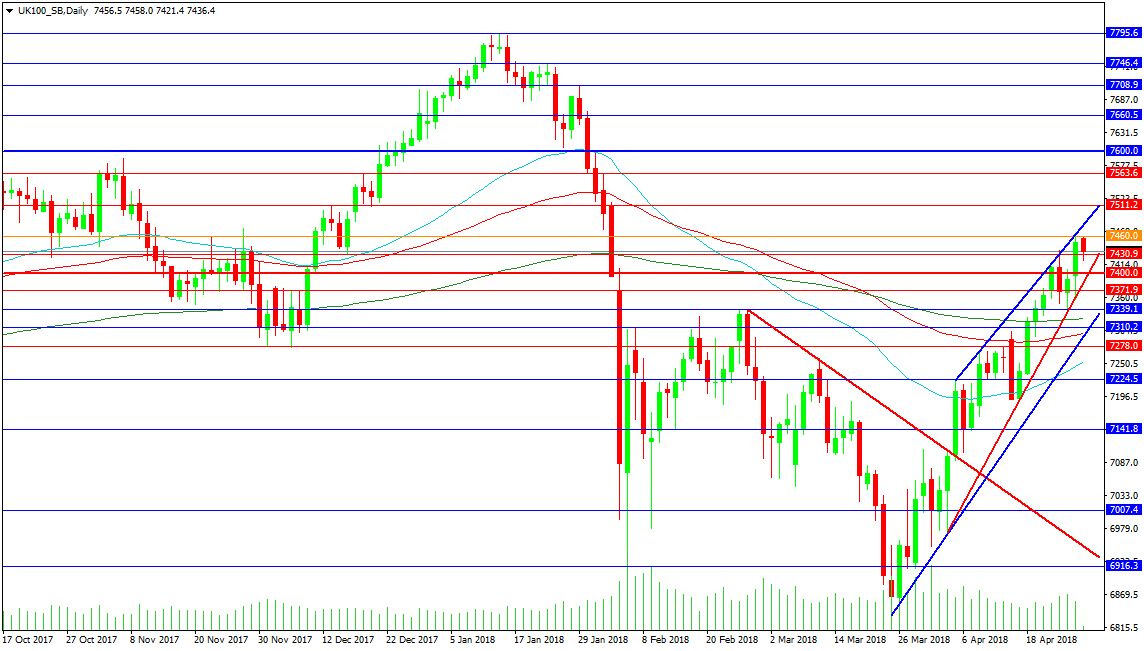
The UK100 Index has rebounded strongly after the selloff in global equities earlier this week. The chart shows price action has risen to the upper trend line of the channel overnight, creating a new higher high at 7465.00. The market has been supported by moves in pound sterling and the risk-on mode. Should the market continue its uptrend, the 7500.00 level is looming, with substantive resistance around the 7511.0-7512.00 area. Above there, the 7563.60 level has been resistive and supportive ahead of 7600.00.
Support comes with the red rising trend line, which has been used consistently over the past month, despite the steepness of its slope. A trend line of this attitude is hard to maintain but it performed remarkably well this week, showing the willingness of traders to buy against support. The line comes in at 7382.00 today, with a loss of this line potentially putting long positions under pressure and targeting support at the lower blue trend line at 7300.00. The 200 DMA is at 7325.3 and will support these trend lines in the coming days. A loss of the 50 DMA at 7250.00 sets up an opportunity for bears to turn sentiment but it would need to be correlated with a move in GBP.
EURCAD
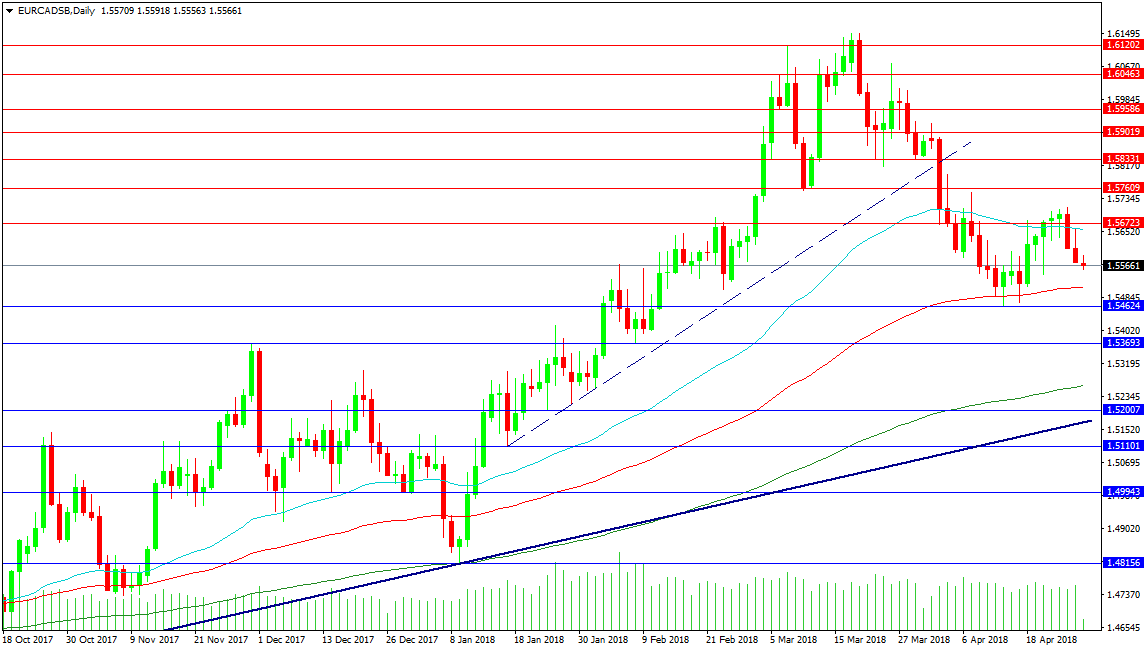
The EURCAD pair is moving lower this week, continuing the trend started over a month ago. Support at 1.54624 allowed for a retracement higher but yesterday price fell under the 50 DMA at 1.56625 and is today using this indicator as resistance. A drop from the current level to the 100 DMA at 1.55112 is achievable but wouldn’t be decisive until the April low is taken out. At this point, support shifts to the 1.53693 level as the November high and the support level used in the second week of February. The 200 DMA is stationed below at 1.52623, with the rising trend line closing in on the 1.52000 level. A loss of this line targets this year’s low of 1.48156.
Resistance is found at 1.57000 as the high of this week, with 1.57600 above. A move above this area reasserts the prevailing bullish trend and the retracement could be seen as a continuation pattern. This would target the 1.60000 level and the recent highs at 1.61500, followed by 1.63000 area in extension.
GBPJPY Tumbles Below Ascending Trend Line, Bullish Outlook Could Turn To Bearish
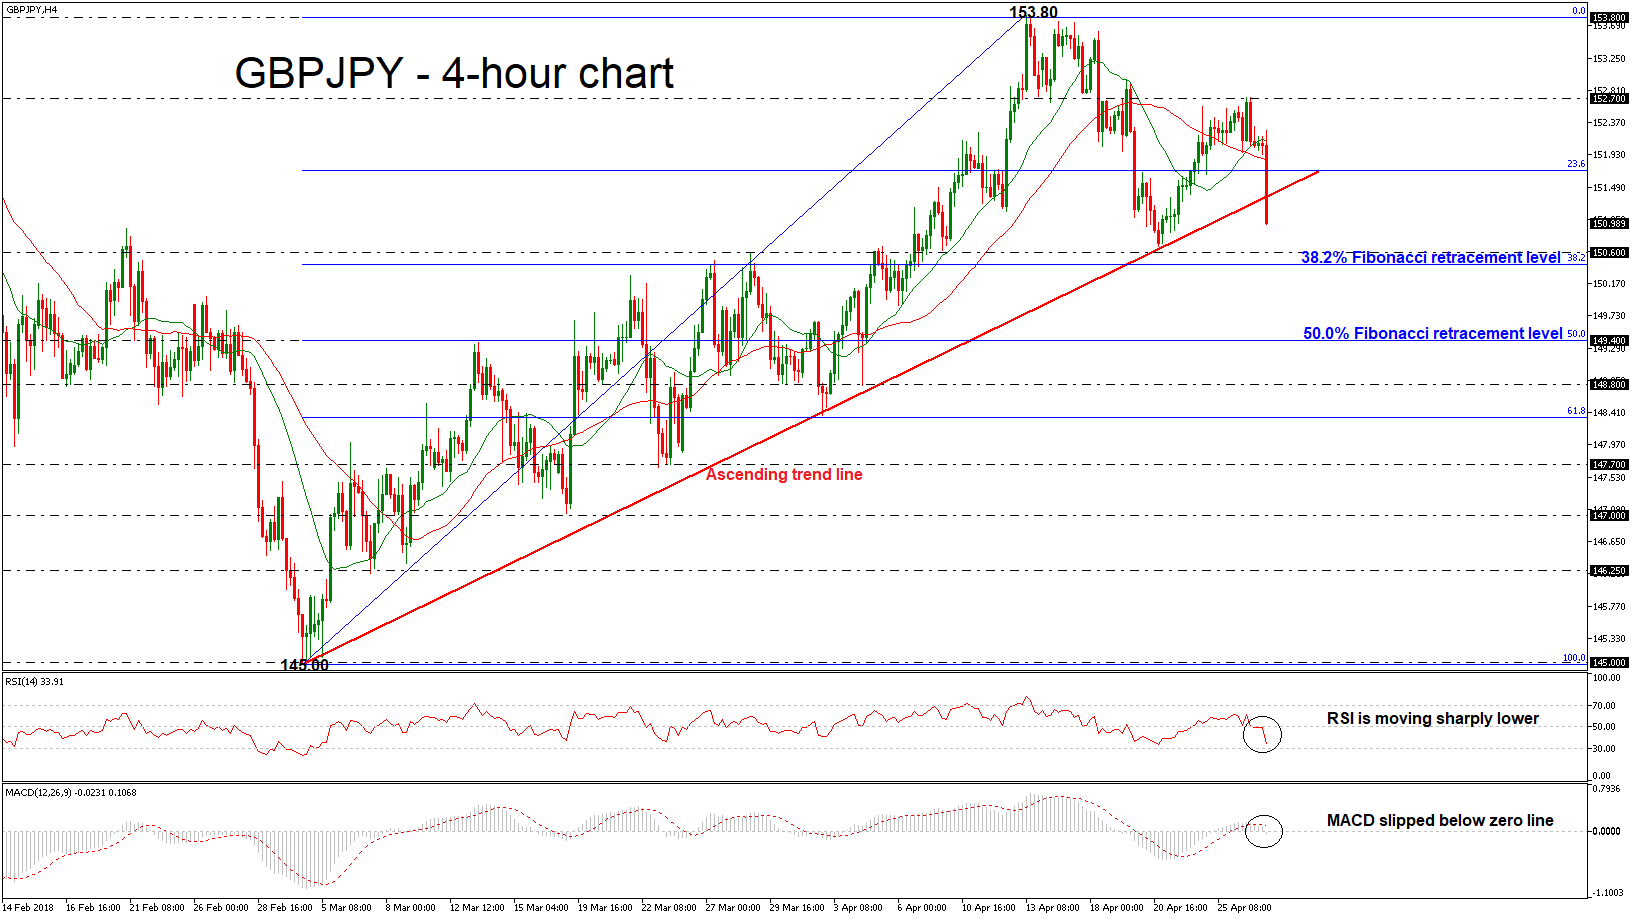
GBPJPY has been underperforming since Thursday’s trading session after it found a resistance obstacle at the 152.70 barrier. When looking at the bigger picture, the price had been developing within an ascending movement since March 2after the pullback on the 145.00 significant psychological level, however, currently, the price has fallen sharply below this line. The short-term technical indicators are bearish and point to more weakness in the market.
In the 4-hour chart, prices are trading well below the 20- and 40-simple moving averages over the last few sessions signaling a continuation of the decline. The RSI indicator is moving sharply lower, approaching the negative threshold of 30, while the MACD oscillator is dropping below the trigger line, falling in the negative territory.
Should prices continue the bearish correction, the next significant area to have in mind is the rising trend line around the 151.50 price level. The pair has just breached this trend line but in case of a session close below it , this would increase bearish pressures and the positive medium-term outlook could shift to negative until the 150.60 support. Further losses could push GBPJPY towards the 50.0% Fibonacci retracement level of 149.40 of the upleg from 145.00 to 153.80.
On the flip side, a possible scenario is a rebound on the rising trend line and the resumption of an upward movement once again. A strong resistance level to watch is the 152.70 region, while above that, the next major resistance is the two-month high of 153.80.
EURUSD Analysis: Plunges To 1.21
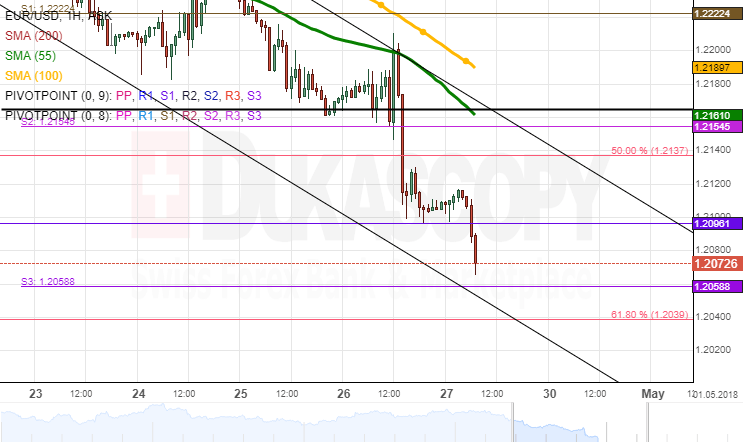
The common European currency continues to weaken considerably against its American counterpart for the sixth consecutive session.
On Thursday morning, the pair was bounded between a 2018 support and the 55-hour SMA. The former was breached after the ECB press conference when traders pushed the pair down to a fresh three-month low of 1.21.
This mark is likely to provide some support during the first part of the day, as it is a long-term support/resistance level. This should send the Euro for a minor recovery towards the 55-hour SMA and a strong resistance point at 1.2160.
The US Advance GDP is likely to dominate the second part of this session with the daily high and low being located at 1.2200 and 1.2030, respectively.
GBPUSD Analysis: Calm Before Busy Session
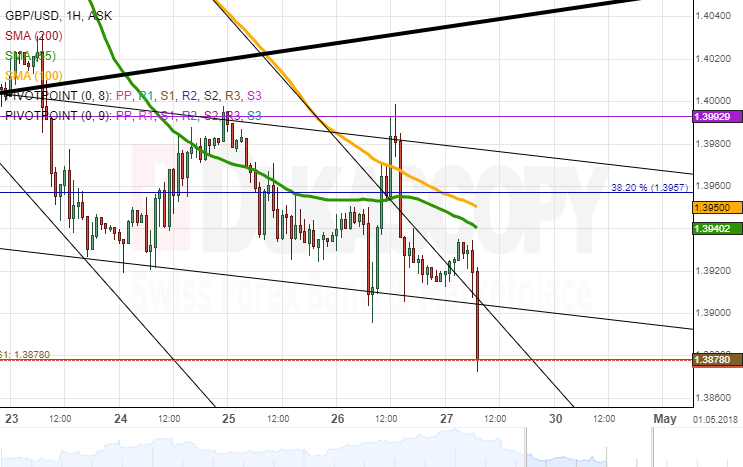
GBP/USD demonstrated high volatility in both directions on Thursday. The pair, however, managed to remain within the bounds of a short-term channel, at the same time having returned to its Wednesday-morning level today.
It is expected that the Sterling maintains its slight tendency downwards during the first part of the day due to the combined resistance of the 55– and 100-hour SMAs and the 38.20% Fibo retracement near 1.3950.
However, this session is dependent on the US and UK GDP data releases that are very likely to introduce quite significant volatility in the market. Thus, the possible trading range for today should be relatively wide.
Gains are limited by the 200-hour SMA at 1.41, while the monthly S1 and the weekly S2 are supporting the Pound at 1.3740.
USDJPY Analysis: Remains Unchanged
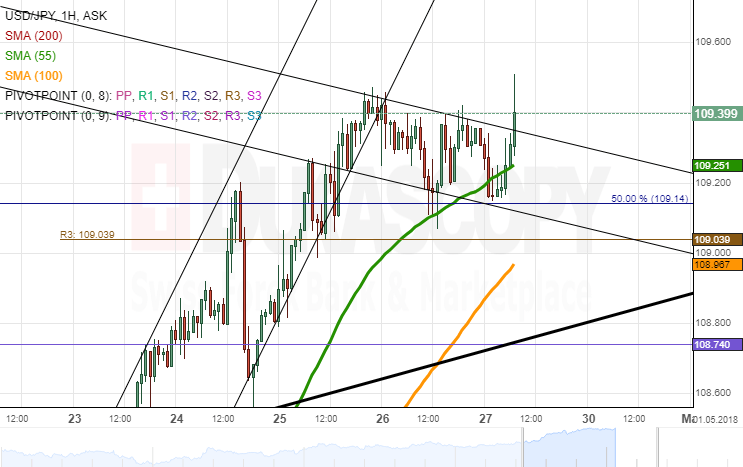
Following a breakout from the steep ascending channel, the bearish sentiment failed to take the upper hand and push USD/JPY down to the 100-hour SMA and the breached wedge line near 108.75. Instead, the pair kept its position slightly above the 50.0% Fibo retracement and the weekly R3 at 109.10 on Thursday and early on Friday.
The slight tendency southwards should be maintained during the first part of the session, are bulls are gradually giving up their strong positions. Thus, the rate is likely to reach the aforementioned 108.80 area or fall even lower down to the weekly R2 at 108.50.
The remaining part of this trading day and week should be guided by the US GDP release at 1230GMT. In terms of upside potential, the Greenback could be limited by the 110.00 level.