Sample Category Title
Gold Analysis: Still Bearish
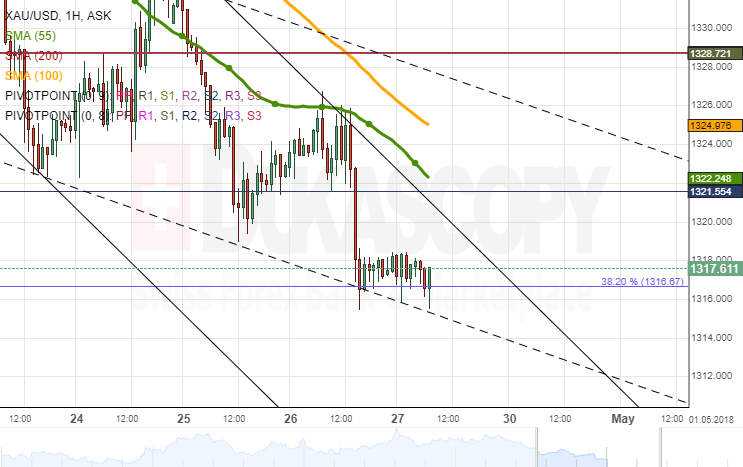
Following a rather calm Thursday morning, Gold was pressured lower by the strong resistance of the 55-hour SMA. As a result, the pair failed to reach the upper boundary of the dashed short-term channel.
This three-hour decline was stopped by the 38.20% Fibonacci retracement located at 1,316.67 where the pair had remained during the Asian session, as well. Some moderate downside potential is still apparent in the market today.
Meanwhile, high volatility is likely to occur mid-session after the US Advance GDP is released at 1230GMT. In general, the pair might be reluctant to push above the 1,330.00 mark, while no strong support levels are restricting the pair until the distant 1,300.00 where the 50.0% Fibo, the monthly S1 and the senior channel are located.
AUD/JPY 4H Chart: SMA Providing Supports
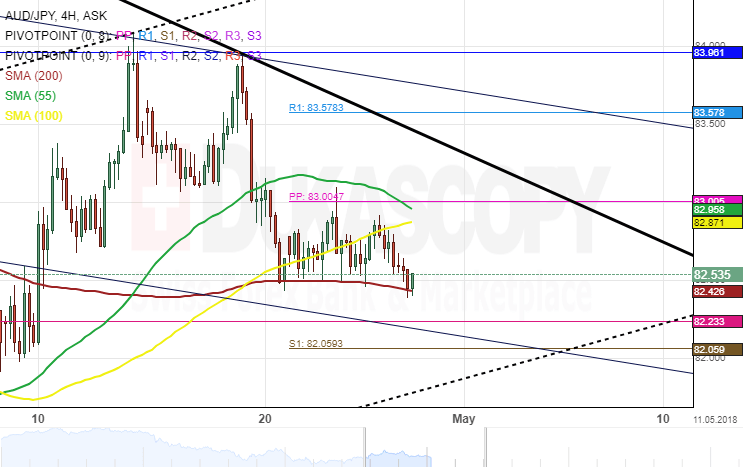
The Australian Dollar has been trading in a channel down against the Japanese Yen since January after the pair reached the upper boundary of a dominant channel. However, a new junior ascending pattern has been spotted which was formed on March 23.
The AUD/JPY currency pair is gradually moving north. Nevertheless, a resistance set by the monthly pivot point at 83.96 was restricting the rate to continue it upward moves. Furthermore, during the last few days, the exchange rate has been trading sideways.
A breakout from the 200– hour simple moving average is expected during the following trading sessions. If and when this occurs, it could encounter a support cluster formed by the combination of the weekly and the monthly PPs at the 82.05 mark.
CHF/SGD 4H Chart: Decline Continues
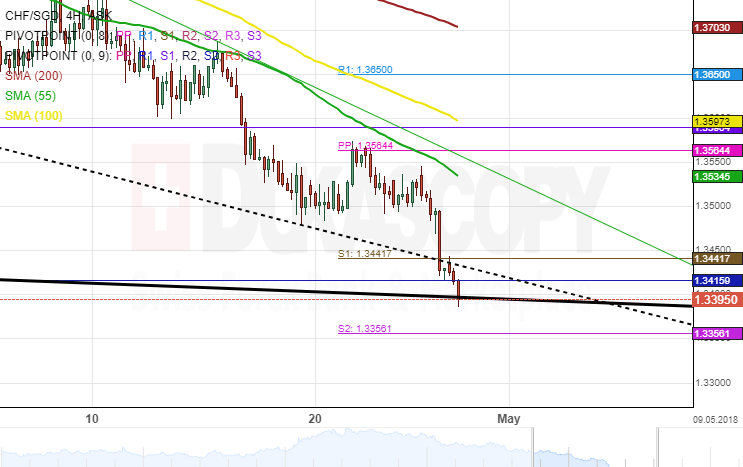
The Swiss Franc has been driven by a strong downside movement against the Singapore Dollar since February 9 and thus fell by 5.69%. This bearish momentum started after the currency pair hit the upper boundary of a junior pattern.
This downside risk has resulted in the exchange rate to reached January 2015 low level. During the last two weeks, the CHF/SGD currency pair has been trading within the range of a resistance cluster at 1.3590 and a support cluster at 1.3415. A breakout is likely to occur during the following trading sessions.
If the aforementioned breakout occurs, the currency exchange rate could be heading for a potential target at 1.3233 formed by the weekly pivot point. Meanwhile, technical indicators suggest that bears are likely to grow stronger within the next trading days.
USDJPY Holds Within Narrow Consolidation, Bulls Remain Intact Above Broken 100SMA
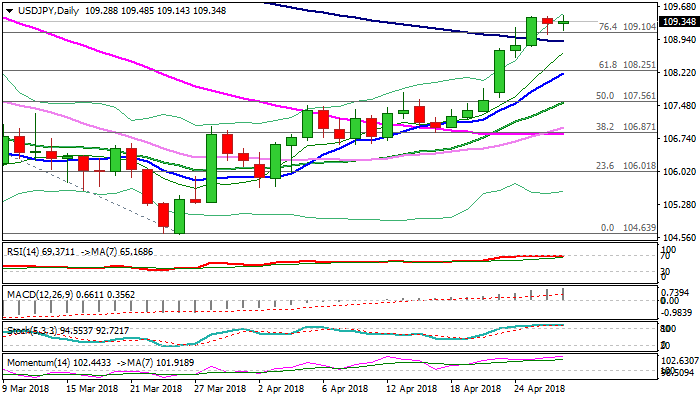
The pair holds firm on Friday and extends consolidation under new recovery high at 109.46 (weekly 100SMA) and showed no reaction on BoJ’s policy decision, released earlier today.
The central bank kept policy steady but removed timeframe for achieving inflation target.
Bulls eye barrier at 109.68 (Fibo 50% of 114.73/104.63 fall) which guards key barriers at 110.00 (psychological) and 110.24 (200SMA).
Bulls show hesitation above daily cloud, break of which was strong bullish signal, but narrow ranges so far diminish risk of pullback, signaled by overbought daily studies and Thursday’s Hanging Man candle.
Broken 100SMA (108.90) is expected to hold and keep bulls intact for fresh upside action, as dollar maintains strong bullish tone.
The pair is on track for the fifth straight bullish weekly close, which offers additional support.
Bearish scenario requires break and close below 100SMA to sideline immediate bulls and signal correction.
Res: 109.46, 109.68, 110.00, 110.24
Sup: 109.10, 108.90, 108.39, 108.25
Bitcoin Heading Higher
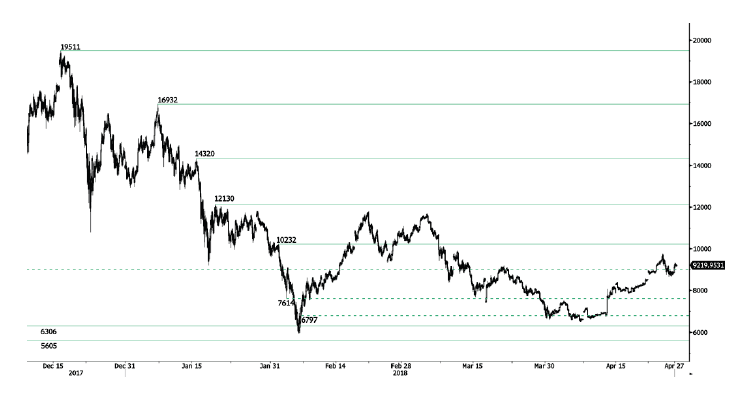
Bitcoin rise started in mid April is strengthening, currently trading above 9200 and heading along the 9315 range. Bitcoin bearish pattern started in March 2018 weakens. The pair is contained between hourly support and resistance given at 6306 (13/11/2017 low) and 10232 (01/02/2018 high). The technical structure suggests short-term increase
In the long-term, the digital currency has had an exponential growth but also presented important downturns. There is decent likelihood that the currency could stabilize between 7'000 - 12'000 in 2018. Bitcoin is trading slightly above its 200 DMA (8000 range).
CRUDE OIL Expected To Trade Below 68
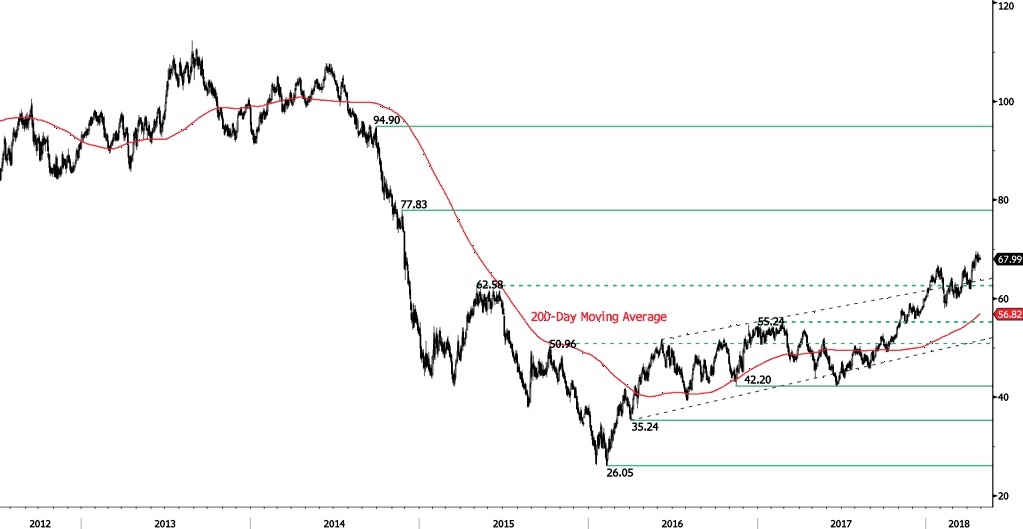
Crude oil is decreasing, currently given above 68 and heading along the 67.85 range. Crude Oil is trading at its December 2014 high. The bullish pattern started in November 2017 is maintained. Hourly support at 63.20 (10/04/2018 low) is distanced. The technical structure suggests short-term downward moves.
In the long-term, crude oil has recovered after its sharp decline last year. However, we consider that further weakness is very likely. For the time being, the pair lies in an upside trend since June 2017. Support lies at 42.20 (16/11/2016) while resistance is located at 77.83 (20/11/2014). Crude oil is trading largely above its 200 DMA.
SILVER Continued Weakness
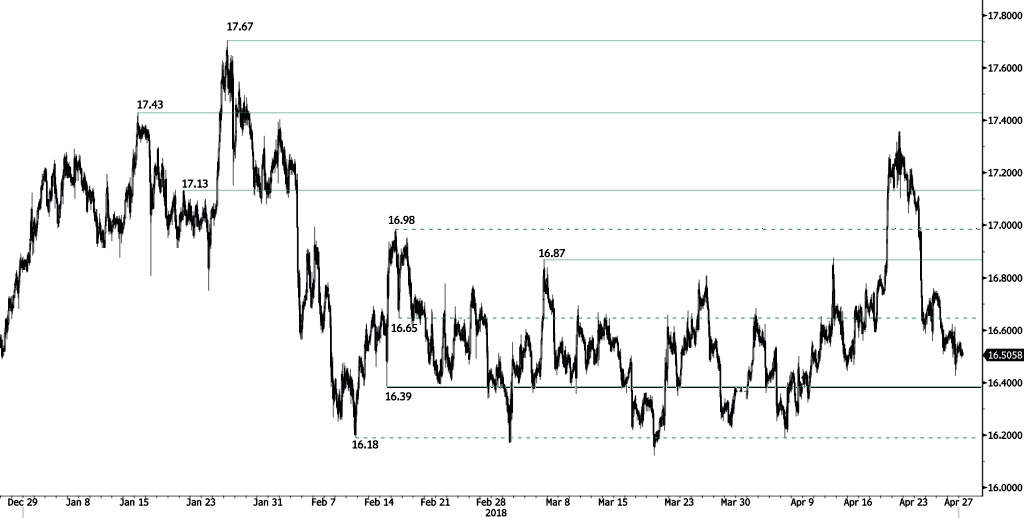
Silver is decreasing further, trading below 16.60 and heading along the 16.48 range. Hourly support and resistance are given at 16.39 (14/02/2018 low) and 16.87 (06/03/2018 high). The technical structure suggests short-term decrease.
In the long-term, the trend remains negative/ sideways. Further downside is very likely. The pair is trading below its 200 DMA. Resistance is located at 21.58 (10/07/2014 high). Strong support can be found at 11.75 (20/04/2009).
GOLD Trading Below 1320
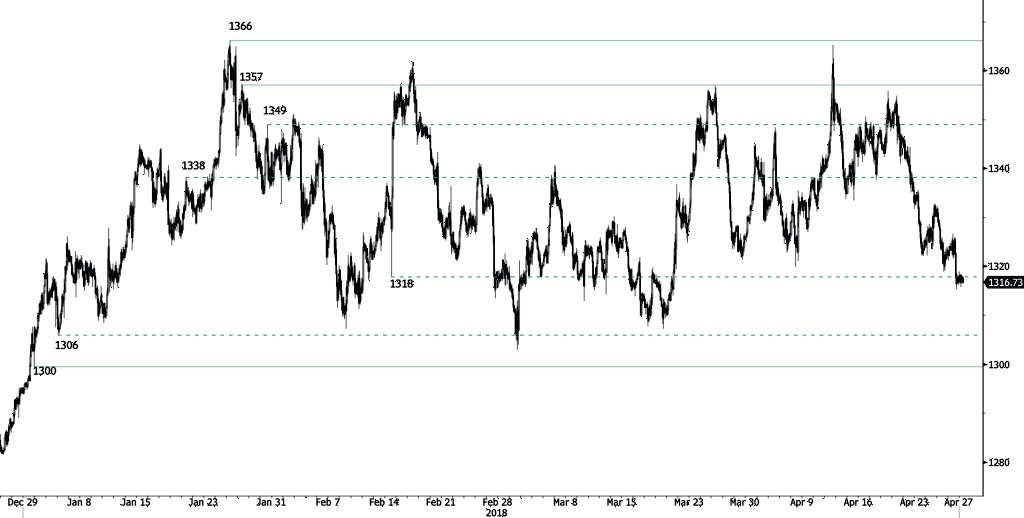
Gold is heading lower, breaking hourly support at 1318 (14/02/2018) and trading at March 2018 low. The pair is heading along the 1315 range. Hourly support and resistance are given at 1300 (29/12/2017 low) and 1357 (26/01/2018 high). The technical structure suggests short-term downward moves.
In the long-term, the technical structure suggests that there is a growing upside momentum. A break of 1'392 (17/03/2014) is required to confirm it. A major support can be found at 1'045 (05/02/2010 low).
GBP dives as UK Q1 GDP grew only 0.1% qoq
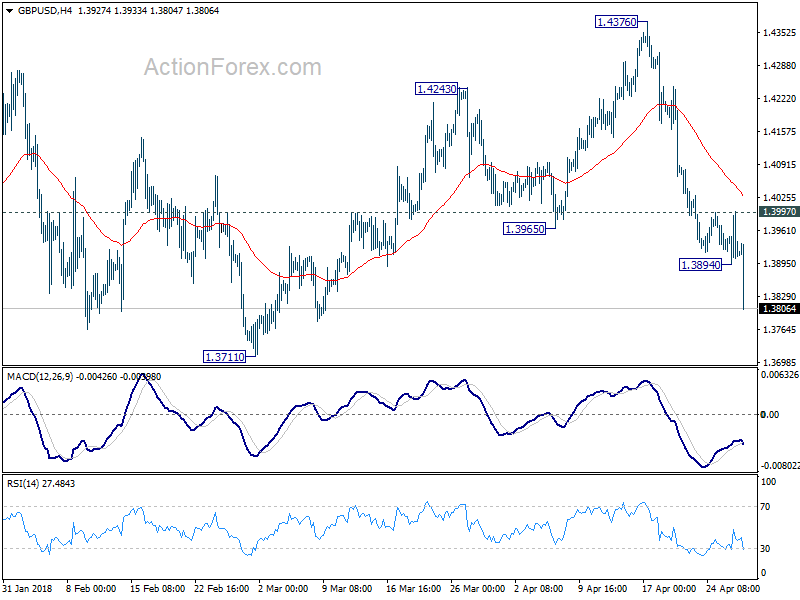
Now it's Sterling's turn. GBP dives sharply as Q1 GDP grew merely 0.1% qoq much worse than expectation of 0.3% qoq and prior quarter's 0.4% qoq. Annual rate was unchanged at 1.4% yoy. Index of services rose 0.4% 3mo3m below expectation of 0.6%. Now, it could be the final nail to close the case of a May BoE rate hike.
Some selling was seen in GBP/USD prior to the release, but it quickly accelerates down after the disappointment. GBP/USD is now on course for 1.3711 key support level. Decisive break there will be a strong indication of bearish medium term reversal. But remember, US will release Q1 GDP later today too.
EUR/CHF Maintained Below 1.20
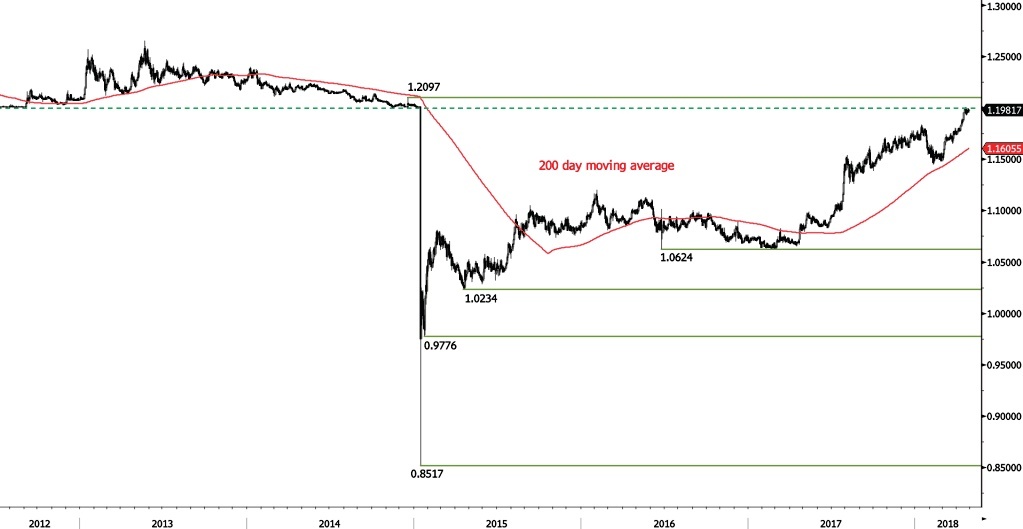
EUR/CHF bounce from 1.1956 low continues, heading along the 1.1985 range. Strong resistance at 1.20 remains. Hourly support given at 1.1842 (11/04/2018 low) is distanced. The short-term technical structure suggests further short-term sideways trading moves.
In the longer term, the technical structure has reversed. Strong resistance at 1.20 (level before the unpeg) is now at reach. The ECB's slowing QE program is likely to cause buying pressures on the euro, which should weigh in favour of the EUR/CHF. Support and resistance can be found at 1.0624 (24/06/2016 low) and 1.2097 (18/12/2014 high).