

Sample Category Title
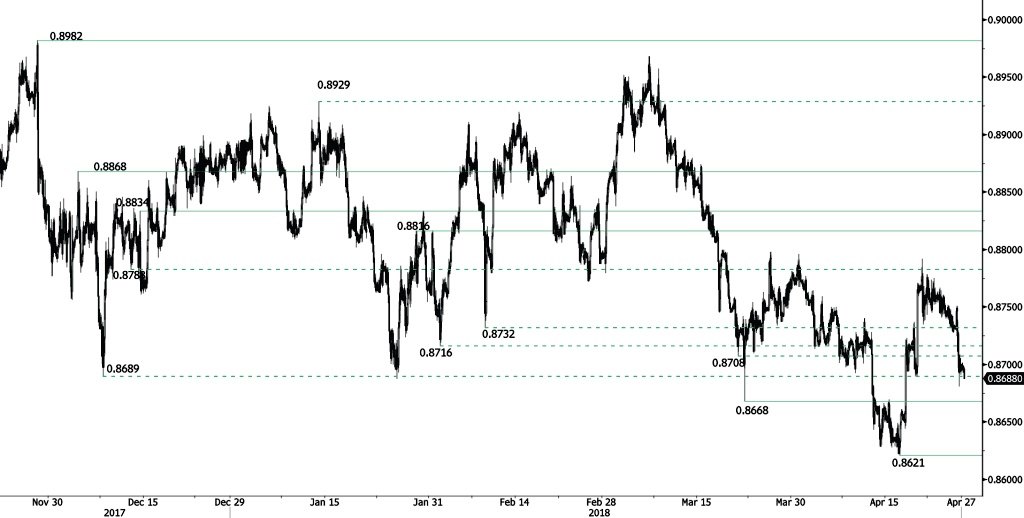
EUR/GBP Bearish Breakout
EUR/GBP is weakening, trading below 0.87 and heading along the 0.8684 range. EUR/GBP bearish pattern started in March is strengthening. Hourly support and resistance are given at 0.8668 (22/03/2018 low) and 0.8816 (29/01/2018 high). The technical structure suggests short-term decrease.
In the long-term, the pair has largely recovered from 2015 lows. The technical structure suggests further upside pressure. Strong resistance can be found at 0.9500 (psychological level) while support remains at 0.8304 (05/12/2016 low). The pair is trading below its 200 DMA.
AUD/USD Weakening
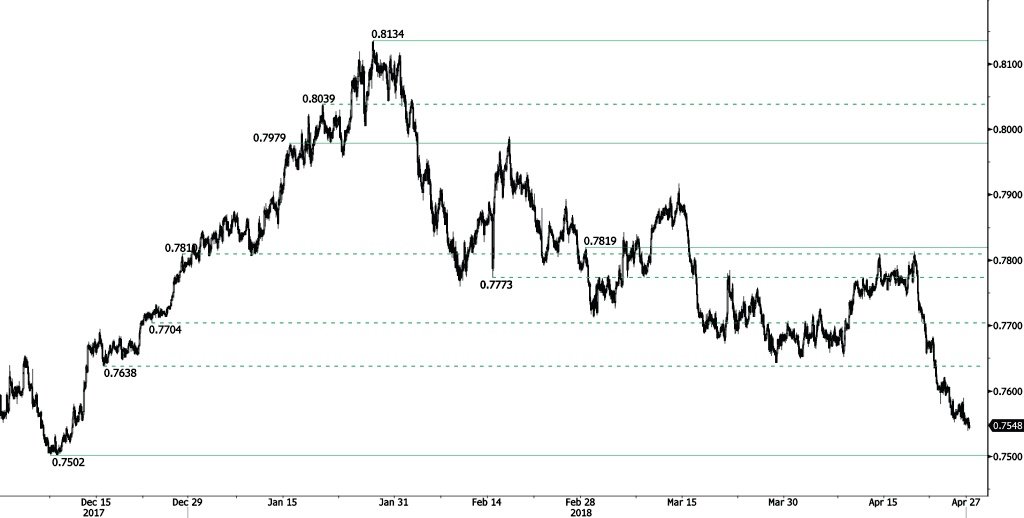
AUD/USD bearish pattern from 0.7813 (19/04/2018) starts back, heading along the 0.7535 range. The pair is trading at December 2017 low. Hourly support and resistance are given at 0.7502 (08/12/2017 low) and 0.7819 (28/02/2018 high). The technical structure suggests short-term downward moves.
In the long-term, the upward trend slows down after failing to reach key resistance at 0.8164 (14/05/2015 low). Key support stands at 0.6009 (31/10/2008 low). A break of the key resistance at 0.8164 (14/05/2015 high) is needed to invalidate our long-term bearish view.
USD/CAD Increasing
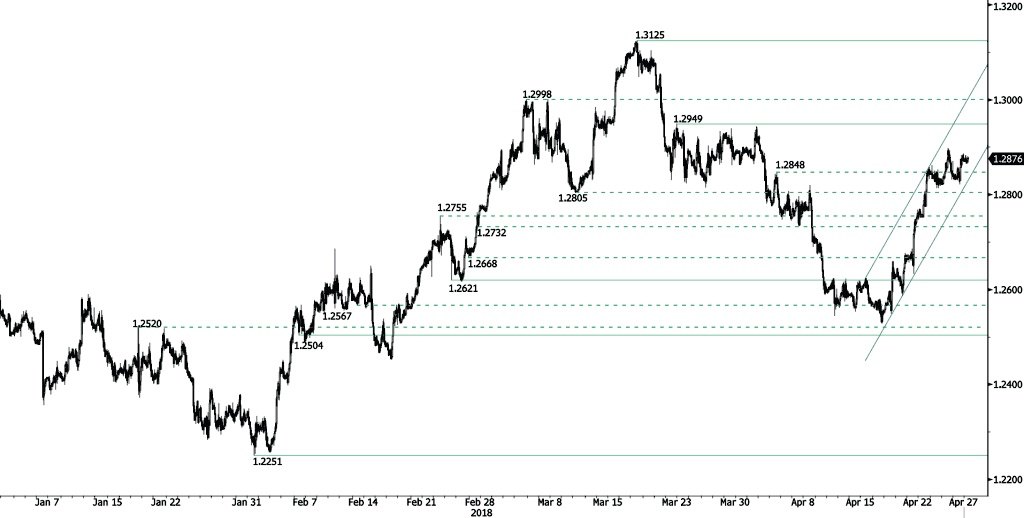
USD/CAD bullish trend starts back, heading along the 1.2885 range. Hourly support and resistance are given at at 1.2621 (23/02/2018 low) and 1.2949 (22/03/2018 high). The technical structure suggests short-term increase.
In the longer term, the pair is trading between resistance point at 1.3805 (05/05/2017 high) and support at 1.2128 (18/06/2015 low). Strong resistance is given at 1.4690 (22/01/2016 high). The pair is likely to head lower. The pair is trading above its 200 DMA.
USD/CHF Bullish Breakout
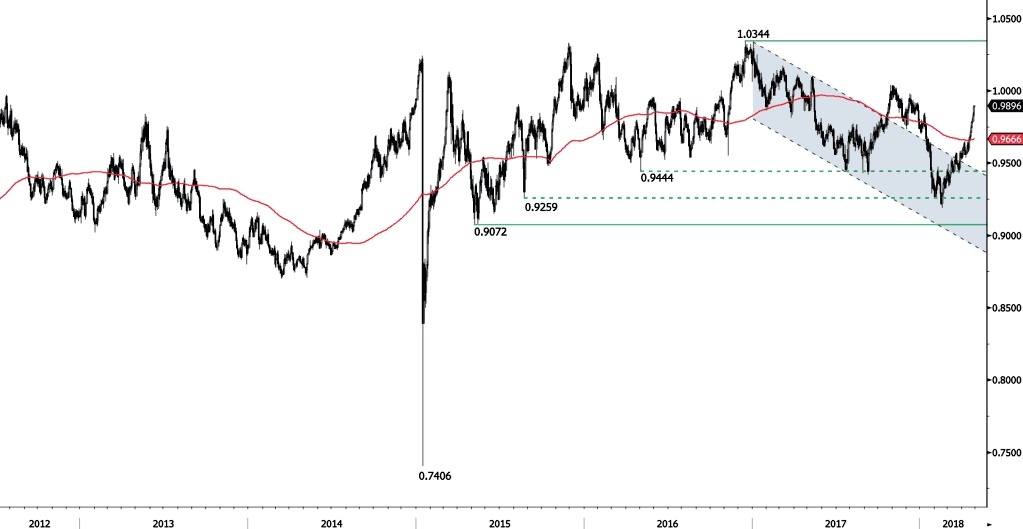
USD/CHF bullish pattern continues, the pair approaches the 0.9910 range. The bullish pattern started from 0.9188 (16/02/2018 low) continues. The pair is contained between hourly support and resistance given at 0.9574 (17/01/2018 low) and 0.9916 (26/12/2017 high). The technical structure suggests short-term upward moves.
In the long-term, the pair is still trading in range since 2011 despite some turmoil when the SNB unpegged the CHF. Key support lies at 0.9072 (07/05/2015 low) while resistance at 1.0344 (15/12/2016 high) is distanced. The technical structure favours a long term bullish bias since the unpeg in January 2015.
USD/JPY Bearish Consolidation
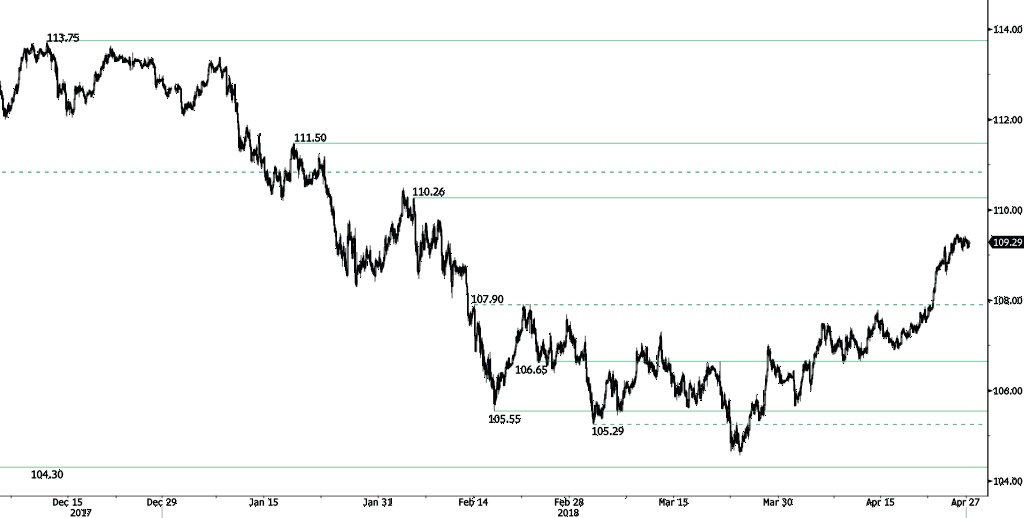
USD/JPY bullish pattern pauses, currently trading at 109.29 and heading along the 109.15 range. The bearish pattern started in January 2018 is weakening. Hourly support and resistance are given at 106.65 (22/02/2018 low) and 110.26 (05/02/2018 high). The short-term technical structure suggests short-term downward moves.
We favor a long-term bearish bias. Support remains at 101.20 (09/11/2016 low). A gradual rise toward the major resistance at 125.86 (05/06/2015 high) seems unlikely. Expected to decline further support at 101.20 (09/11/2016 low). The pair trades below its 200 DMA.
GBP/USD Slight Decrease
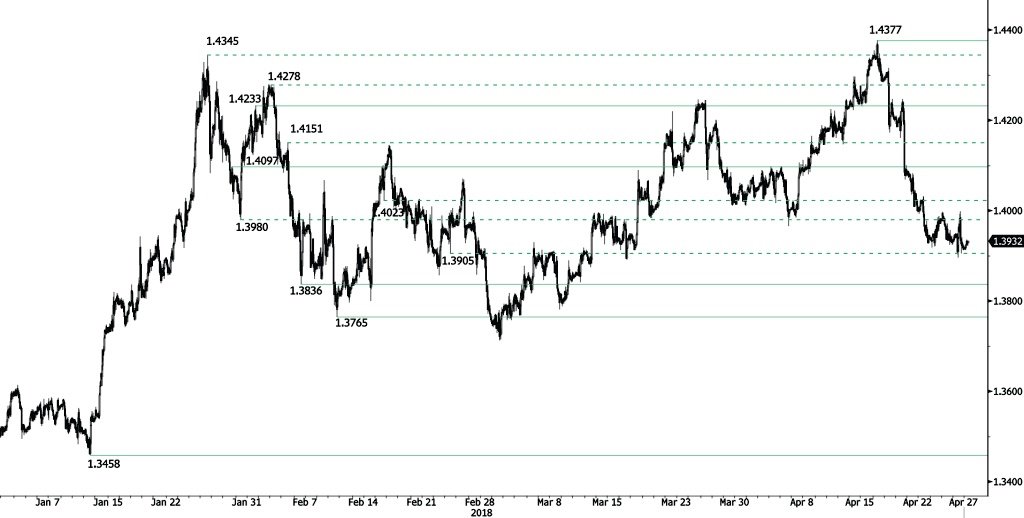
GBP/USD is trading lower, breaking hourly support at 1.3905 (23/02/2018) and heading along the 1.3895 range. The pair is currently trading at mid-March low. Hourly support and resistance are given at 1.3836 (06/02/2018 low) and 1.4097 (29/01/2018 high). The technical structure suggests short-term decrease.
The long-term technical pattern is reversing. The Brexit vote had paved the way for further decline but the pair is moving to 2016 highs. Long-term support and resistance are given at 1.1841 (07/10/2017 low) and 1.5018 (24/06/2016 high).
EUR/USD Decreasing
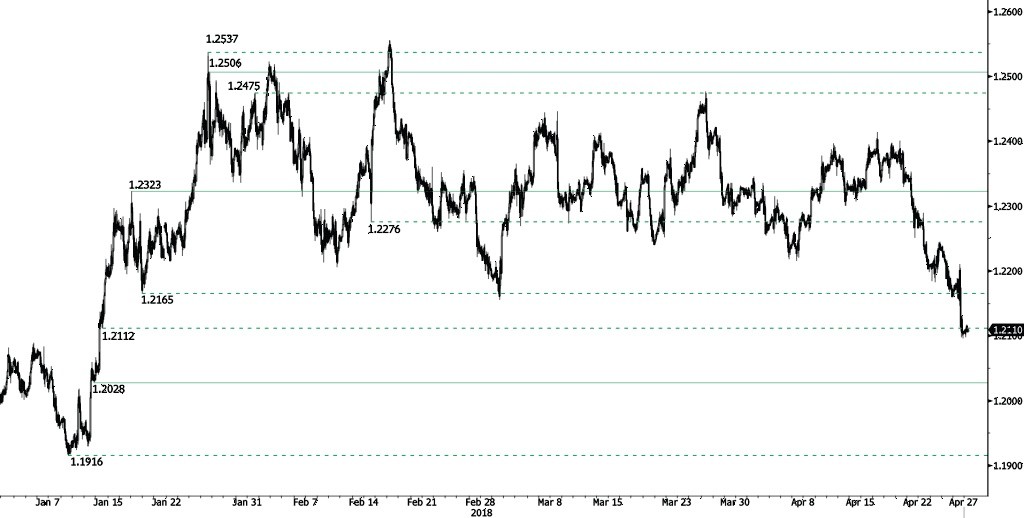
EUR/USD lies below 1.21, breaking hourly support at 1.2112 (12/01/2018). The pair is heading along the 1.2085 range. The pair is currently trading at mid-January 2018 low. Hourly support and resistance are now given at 1.2028 (11/01/2018 low) and 1.2323 (17/01/2018 high). The technical structure suggests short-term downward trading moves.
In the longer term, the momentum is turning largely positive. We favor a continued bullish bias. Key resistance is holding at 1.2886 (15/10/2014 high) while strong support lies at 1.1554 (08/11/2017 low).
GBPUSD Holds Firmly In Red And Could Fall Further On GDP Miss
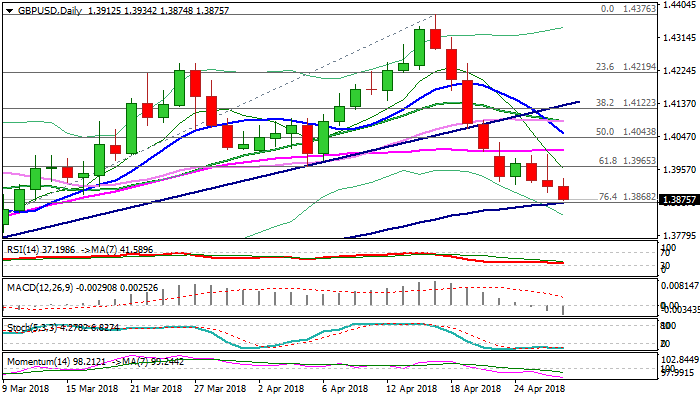
Cable extends weakness below thin daily cloud, signaling continuation of steep downtrend from 1.4376 (post-Brexit recovery high) after Thursday's action showed indecision and held within cloud. Bears pressure immediate support at 1.3868 (100SMA / Fibo 76.4% of 1.3711/1.4376 rally), break of which would open way towards key short-term support at 1.3711 (01 Mar trough). Sterling remains under strong pressure after weak data last week reduced probabilities for rate hike in May, which resulted in two weeks of heavy losses. Bearish studies add to negative outlook, which could worsen if UK GDP (due today) falls below expectations. Gross Domestic Product for Q1 is forecasted unchanged at 1.4% (y/y) and 0.3% vs 0.4% previous (q/q) but could be impacted by severe weather that hit the UK earlier this year.
Res: 1.3934, 1.3965, 1.4000, 1.4054
Sup: 1.3868, 1.3840, 1.3780, 1.3711
EURUSD – Bears Eye Psychological 1.20 Support/200SMA
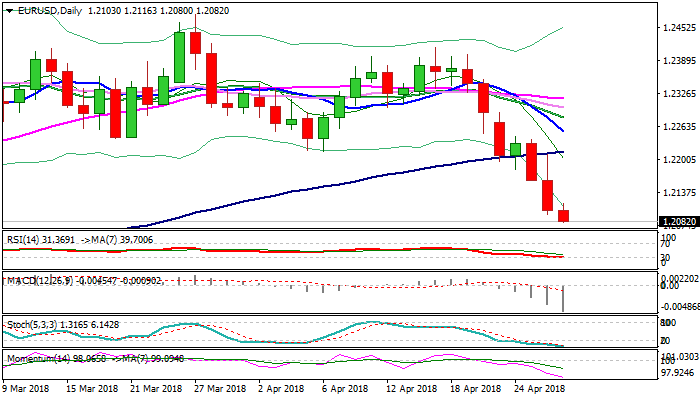
The Euro remains in red in early Friday's trading and hit new lows in over four months, in extension of strong bearish acceleration in past two days. Two long red candles of past two days and Thursday's one with long upper shadow, weigh heavily, as the pair is on track for strong bearish weekly close, which would add on existing pressure. Dovish stance from ECB's President Draghi on Thursday and strong US dollar, driven by higher US yields which cracked important 3% barrier, maintain strong pressure on the single currency. Multiple bear-crosses of daily MA's and 14-d momentum in steep descend, maintain firm bearish setup of daily techs. Fresh weakness eyes immediate support at 1.2054 (Fibo 50% of 1.1553/1.2555 rally/weekly Kijun-sen) which marks more significant psychological 1.20 support, reinforced by 200SMA. Thursday's close below pivotal support at 1.2154 generated strong reversal signal, which looks for confirmation on weekly close below 1.2154. Violation of 1.20 handle would generate another strong bearish signal and could spark stronger bearish acceleration. Corrective upticks on strongly oversold slow stochastic and attracted by daily cloud twist (next Tuesday), are expected to offer better selling opportunities and should be ideally capped by 100SMA (1.2215).
Res: 1.2116, 1.2154, 1.2172, 1.2215
Sup: 1.2054, 1.2000, 1.1936, 1.1900
Euro Sinks After ECB, US & UK GDP Numbers Eyed
Here are the latest developments in global markets:
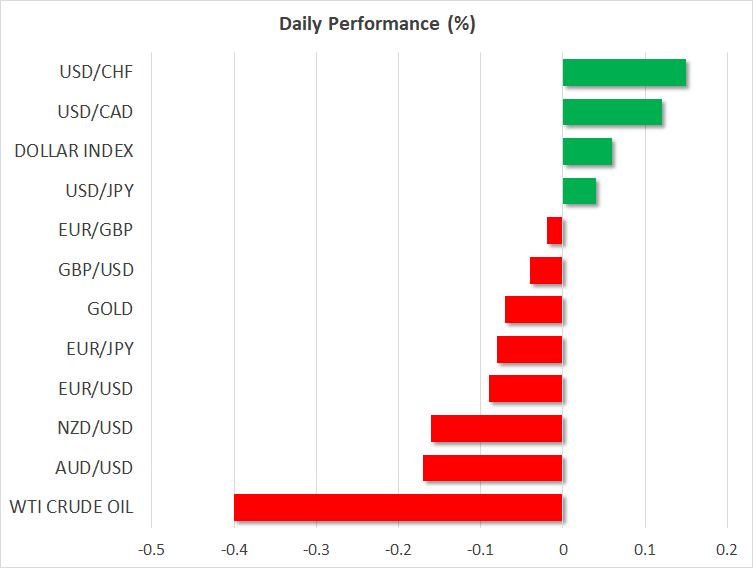
FOREX: The US dollar index is higher on Friday, but by less than 0.1%, building on the gains it posted yesterday. Meanwhile, the euro was on the back foot, after the ECB maintained a relatively cautious tone in yesterday's policy gathering.
STOCKS: US markets edged higher yesterday, as a raft of encouraging earnings releases and a pullback in US bond yields supported risk appetite. The tech-heavy Nasdaq Composite climbed by 1.64%, boosted by AMD (+13.7%), Facebook (+9.0%), and Amazon (+3.95%). Meanwhile, the S&P 500 and the Dow Jones gained 1.04% and 0.99% respectively. As for today, futures tracking the Nasdaq 100 are in positive territory, but those tracking the Dow and S&P are flashing red. The optimism in Wall Street rolled over into Asia too. In Japan, the Nikkei 225 and the Topix rose by 0.66% and 0.29% correspondingly, while in Hong Kong, the Hang Seng was 0.71% higher. Europe was a similar story, with futures tracking all the major indices pointing to a higher open today.
COMMODITIES: Oil prices declined a little on Friday, though they still remain elevated near their recent highs. WTI and Brent crude are lower by 0.4% and 0.5% respectively, giving back some of the gains they posted on Thursday. The broader narrative in the oil market remains one of expectations for sanctions on Iran soon, speculation around which has limited any significant declines in prices recently, even despite signs that US production continues to soar. In precious metals, gold is nearly 0.1% lower today, extending losses from yesterday. The safe haven continues to be battered by a recovering dollar, and evidently by the latest improvement in Wall Street's risk appetite as well. The easing tensions on the Korean peninsula may have also played a role. It is currently trading near the $1,316 per ounce mark, and should these factors continue to weigh on demand, the next stop may be the March lows, at $1,307.
Major movers: Euro sinks after Draghi fails to impress bulls; BoJ drops timeframe for hitting inflation goal
The euro tumbled yesterday, following the ECB's policy meeting. The Bank kept both its policy and guidance unchanged, as was widely expected, so attention quickly turned to the press conference by President Draghi. While the ECB chief began by indicating the economy remains on a strong course, he quickly acknowledged that there has been some moderation in economic data as of late.
And although he noted this slowdown appears to be owed to transitory factors that will soon fade, Draghi also entertained the possibility it may prove to be more persistent, indicating the Bank will monitor such risks closely. He even added the Governing Council hadn't discussed the future of the QE program at all, as that would be premature without a better understanding of the slowdown. Implicitly, Draghi left open the scenario that the ECB may delay its normalization plans should the situation deteriorate further, likely disappointing those looking for clear signals that the days of QE are drawing to an end.
While the ECB still looks set to scale back its purchases later this year, with some signaling of that likely to come in the summer, economic data bear even closer monitoring, as further deterioration could make the Bank more cautious to head towards the exit.
Overnight, the Bank of Japan (BoJ) also remained on hold. Interestingly, policymakers removed from the policy statement a phrase that previously stated the Bank expected to hit its inflation target in the fiscal year 2019. Officials also made several references to downside risks surrounding the economy and inflation. While the yen barely reacted to these signals, the Bank's cautiousness should put to bed any surviving speculation that an exit from ultra-loose policies is looming anytime soon. In isolation, this is a factor supporting a weaker yen, though the currency's direction will also depend on how risk sentiment evolves, given its status as a safe haven.
In geopolitics, Kim Jong Un became the first leader of North Korea to cross over into South Korea since the peninsula was divided, as part of talks aimed at defusing tensions.
Elsewhere, both aussie/dollar and kiwi/dollar are roughly 0.2% lower today, continuing to extend their recent collapse.
Day ahead: US & UK GDP figures in focus
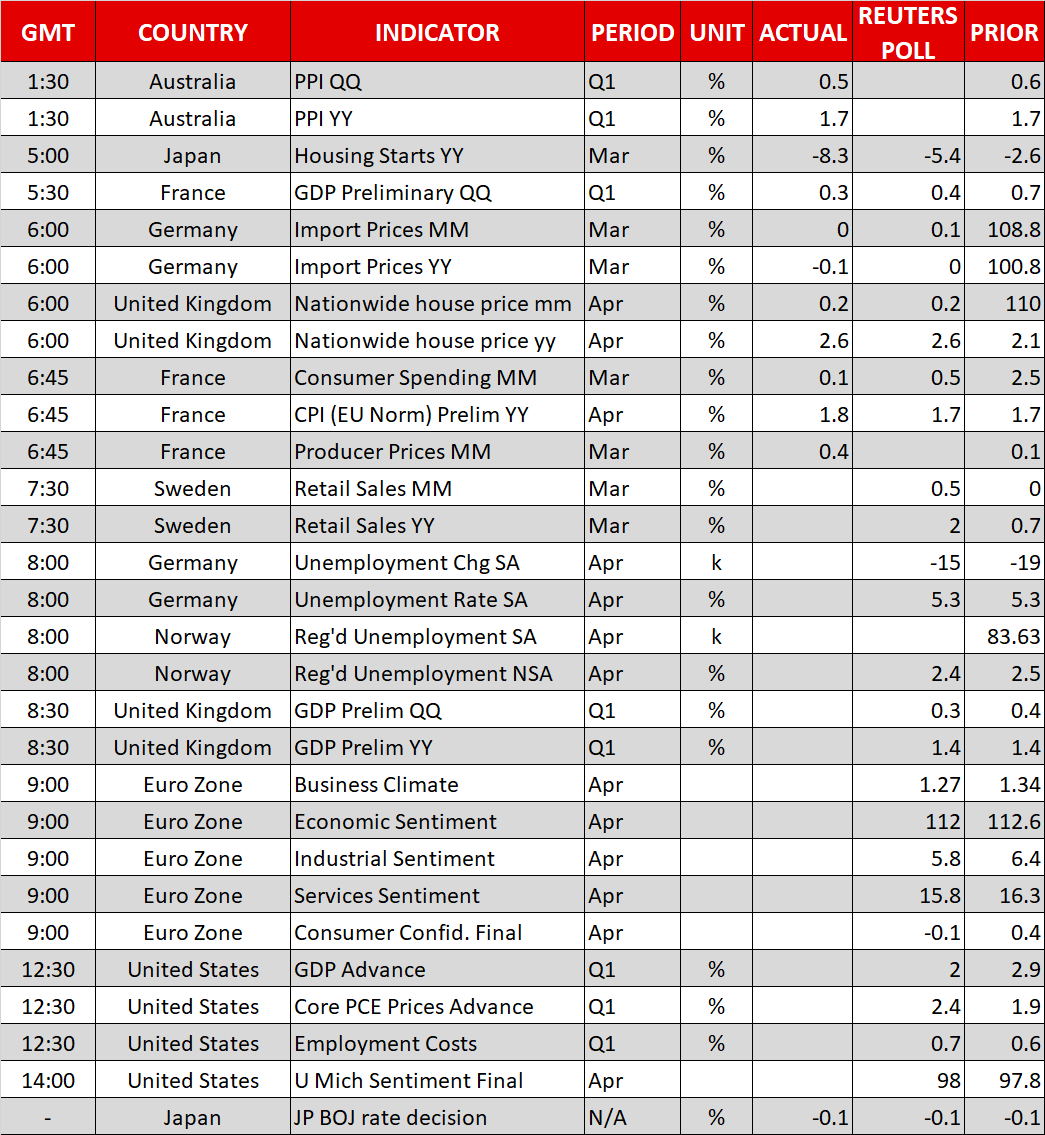
Friday's economic calendar is a rather packed one and includes the release of preliminary Q1 GDP estimates out of the US and the UK.
At 0800 GMT, Germany will see the release of unemployment-related figures. The unemployment rate in the eurozone's largest economy is forecast to remain unchanged at 5.3%, this being the lowest since the nation's reunification in 1990.
The attention will next turn to the UK, with preliminary Q1 GDP estimates scheduled to be made public at 0830 GMT. On a yearly basis, the pace of growth is anticipated to stand at 1.4%, the same as in Q4 2017, while on a quarterly basis it is projected to tick down to 0.3% from 0.4%. The data have the capacity to, at least in part, shape expectations for May's Bank of England meeting and will thus be closely watched; UK overnight index swaps currently put the odds for a rate hike close to 50%.
The eurozone will be on the receiving end of numerous business surveys at 0900 GMT, all of them expected to show further deterioration of sentiment in April. Meanwhile, the European Commission's Directorate General for Economic and Financial Affairs will release its final reading on consumer confidence for the month of April at the same time. The relevant print is expected to enter into negative territory for the first time since October.
Later in the day, the focus will shift to the US, with the advance estimate of Q1 GDP growth due at 1230 GMT. A considerable decline in the pace of expansion is projected relative to the preceding quarter – 2.0% expected vs 2.9% in Q4. The US economy routinely delivers poorer growth figures in the beginning of the year though, and FOMC members are likely to look past first-quarter weakness when they gather next week for their two-day monetary policy meeting concluding on May 2. Other releases that will be made public alongside GDP numbers are Q1 employment costs, as well as the advance estimate of core PCE prices for the same quarter, while the University of Michigan's final print on consumer sentiment for the month of April will be released at 1400 GMT.
Energy giants Chevron and Exxon Mobil will be reporting their Q1 results before the US market open.
In oil markets, the Baker Hughes oil rig count is due at 1700 GMT.
Policymakers making appearances include ECB Executive Board member Yves Mersch who will be speaking on the unwinding of QE at 0800 GMT. At the same time, the Swiss National Bank President Jean Studer and the Bank's Chairman Thomas Jordan will be speaking at the central bank's General Meeting of Shareholders. BoE Governor Mark Carney will be making an appearance as well (1400 GMT), though the topic of discussion renders comments on monetary policy unlikely.
In politics, a meeting between US President Donald Trump and German Chancellor Angela Merkel at the White House might attract interest, while the Korean summit with the leaders of North and South Korea meeting is also considered of importance.
Technical Analysis: USDJPY short-term bullish; trades not far below 2½-month high
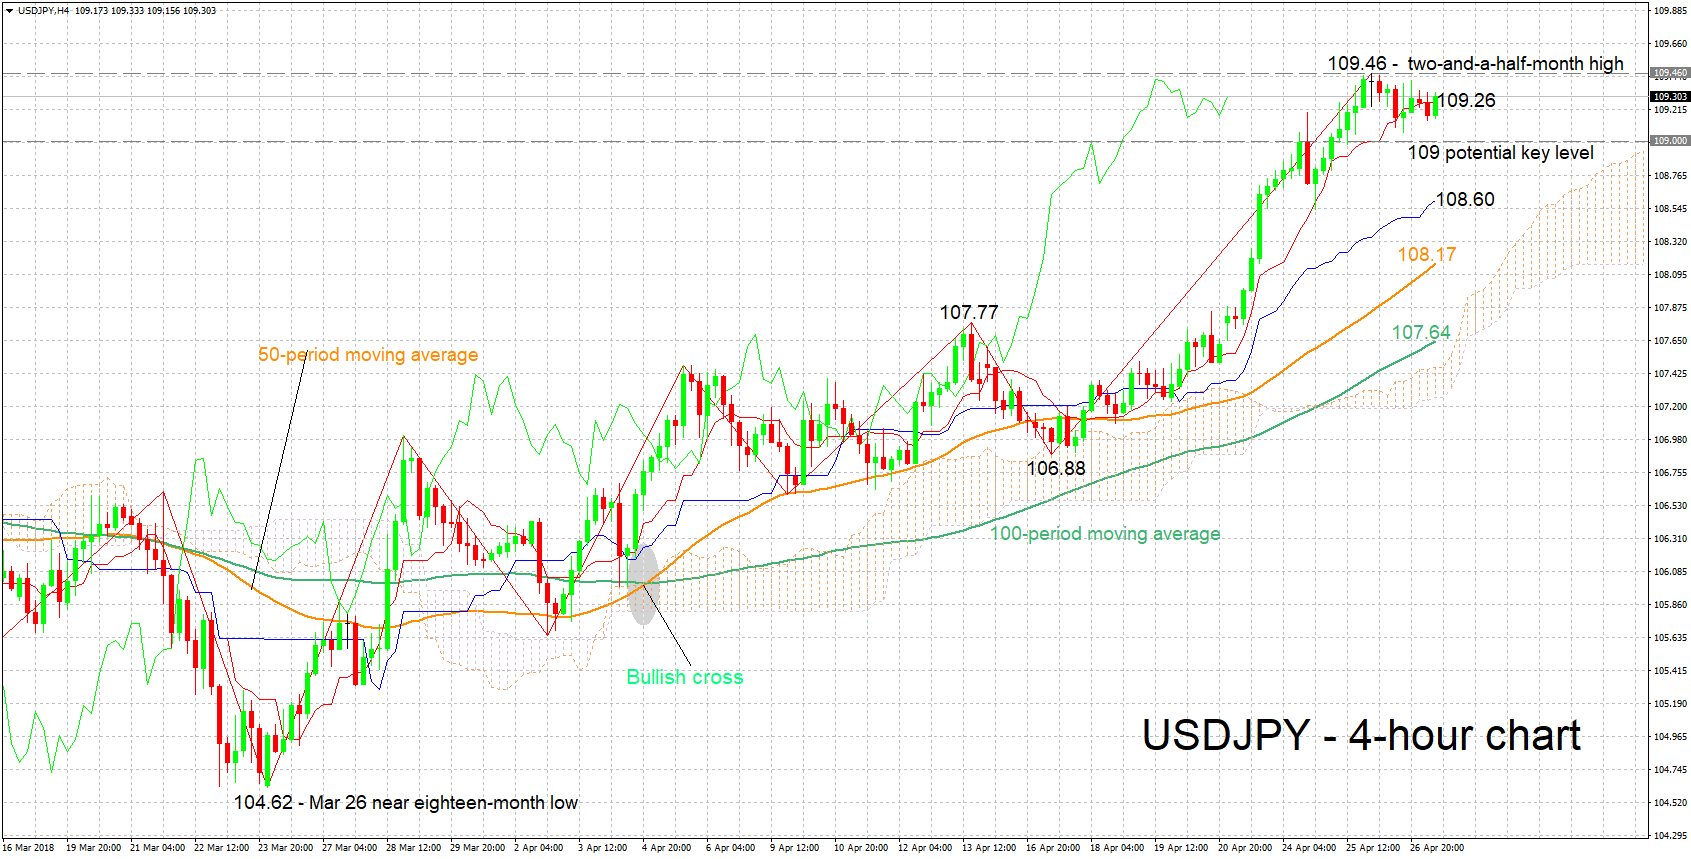
USDJPY has posted significant gains in recent days, rising to a two-and-a-half-month high of 109.46 on Thursday. It currently trades roughly 16 pips below that peak. The Tenkan- and Kijun-sen lines are positively aligned in support of a bullish picture in the short-term.
Upbeat US GDP figures are likely to boost the pair which currently may be meeting resistance around the Tenkan-sen at 109.26 (the Tenkan-sen itself being violated). A more decisive break above could meet a barrier around yesterday's high of 109.46 and the 110 round figure which may be of psychological importance.
Weaker-than-anticipated US figures might push the pair lower. Support in case of declines could come around the 109 handle and further below from the range around the Kijun-sen at 108.60.