Sample Category Title
AUDUSD – Fresh Extension Lower Offsets Reversal Signal From Wednesday’s Doji
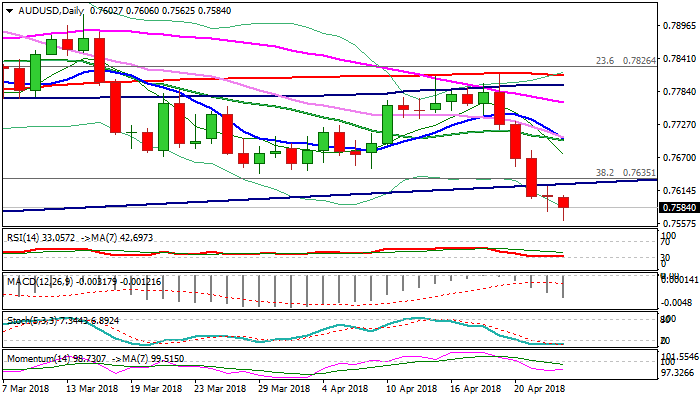
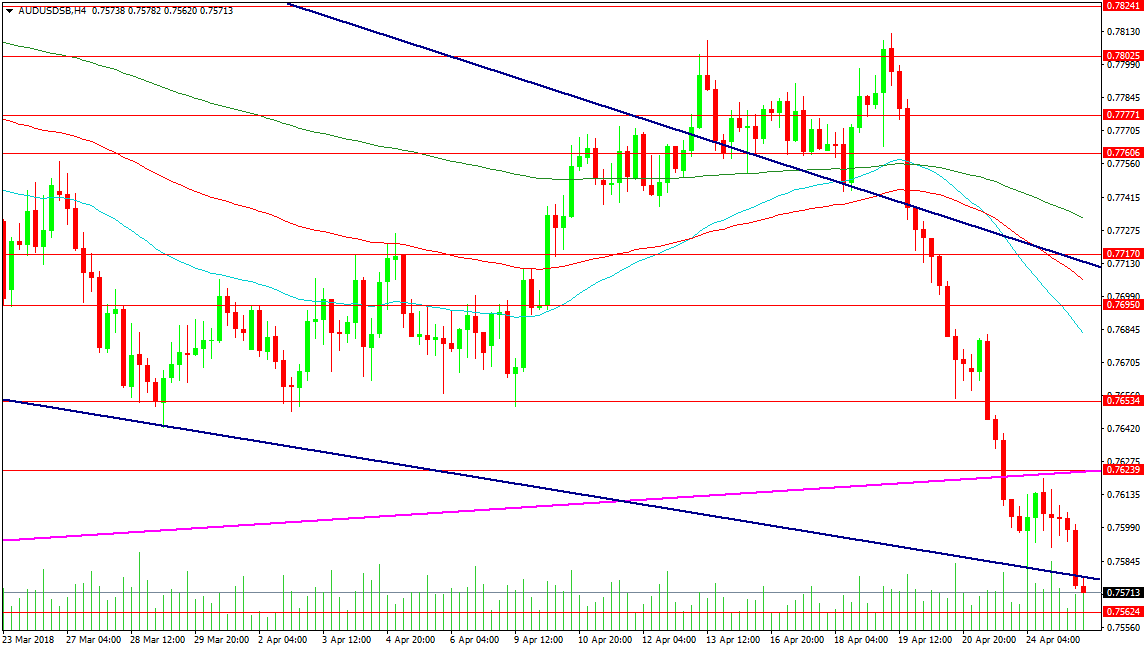
The Aussie extended weakness on Wednesday and hit new 4 ½ month low at 0.7562, offsetting initial reversal signal on Tuesday's Doji candle.
Bears so far ignore oversold conditions on daily chart and keep the pair under pressure, as greenback continues to trend higher, boosted by rising US yields.
Repeated close below main bull-trendline, drawn off 0.6826 (2016 low) was strong bearish signal for extension of broader downtrend from 0.8135 (2018 high) for test of next strong support at 0.7500 (08/12 Dec lows).
However, corrective action should be anticipated before final push towards 0.7500 target, with broken trendline (0.7623) and broken Fibo support / former base (0.7635/40) marking solid barriers, guarding falling 10SMA (0.7687) and converged 10/20SMA's (0.7700).
Res: 0.7606, 0.7623, 0.7640, 0.7687
Sup: 0.7562, 0.7530, 0.7500, 0.7480
GBPUSD Is Holding Within Narrow Consolidation, Bearish Outlook While 1.40 Caps
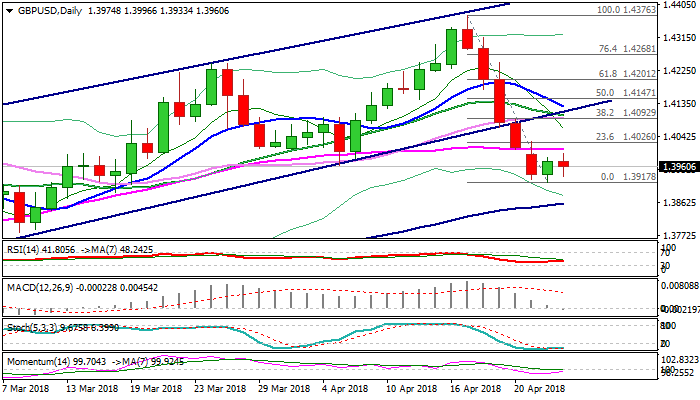
Cable holds within narrow congestion between the top of thin daily cloud (1.3931) and psychological 1.40 barrier (also55SMA) on Wednesday.
Steep six-day fall from 1.4376 peak found footstep at cloud top and entered consolidation, also being supported by M&A news.
Upside attempts were so far limited as overall sentiment remains negative and was recently boosted dovish comments from BoE Governor Carney.
On the other side, strongly oversold slow stochastic on daily chart and north-turning 14-d momentum, show initial signs of correction.
Bullish scenario requires firm break above initial 1.40 pivot to signal extended recovery and expose next strong barrier at 1.4100 (20SMA).
Otherwise, bearish pressure would persist while 1.40 barriers caps and keep the downside vulnerable of fresh probes through daily cloud (1.3931/01) and extension towards 100SMA (1.3859).
Res: 1.4000, 1.4030, 1.4100, 1.4126
Sup: 1.3931, 1.3901, 1.3868, 1.3859
Forex Analysis: USDCAD And AUDUSD
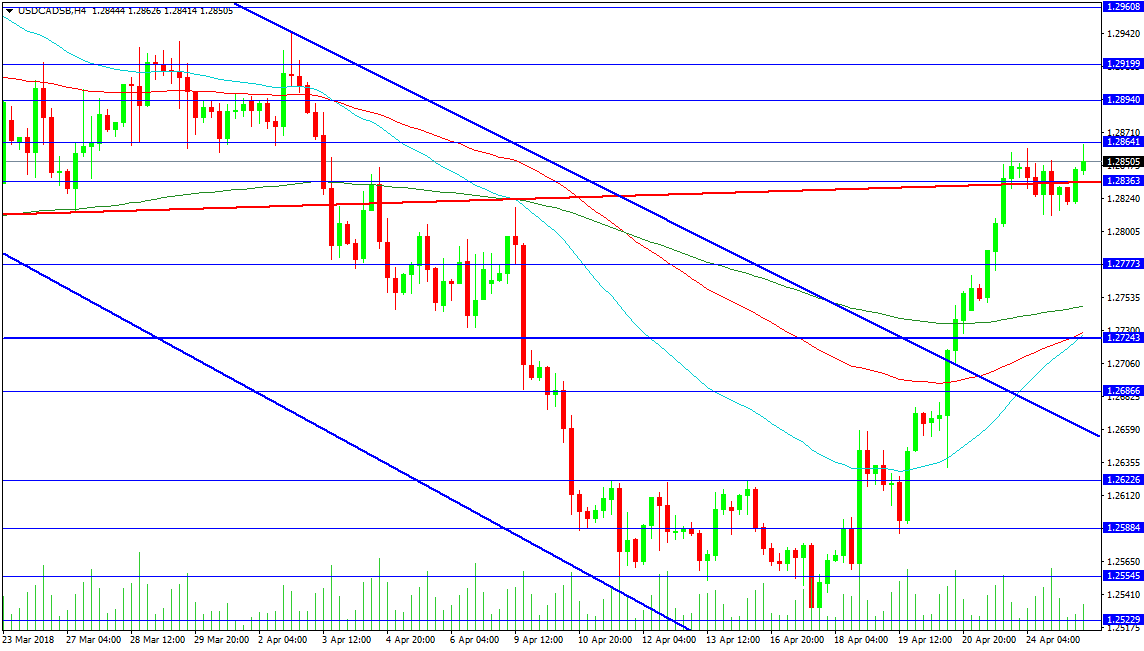
The USDCAD pair has returned to the previously broken red trend line and is consolidating in the area around 1.28363. A break higher targets today’s high at 1.28641, followed by 1.28940 and the area of resistance containing the recent highs, starting at 1.29200 up to 1.29300. A move that is sustained over this zone could push prices to test 1.30000. The March high is at 1.31241, but 1.30704 needs to be overcome on the next leg higher.
Support is found at 1.27773, with a stronger area at 1.27243 that is supported by the 100 and 50-period moving averages. The 200-period MA is above this area at 1.27472 and it may bar the way lower. The ultimate support comes from the top of the recent descending channel that the price broke higher from on Friday, at 1.27092. This trend line is now at 1.26620. A loss of this line would lead to a false breakout and a lower reaction in price targeting the recent low of 1.25230.
AUDUSD
This pair has taken a leg lower, creating a false breakout last week, which collapsed on Thursday. The major support at 0.76534 was taken out on Monday, dragging price down to the current level around 0.75700. The low created here is 0.75624, with a loss of this level targeting 0.75000. Should price push further down, 0.74990 is the low from December, with 0.74200 below, followed by 0.73700. Traders will be eying the 0.68264 level as the low from 2016 and citing the break below the magenta trend line as a bear flag trigger.
A break above 0.76240 gives long positions some hope, but the black trend line was retested as resistance today at 0.75750 and it held. As mentioned, the 0.76534 level is now resistance, with 0.76950 above and 0.77170 a key area. The 0.77600 level was where selling accelerated from the double top level of 0.78100.
USD Goes Through The Roof
Stronger US rates fuel dollar rally
The greenback continued to extend gains on Wednesday amid an upside shift in the US Treasury curve. Since the beginning of the week, the buck appreciated against all major currencies, with EM currencies taking the biggest hit. The Mexican pesos tumbled more 1.90% as USD/MXN rose to 18.95, while the South African rand gave up 2.6%, with USD/ZAR rising to 12.45.
EM currencies were not the only one to suffer from this basic shift, as G10 currencies have not emerged unscathed. The New Zealand Dollar took the biggest hit, as investors continued to unwind long bullish bets, and slid another 0.50% this morning. The Japanese yes also went under heavy selling pressure as USD/JPY climbed back above the 109 threshold.
Several factors can explain the rapid appreciation of the US dollar over the last few days. Obviously, the surge in interest rates has made long dollar trade more appealing – the 10-year Treasury yield broke the 3% mark, while the 2-year one hit 2.5% as inflation expectations kept improving – but the ongoing sell-off in the equity market has also helped to deteriorate the overall risk sentiment, which benefits the dollar.
Swiss commercial balance slackening amid weaker swissie
Known for its strong trade balance surplus, Switzerland is giving signs of deceleration for Q1, though Swiss watch exports continues its expansion for five consecutive months, valued at 4.80% (CHF 1.67 billion), largely above 6-year average of -0.50% (due to mid-2015 – 2016 export decrease). Impeded by a strong rise of imports in Q1 of 4.10% (prior: 4.80%), essentially caused by chemicals and pharmaceuticals (+14.70% for Q1), March trade balance remains at three-and-a-half years low (CHF 1.77 billion, 6-year average: CHF 2.60 billion) as the cost of imports is beginning to be felt due to convergence towards USD/CHF parity and EUR/CHF at 1.20 since the beginning of Q3 2017.
Since Swiss National Bank tone towards swissie valuation is being that it is highly valued (to distinguish with previous “overvalued” statement) while maintaining a dovish view on the national economy, there is no reason to expect any EUR/CHF massive changes above or below 1.20 for the moment.
USD/CHF strong rise since March 2018 (+4.26%) continues, recovering from 0.9188 low (16/02/2018) and approaching 0.99. The pair approaches the 0.9830 range in the short-term.
EURUSD Remains At The Back Foot As Daily Cloud Caps Recovery Attempts And Awaiting Fresh Signals From ECB
The Euro holds firmly in red in early European trading on Wednesday after recovery attempts in Asia were repeatedly capped by daily cloud base.
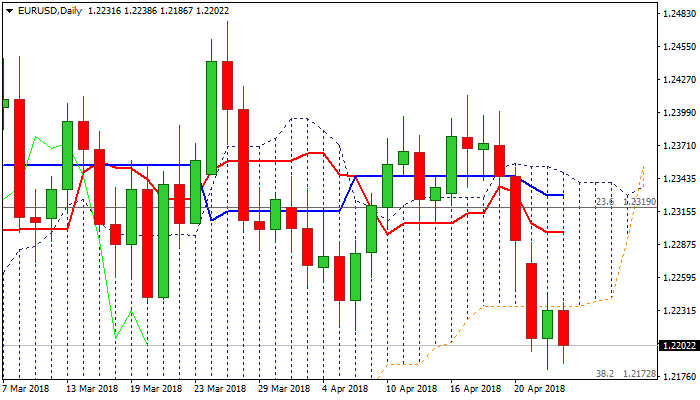
Hopes of forming a base above key Fibo support at 1.2172 after Tuesday’s action was rejected at 1.2181 and subsequent bounce left long-tailed bullish daily candle, are fading.
Thick daily cloud continues to weigh, along with strong dollar and expectations for dovish stance from the ECB tomorrow, which could further weaken the structure.
Firm break below key supports at 1.2172 (Fibo 38.2% of 1.1553/1.2555 / low of multi-month 1.2153/1.2555 consolidation of larger rally from 1.0340), would generate strong bearish signal for deeper correction of 1.0340/1.2555 advance and expose psychological 1.2000 support (also 200SMA).
Meanwhile, the pair may hold in extended congestion between 1.2172 and daily cloud base, awaiting fresh signals from the ECB.
Res: 1.2210, 1.2245, 1.2290, 1.2305
Sup: 1.2172, 1.2153, 1.2092, 1.2054
EURJPY Retreats Following The Touch On Two-Month High Near 133.50
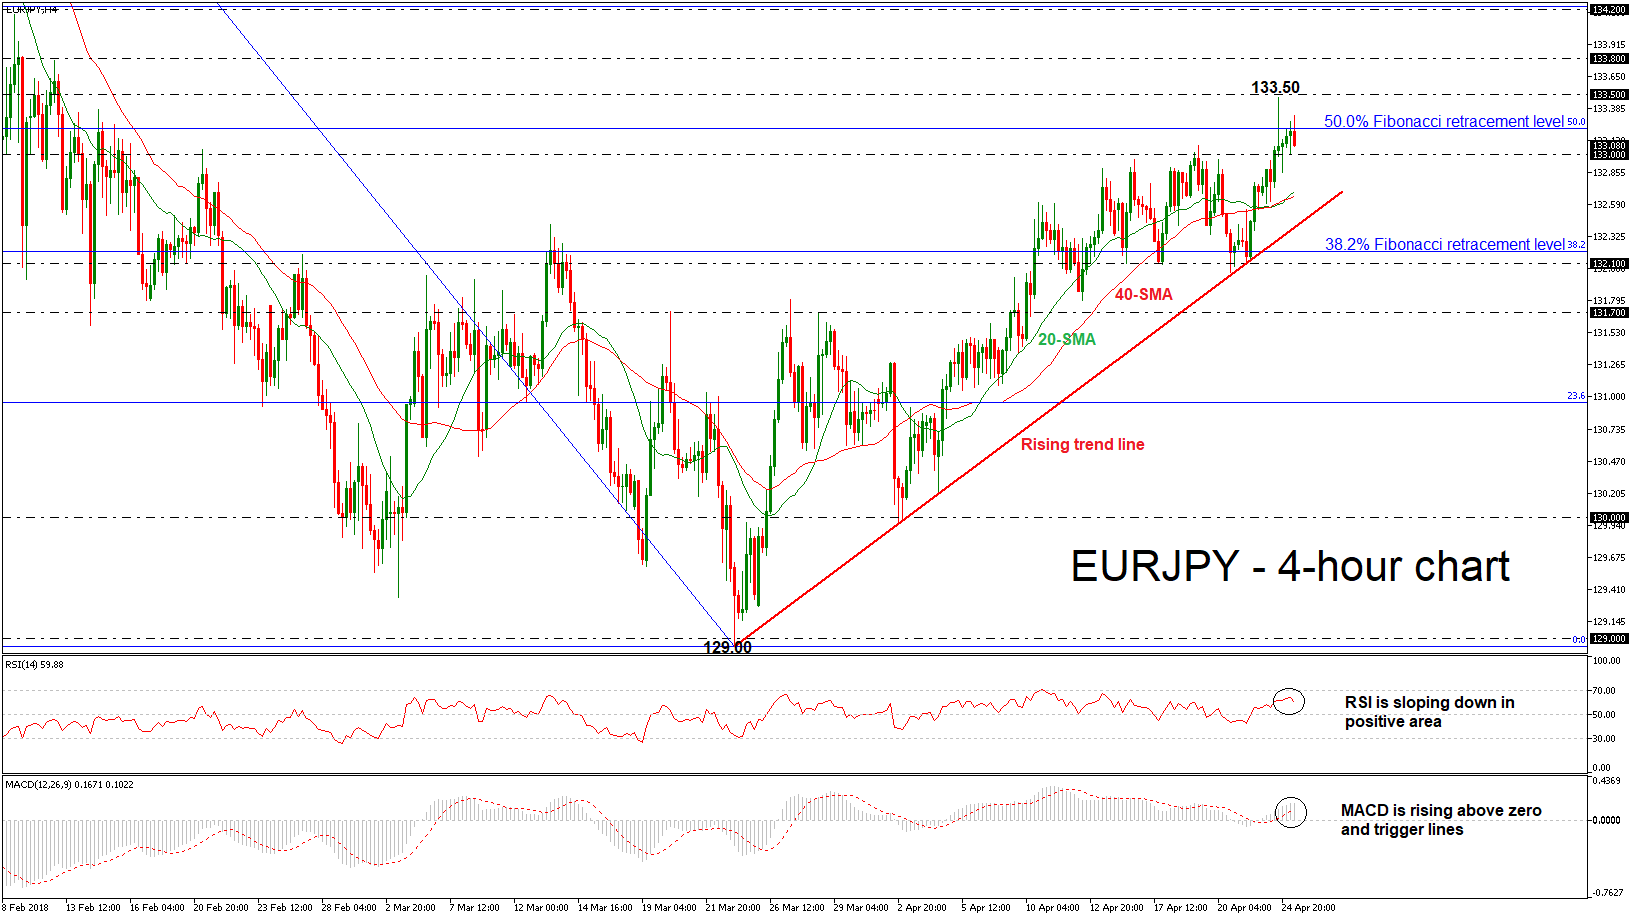
EURJPY has advanced considerably following the rebound on the 132.10 support level, which coincides with the rising trend line. The ascending movement has been holding since March 23, creating a bullish correction of the major bearish movement in medium-term. During yesterday’s session the pair recorded a new more than two-month high near 133.50, however, currently, the price is capped by the 50.0% Fibonacci retracement level of 133.20 of the downleg from 137.50 to 129.00.
Momentum indicators are pointing to a neutral to positive bias, in the 4-hour chart, with the RSI just below the 70 level with weak momentum. However, the MACD oscillator is moving sharply higher, reinforcing the bullish structure. As a side note, the 20- and 40-simple moving averages (SMAs) created a bullish crossover, signaling further gains.
In the event of a jump above the 50.0% Fibonacci, which is acting as major resistance, this would open the way towards the 133.50 barrier. A break of this level would drive the price further up until the 133.80 resistance, taken from the high on February 12.
Should prices reverse lower, immediate support could come from the moving averages around 132.70 at the time of writing before being able to re-touch the 38.2% Fibonacci mark of 132.20. A drop below this level would shift the short-term outlook to bearish as it would take the pair towards the 131.70 support hurdle.
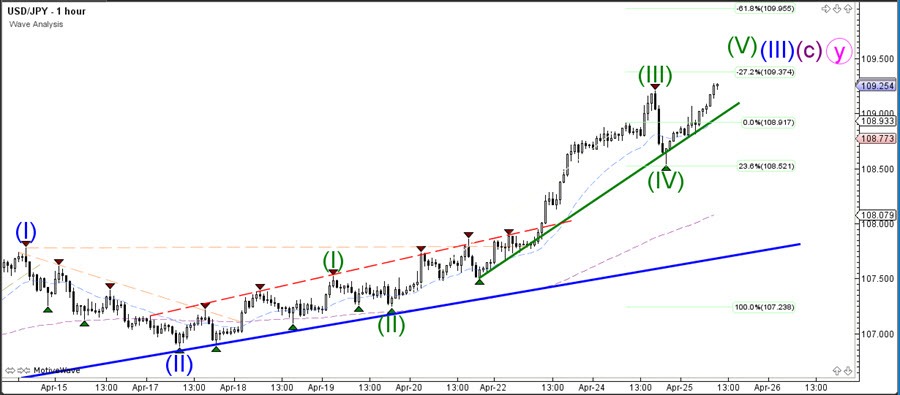
USD/JPY Bullish Break Offers Space Till 110 Resistance
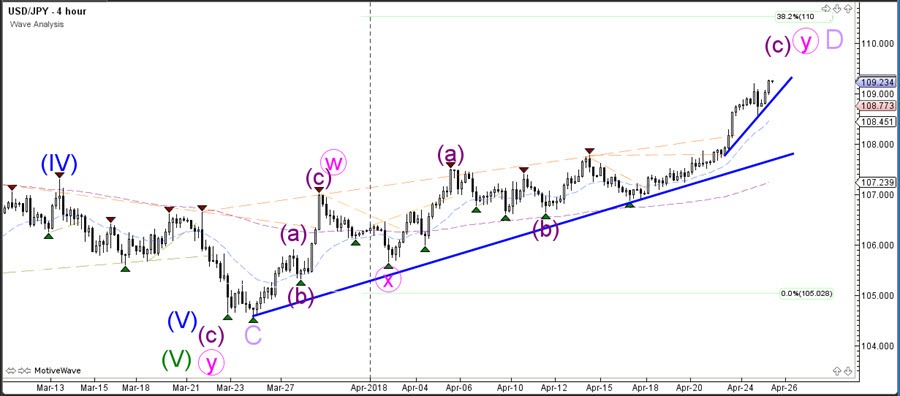
The USD/JPY broke above the 109-round level which made the previous wave structure unlikely. Price could instead be building a triangle pattern on the higher time frames and there is a chance that price is now building a wave D (purple) of that triangle. The 38.2% Fib is around 110 and could be the first resistance level where price might make a bearish retracement.
The USD/JPY broke above the 109-round level which made the previous wave structure unlikely. Price could instead be building a triangle pattern on the higher time frames and there is a chance that price is now building a wave D (purple) of that triangle. The 38.2% Fib is around 110 and could be the first resistance level where price might make a bearish retracement.
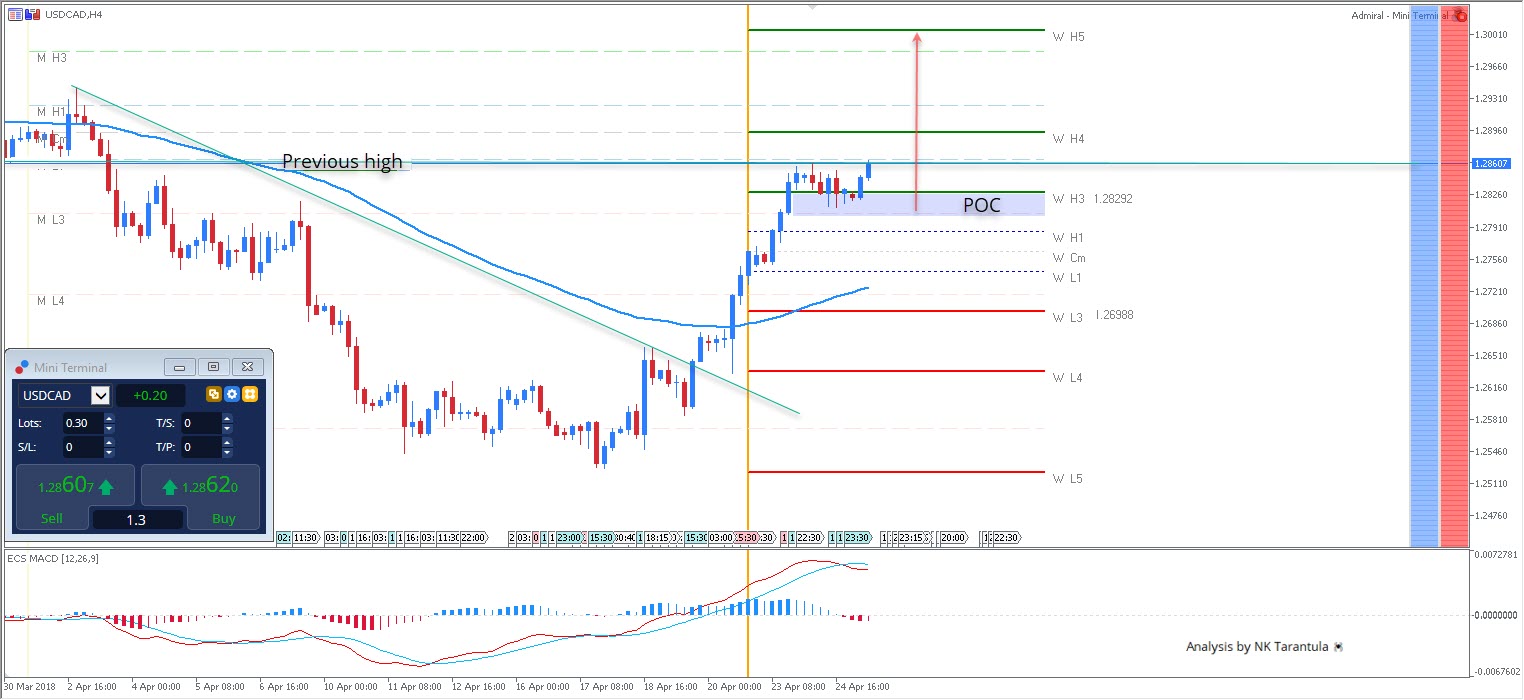
USD/CAD Rounded Bottom Possibly Targeting 1.2940
The USD/CAD has formed a rounded bottom pattern. We can see that the previous high is being tested and if the 4h closes above it (1.2862), we should see a continuation to the upside. POC 1.2800-20 could also spike the pair in the case of retracement. The first target is 1.2894 and the final target is 1.2940. However the BOC Governor, Mr.Poloz will speak later today so pay attention to higher volatility. Ideally, for bulls, the price should remain above 1.2790.
W L3 - Weekly Camarilla Pivot (Weekly Interim Support)
W H3 - Weekly Camarilla Pivot (Weekly Interim Resistance)
W H4 - Weekly Camarilla Pivot (Strong Weekly Resistance)
M H4 - Monthly Camarilla Pivot (Very Strong Monthly Resistance)
M L3 – Monthly Camarilla Pivot (Monthly Support)
M L4 – Monthly H4 Camarilla (Very Strong Monthly Support)
POC - Point Of Confluence (The zone where we expect price to react aka entry zone)
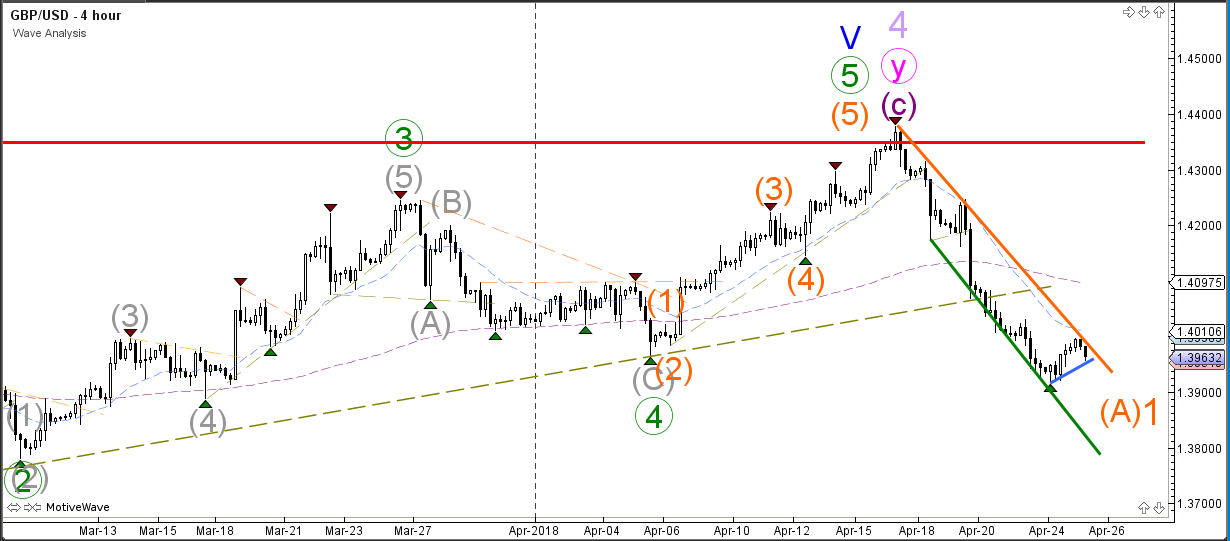
GBP/USD Bear Flag Pattern at Downtrend Channel Resistance
The GBP/USD made a bullish retracement back to the resistance trend line within the larger downtrend channel. A bearish bounce at the channel resistance could send price lower within a potential wave 1 (or A) but a bullish breakout however could indicate the start of a larger correction within wave 2 (or B).
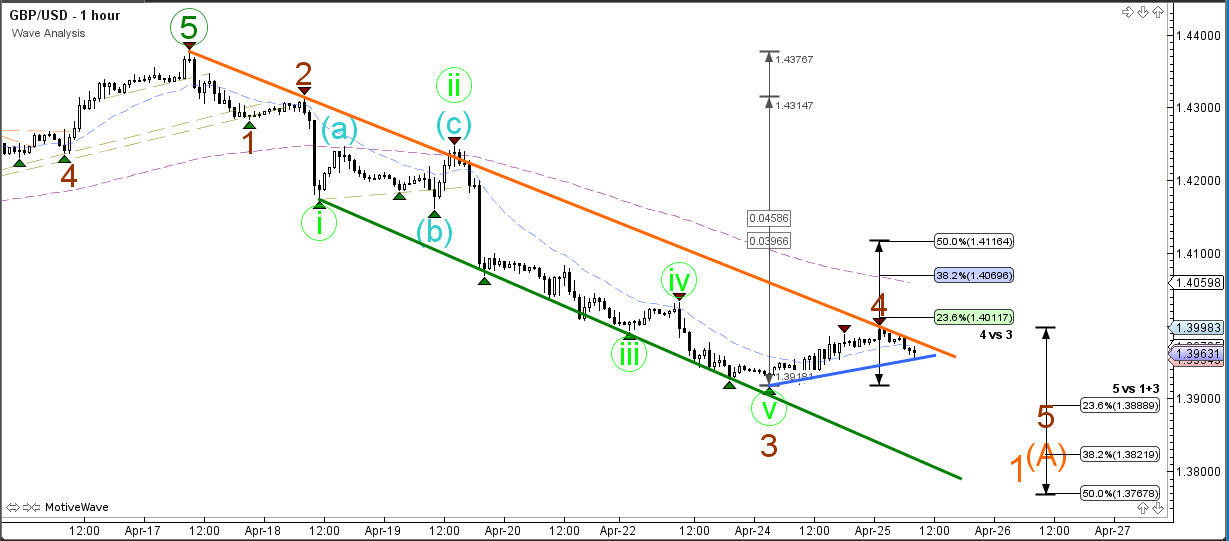
The GBP/USD made a mild correction which looks like a bear flag chart pattern. This bear flag is often a continuation pattern and could be part of wave 4 (brown). A bearish breakout could send price lower and extend the bearish momentum towards the Fibonacci targets of wave 5. Eventually a bullish retracement could occur and price will make a larger bullish correction. For the moment, the bearish pressure could take price down for a new lower low.
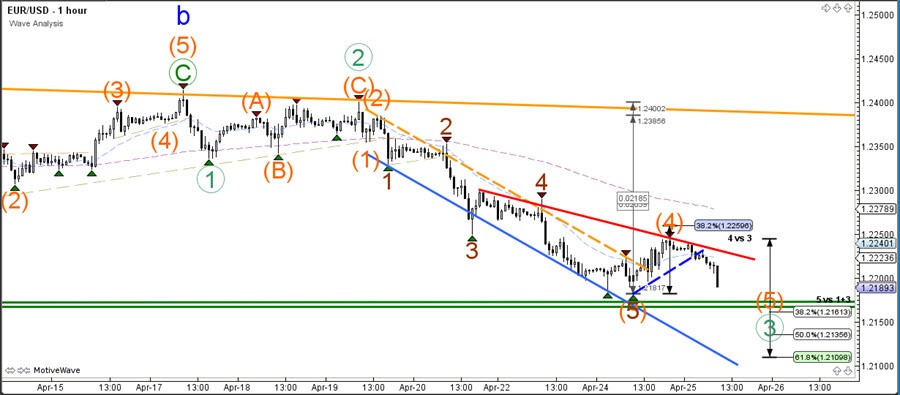
EUR/USD Breaks Bear Flag And Continues Wave 3
The EUR/USD bearish momentum is still intact but price has not been able to break below the key support zone as yet. For the moment, the bearish pressure is most likely part of a wave C (blue) which would become confirmed once price makes a strong bullish bounce via a bullish 5 wave pattern on lower time frame. This would also confirm the wave 4 (pink) correction whereas a bearish break below the 50% Fibonacci level would make a downtrend more likely.
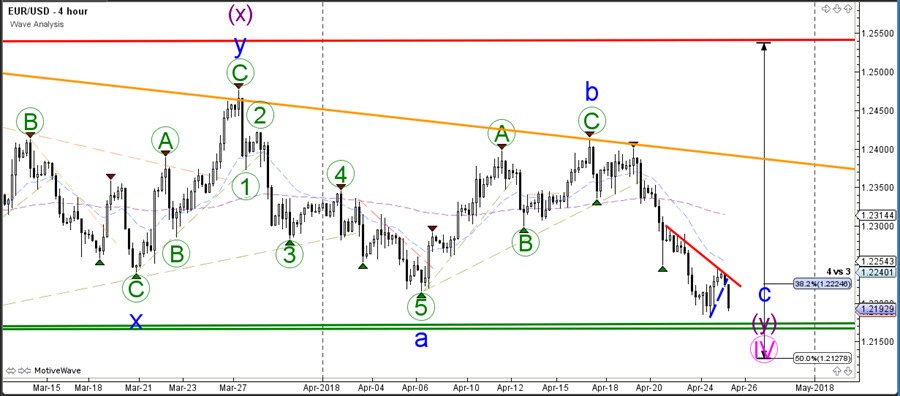
The EUR/USD bearish momentum is still intact but price has not been able to break below the key support zone as yet. For the moment, the bearish pressure is most likely part of a wave C (blue) which would become confirmed once price makes a strong bullish bounce via a bullish 5 wave pattern on lower time frame. This would also confirm the wave 4 (pink) correction whereas a bearish break below the 50% Fibonacci level would make a downtrend more likely.