Sample Category Title
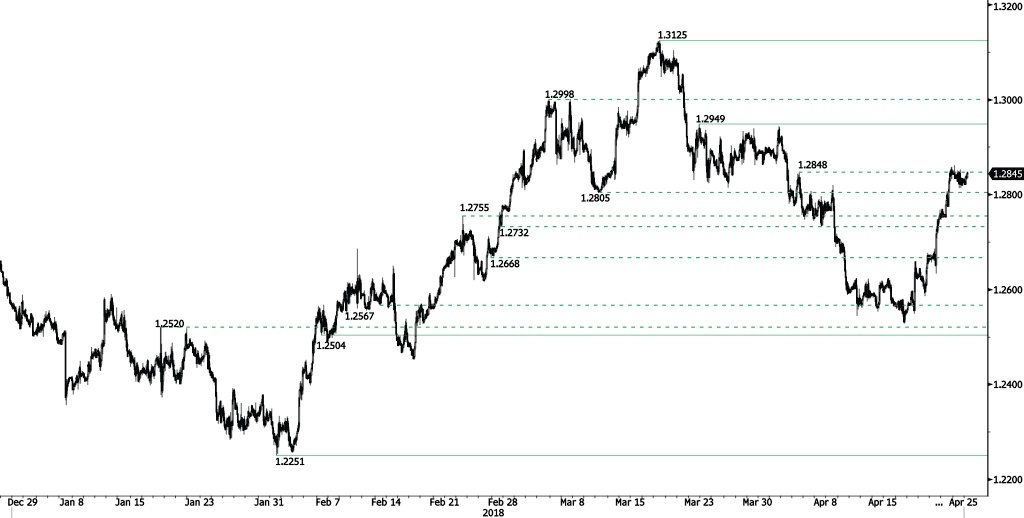
USD/CAD Edging Higher
USD/CAD recovery phase from 1.2528 low (17/04/2018) starts back, heading along the 1.2860 range. Hourly support and resistance are given at at 1.2504 (06/02/2018 low) and 1.2949 (22/03/2018 high). The technical structure suggests short-term increase.
In the longer term, the pair is trading between resistance point at 1.3805 (05/05/2017 high) and support at 1.2128 (18/06/2015 low). Strong resistance is given at 1.4690 (22/01/2016 high). The pair is likely to head lower. The pair is trading above its 200 DMA.
USD/CHF Strengthening
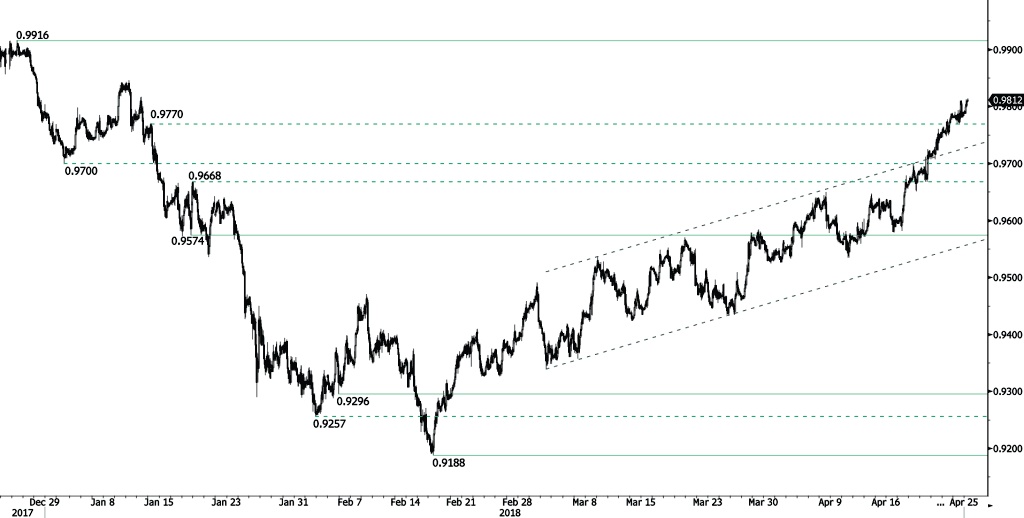
USD/CHF rise starts back, trading above 0.98 and approaching the 0.9820 range. The bullish pattern started from 0.9188 (16/02/2018 low) continues. The pair is contained between hourly support and resistance given at 0.9574 (17/01/2018 low) and 0.9916 (26/12/2017 high). The technical structure suggests short-term upward trading moves.
In the long-term, the pair is still trading in range since 2011 despite some turmoil when the SNB unpegged the CHF. Key support lies at 0.9072 (07/05/2015 low) while resistance at 1.0344 (15/12/2016 high) is distanced. The technical structure favours a long term bullish bias since the unpeg in January 2015.
USD/JPY Trading Above 109
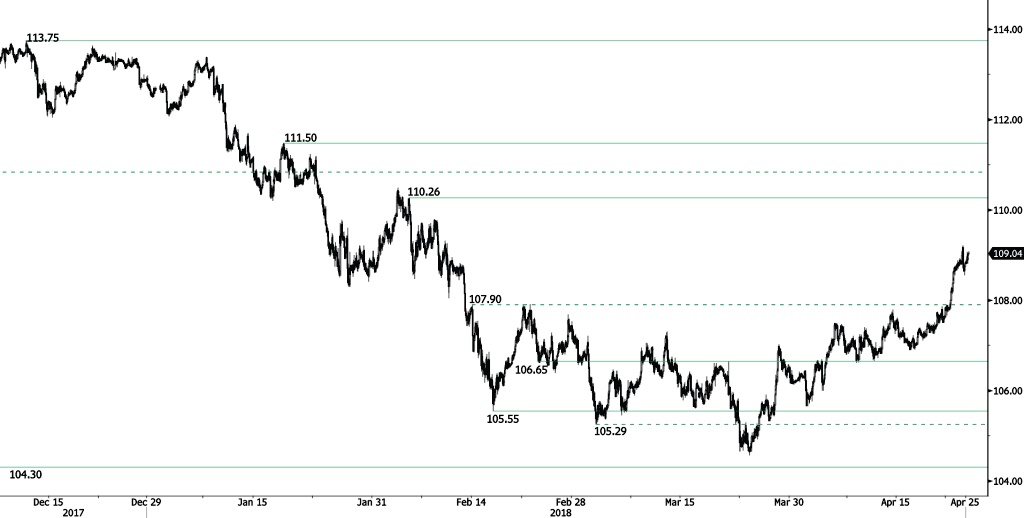
USD/JPY bounce from 106.90 low continues, the pair trades above 109 and is heading along the 109.10 range. The bearish pattern started in January 2018 is weakening. Hourly support and resistance are given at 106.65 (22/02/2018 low) and 110.26 (05/02/2018 high). The short-term technical structure suggests continued shortterm upward moves.
We favor a long-term bearish bias. Support remains at 101.20 (09/11/2016 low). A gradual rise toward the major resistance at 125.86 (05/06/2015 high) seems unlikely. Expected to decline further support at 101.20 (09/11/2016 low). The pair trades below its 200 DMA
GBP/USD Decreasing
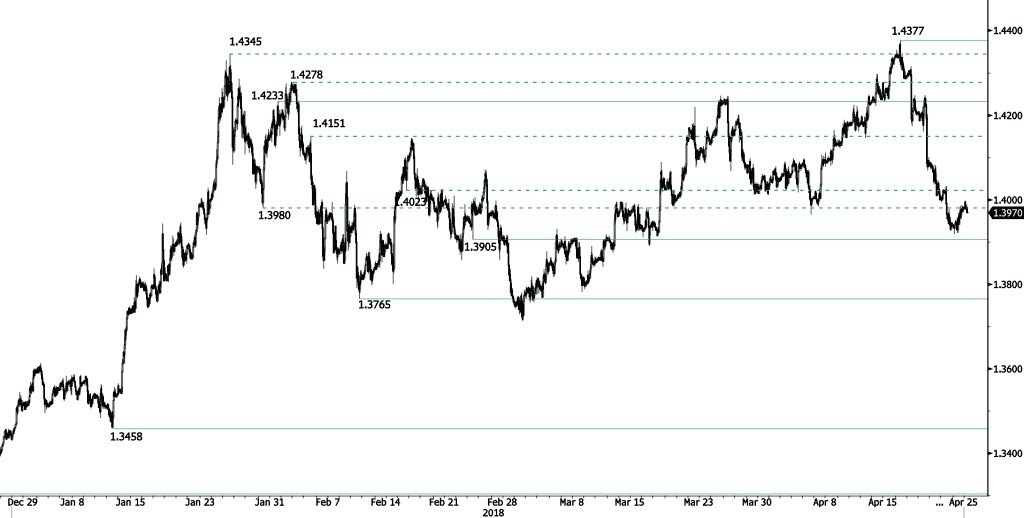
GBP/USD recent bounce stops. The pair is trading at 1.3970, heading along the 1.3960 range. The pair is currently trading at mid-March low. Hourly support and resistance are given at 1.3905 (23/02/2018 low) and 1.4233 (31/01/2018 high). The technical structure suggests shortterm decrease.
The long-term technical pattern is reversing. The Brexit vote had paved the way for further decline but the pair is moving to 2016 highs. Long-term support and resistance are given at 1.1841 (07/10/2017 low) and 1.5018 (24/06/2016 high).
EUR/USD Slight Decrease
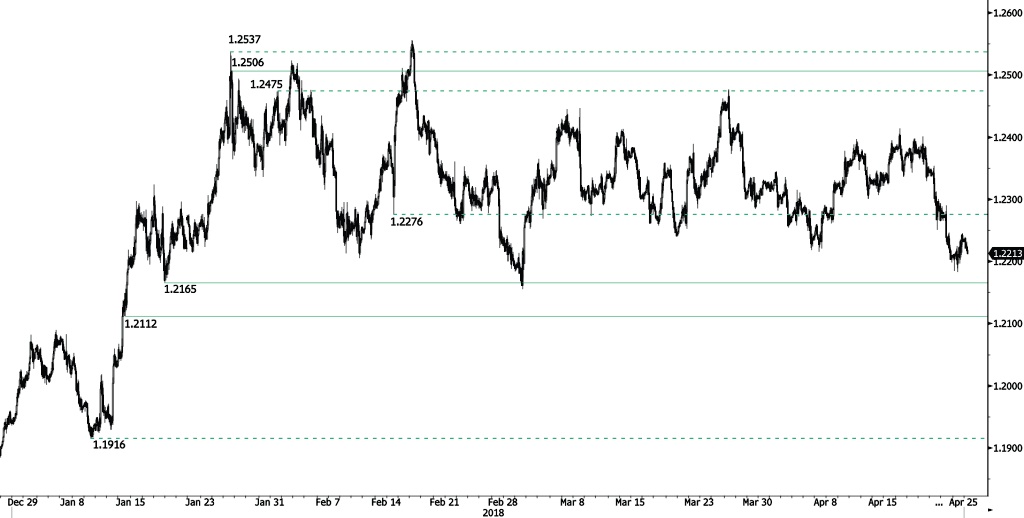
EUR/USD is decreasing following recent rise at 1.2245. Heading along the 1.2210 range. The pair is currently maintained between hourly support and resistance given at 1.2165 (17/01/2018 low) and 1.2506 (25/01/2018 high). The technical structure suggests short-term downward trading moves.
In the longer term, the momentum is turning largely positive. We favor a continued bullish bias. Key resistance is holding at 1.2886 (15/10/2014 high) while strong support lies at 1.1554 (08/11/2017 low).
Forex Technical Analysis: EUR/USD, USD/JPY, GBP/USD
EUR/USD
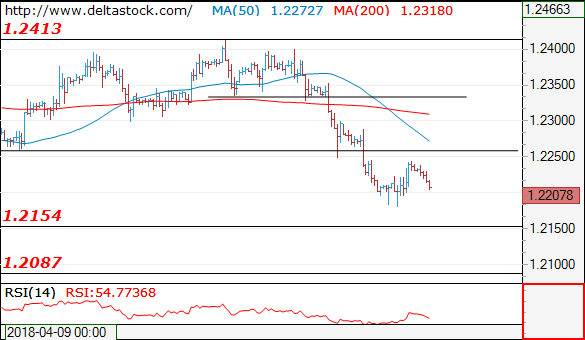
Current level - 1.2207
The resistance at 1.2250 is able to cap the upside, for another leg downwards, to 1.2090 major static support.
| Resistance | Support | ||
| intraday | intraweek | intraday | intraweek |
| 1.2250 | 1.2412 | 1.2160 | 1.2160 |
| 1.2335 | 1.2560 | 1.2090 | 1.2090 |
 USD/JPY
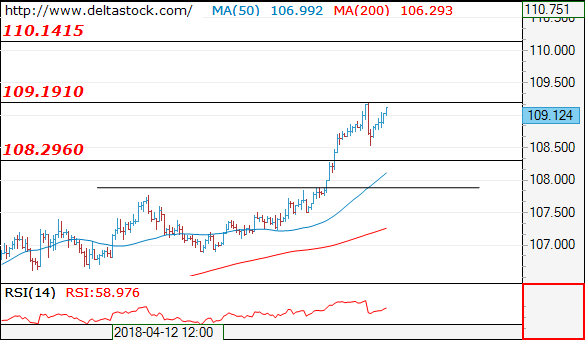
Current level - 109.14
The overall outlook remains positive, for a break though 109.20, towards 110.20.
| Resistance | Support | ||
| intraday | intraweek | intraday | intraweek |
| 109.20 | 110.20 | 108.30 | 106.60 |
| 110.20 | 111.90 | 107.90 | 104.60 |
GBP/USD
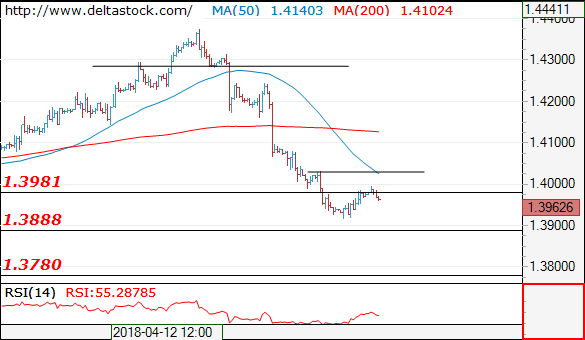
Current level - 1.3962
The recent rebound should be considered corrective, preceding another leg downwards, to 1.3780. Initial intraday resistance lies at 1.3980-90.
| Resistance | Support | ||
| intraday | intraweek | intraday | intraweek |
| 1.3980 | 1.4280 | 1.3880 | 1.3780 |
| 1.4150 | 1.4280 | 1.3780 | 1.3710 |
Oil Inventories Expected To Show A Draw As Prices Fall On Iran Deal News
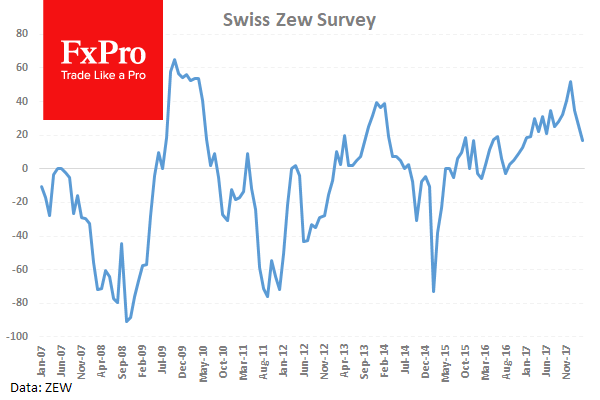
At 08:00 GMT, Swiss ZEW Survey – Expectations (Apr) are expected to be released with a prior reading of 16.7. This data has been weakening since a reading of 52.0 was recorded in December 2017. A reading under 16.7 has not been recorded since December 2016. This illustrates a drop in economic expectations in Switzerland. CHF crosses may see a spike in volatility should the data differ from the expected consensus.
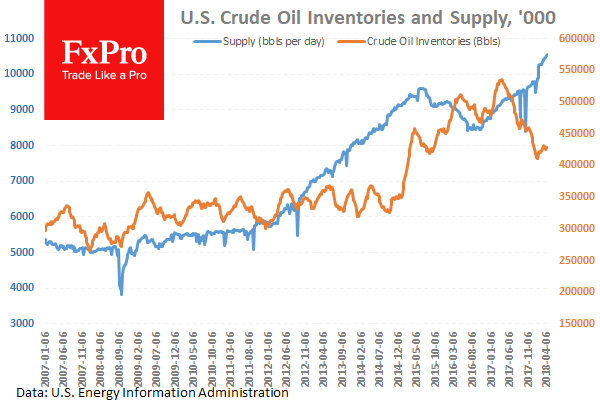
At 14:30 GMT, US EIA Crude Oil Stocks Change (Apr) data will be released with an expectation for a draw of -2.043M barrels, against a previous reading of -1.071M barrels. This data has played its part in sending oil prices higher this month, as supply and demand take over. Seasonally, there is a draw on stocks into high summer, then a recovery before winter demand kicks in. Oil prices sank yesterday from a high of $69.30 to $67.49, as the private inventories data suggested a surprise build of 1.099M, against a consensus of -2.250M. Discussions between the French and US Presidents about a new Iran deal also had an effect. A drop under $67.50 may force downward pressure on prices.
At 20:15 GMT, Bank of Canada Governor Poloz is due to testify along with Senior Deputy Governor Carolyn Wilkins before the Standing Senate Committee on Banking, Trade and Commerce, in Ottawa. CAD crosses may be heavily traded as a result of this event.
EUR/USD Daily Outlook
Daily Pivots: (S1) 1.2194; (P) 1.2220 (R1) 1.2258; More....
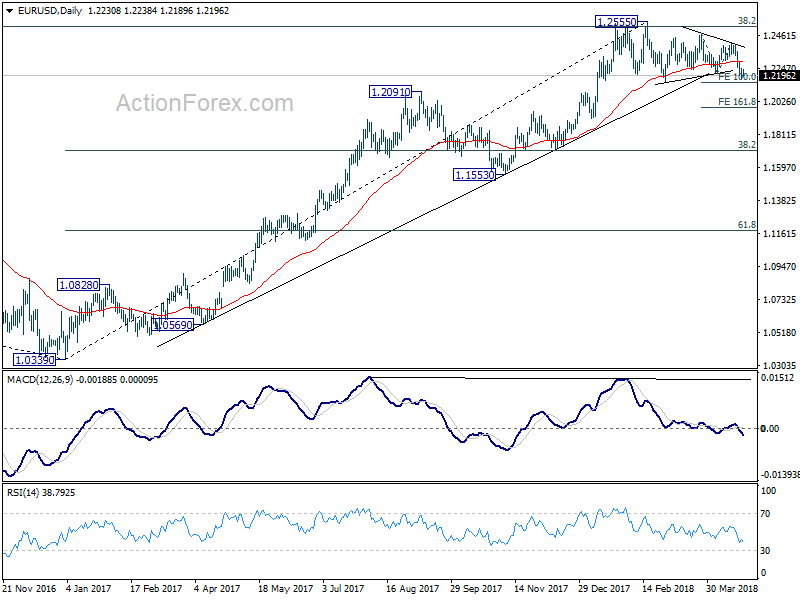
A temporary low is in place at 1.2181 and intraday bias is turned neutral first. Some consolidations could be seen. But upside should be limited by 4 hour 55 EMA (now at 1.2295) to bring another decline. below 1.2181 will target 1.2154 key support level. Decisive break there should confirm the bearish case of medium term reversal. And EUR/USD should then target 161.8% projection of 1.2475 to 1.2214 from 1.2413 at 1.1991.
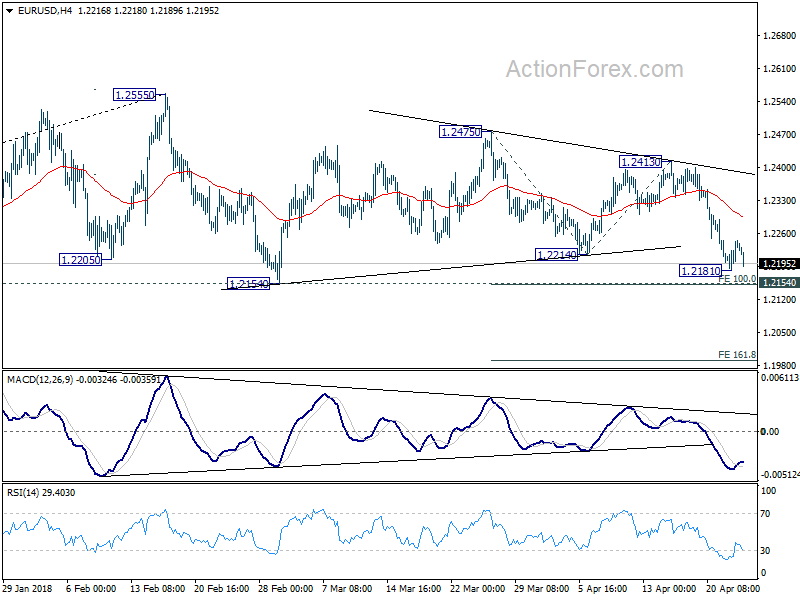
In the bigger picture, key fibonacci level at 38.2% retracement of 1.6039 (2008 high) to 1.0339 (2017 low) at 1.2516 remains intact despite attempts to break. Firm break of 1.2154 support will confirm rejection by this fibonacci level. And in that case, a medium term top is at least formed at 1.2555. EUR/USD should then head back to 38.2% retracement of 1.0339 to 1.2555 at 1.1708 first. We'll look at the structure and momentum of such decline before decision if it's an impulsive or corrective move.
GBP/USD Daily Outlook
Daily Pivots: (S1) 1.3899; (P) 1.3965; (R1) 1.4004; More...
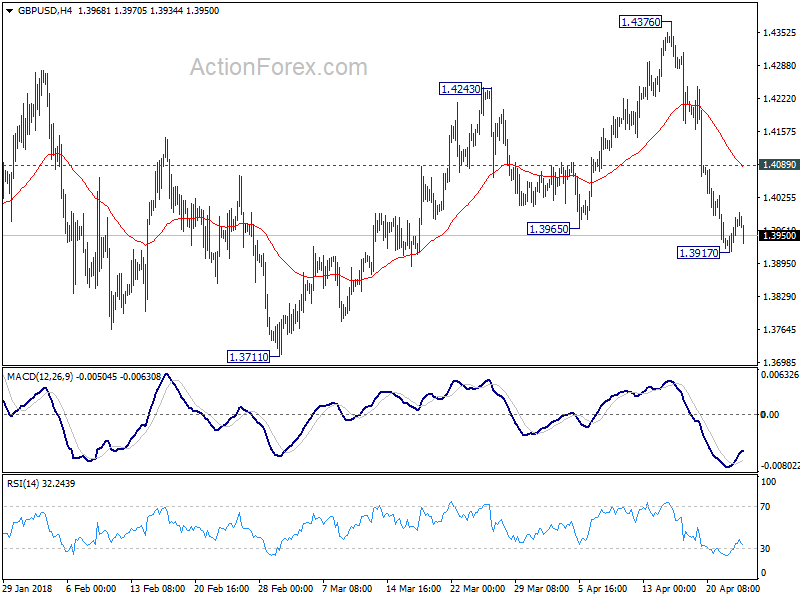
Intraday bias in GBP/USD remains neutral for consolidation above 1.3917 temporary low. Another recovery could be seen. But upside should be limited by 1.4089 minor resistance to bring fall resumption. Below 1.3917 will target 1.3711 key support next. However, firm break of 1.4089 will turn focus back to 1.4376 high instead.
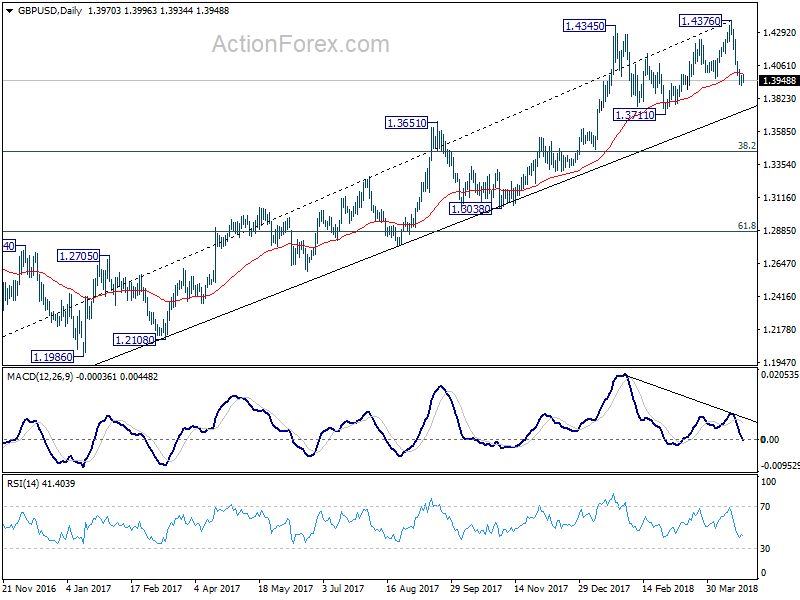
In the bigger picture, bearish divergence condition in daily MACD is raising the chance of medium term reversal. Also, note that GBP/USD has just failed to sustain above 55 month EMA (now at 1.4257). Focus is back on 1.3711 support. Firm break there will confirm medium term reversal and target 38.2% retracement of 1.1936 (2016 low) to 1.4376 at 1.3448 first. Break will target 61.8% retracement at 1.2874 and below. For now, sustained break of 55 month EMA is needed to confirm medium term upside momentum. Otherwise, we won't turn bullish even in case of strong rebound.
USD/CHF Daily Outlook
Daily Pivots: (S1) 0.9749; (P) 0.9768; (R1) 0.9801; More...
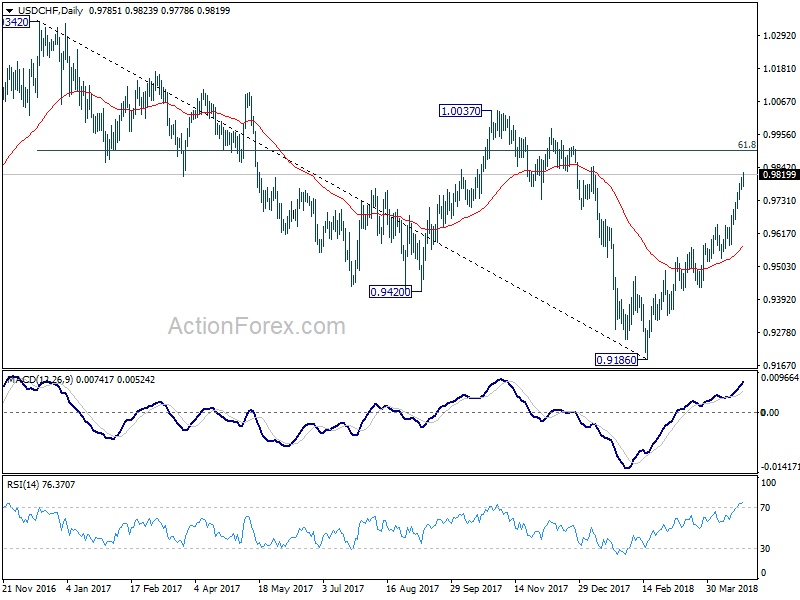
USD/CHF's rise is still in progress and reaches as high as 0.9823 so far. Intraday bias remains on the upside and current rally from 0.9186 should target .9900 fibonacci level next. On the downside, below 0.9766 minor support will turn bias neutral and bring consolidations. But outlook will stay bullish as long as 0.9576 support holds.
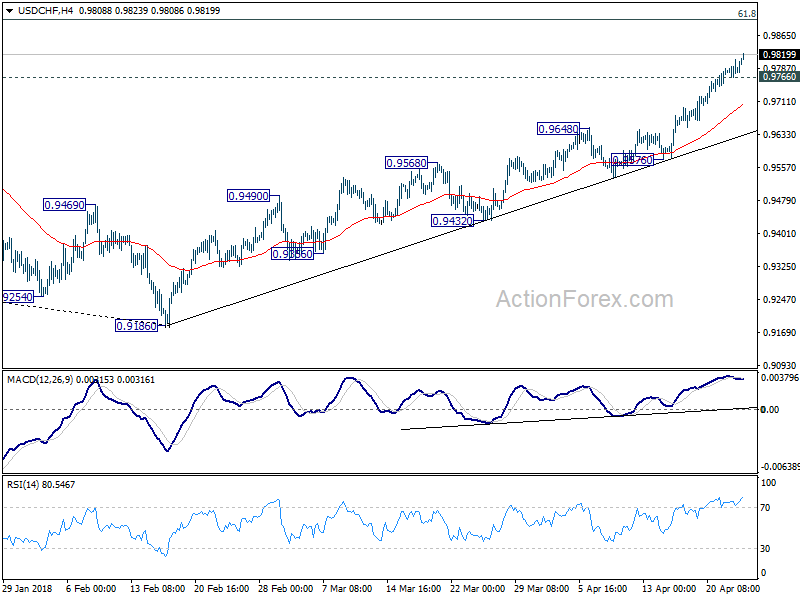
In the bigger picture, fall from 1.0342 is seen as a medium term down trend. The break of 38.2% retracement of 1.0342 (2016 high) to 0.9186 (2018 low) at 0.9626 suggests that it's likely completed at 0.9186 already. Further rally would be seen back to 61.8% retracement at 0.9900 and above. Sustained break there would pave the way to retest 1.0342 key resistance next. This will now be the preferred case as long as 0.9576 support holds.