

Sample Category Title
Britain’s Public-Sector Net Borrowing Unexpectedly Posted A Surplus In March
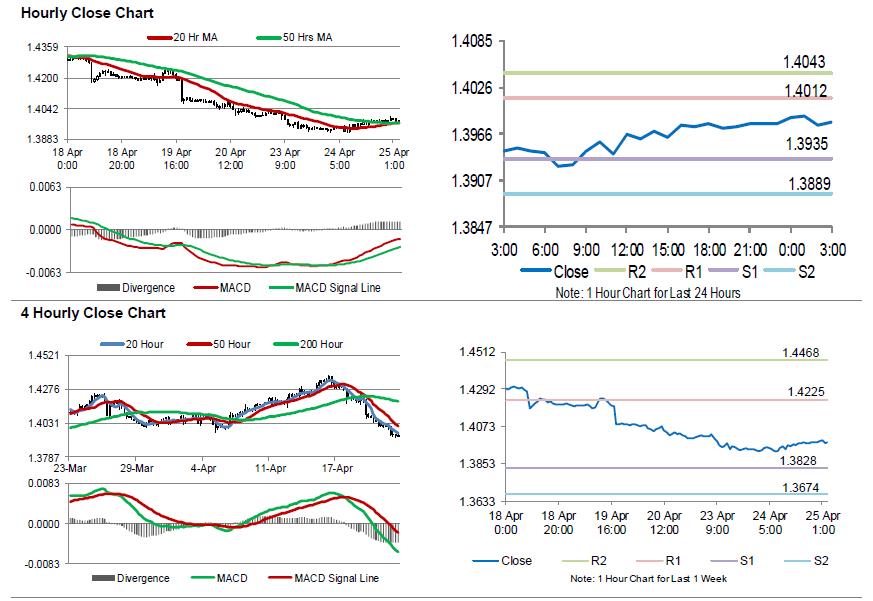
For the 24 hours to 23:00 GMT, the GBP rose 0.3% against the USD and closed at 1.3980.
In economic news, UK's public-sector net borrowing posted a surplus of £0.3 billion in March, compared to a revised surplus of £0.4 billion in the previous month, while market participants had expected a deficit of £1.3 billion.
Other data revealed that the nation's CBI industrial trends total orders remained steady at a level of 4.0 in April, meeting market expectations.
In the Asian session, at GMT0300, the pair is trading at 1.3981, with the GBP trading slightly higher against the USD from yesterday's close.
The pair is expected to find support at 1.3935, and a fall through could take it to the next support level of 1.3889. The pair is expected to find its first resistance at 1.4012, and a rise through could take it to the next resistance level of 1.4043.
With no macroeconomic releases in the UK today, investor sentiment would be determined by global macroeconomic events.
The currency pair is showing convergence with its 20 Hr and 50 Hr moving averages.
Japan’s All Industry Activity Index Rebounded As Expected In February
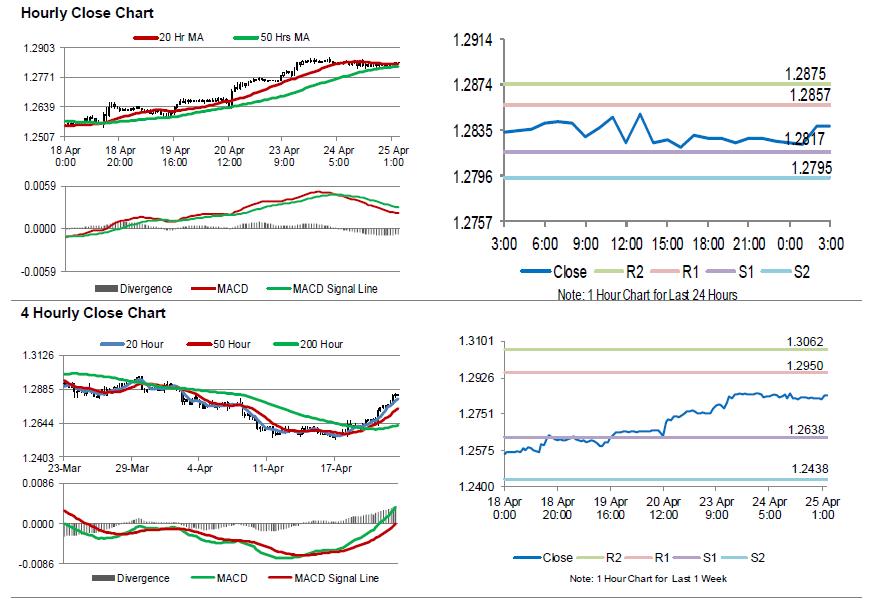
For the 24 hours to 23:00 GMT, the USD declined 0.14% against the CAD and closed at 1.2826.
In the Asian session, at GMT0300, the pair is trading at 1.2839, with the USD trading 0.10% higher against the CAD from yesterday's close.
The pair is expected to find support at 1.2817, and a fall through could take it to the next support level of 1.2795. The pair is expected to find its first resistance at 1.2857, and a rise through could take it to the next resistance level of 1.2875.
The currency pair is showing convergence with its 20 Hr and 50 Hr moving averages.
Loonie Trading Lower In The Asian Session
For the 24 hours to 23:00 GMT, the USD declined 0.14% against the CAD and closed at 1.2826.
In the Asian session, at GMT0300, the pair is trading at 1.2839, with the USD trading 0.10% higher against the CAD from yesterday’s close.
The pair is expected to find support at 1.2817, and a fall through could take it to the next support level of 1.2795. The pair is expected to find its first resistance at 1.2857, and a rise through could take it to the next resistance level of 1.2875.
The currency pair is showing convergence with its 20 Hr and 50 Hr moving averages.
Swiss Trade Surplus Surprisingly Narrowed In March
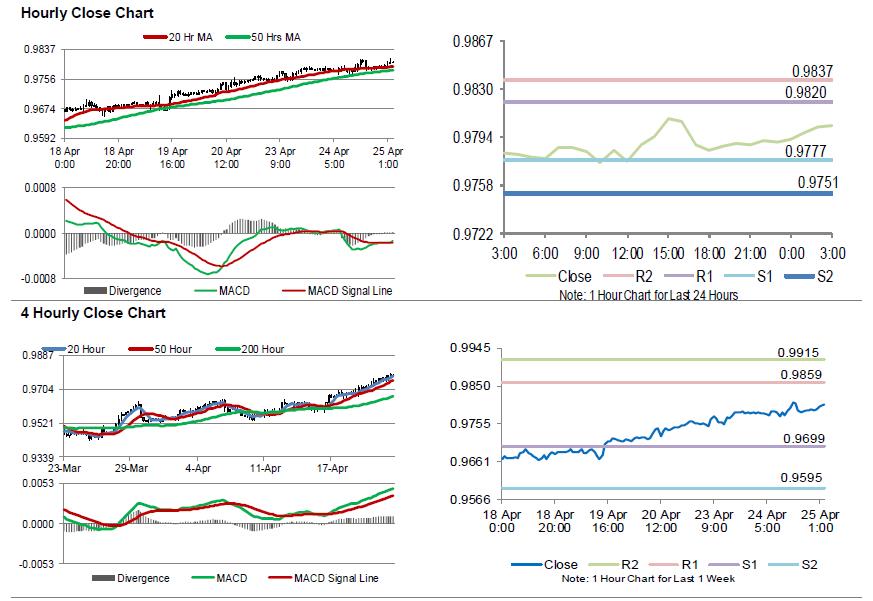
For the 24 hours to 23:00 GMT, the USD rose 0.08% against the CHF and closed at 0.9790.
On the data front, Switzerland's trade surplus unexpectedly narrowed to CHF1.8 billion in March, confounding market expectations for it to widen to 3.2 billion and compared to a surplus of 3.1 billion in the preceding month.
In the Asian session, at GMT0300, the pair is trading at 0.9803, with the USD trading 0.13% higher against the CHF from yesterday's close.
The pair is expected to find support at 0.9777, and a fall through could take it to the next support level of 0.9751. The pair is expected to find its first resistance at 0.9820, and a rise through could take it to the next resistance level of 0.9837.
Ahead in the day, traders would await Switzerland's ZEW expectations index for April.
The currency pair is trading above its 20 Hr and 50 Hr moving averages.
Gold: Yellow Metal Trading On A Weaker Footing This Morning
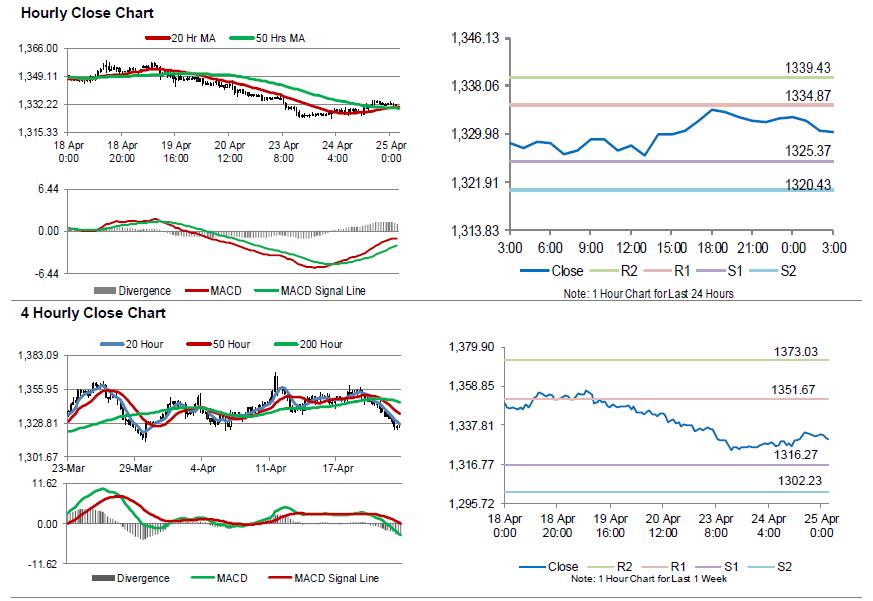
For the 24 hours to 23:00 GMT, Gold rose 0.44% against the USD and closed at USD1332.00 per ounce, as weakness in the US Dollar and a decline in US equities increased demand for the precious yellow metal.
In the Asian session, at GMT0300, the pair is trading at 1330.30, with gold trading 0.13% lower against the USD from yesterday’s close.
The pair is expected to find support at 1325.37, and a fall through could take it to the next support level of 1320.43. The pair is expected to find its first resistance at 1334.87, and a rise through could take it to the next resistance level of 1339.43.
The yellow metal is showing convergence with its 20 Hr and 50 Hr moving averages.
Silver: White Metal Trading Lower This Morning
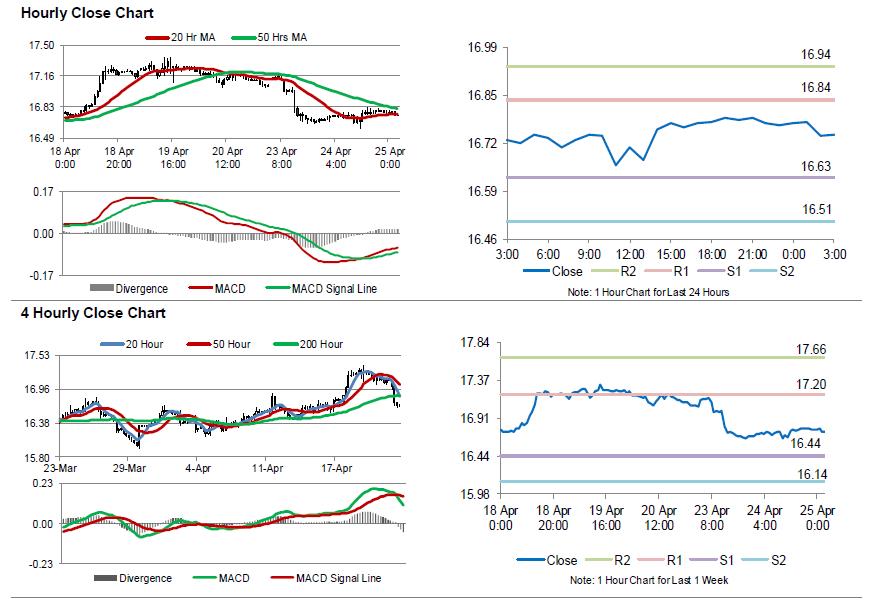
For the 24 hours to 23:00 GMT, Silver rose 0.45% against the USD and closed at USD16.77 per ounce, tracking gains in gold prices.
In the Asian session, at GMT0300, the pair is trading at 16.75, with silver trading 0.15% lower against the USD from yesterday’s close.
The pair is expected to find support at 16.63, and a fall through could take it to the next support level of 16.51. The pair is expected to find its first resistance at 16.84, and a rise through could take it to the next resistance level of 16.94.
The white metal is showing convergence with its 20 Hr moving average and trading below its 50 Hr moving average.
Crude Oil: Oil Extends Its Losses, Ahead Of EIA’s Weekly Crude Oil Stockpiles Data
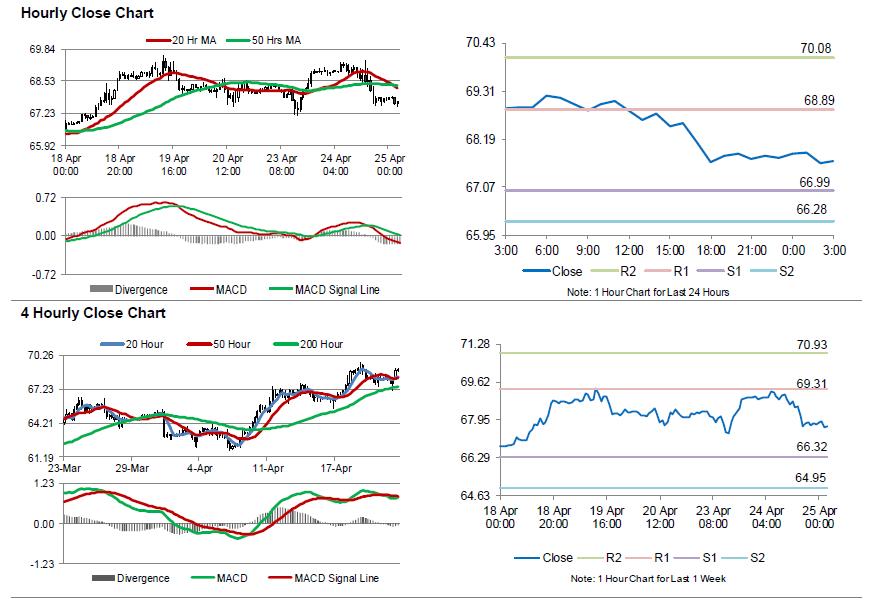
For the 24 hours to 23:00 GMT, Crude Oil declined 1.74% against the USD and closed at USD67.76 per barrel, on news that the US and France are nearing an agreement to preserve the Iran nuclear deal. Additionally, the American Petroleum Institute (API) reported that US crude oil inventories surprisingly rose by 1.1 million barrels to 429.1 million in the week ended 20 April.
In the Asian session, at GMT0300, the pair is trading at 67.69, with oil trading 0.10% lower against the USD from yesterday's close.
The pair is expected to find support at 66.99, and a fall through could take it to the next support level of 66.28. The pair is expected to find its first resistance at 68.89, and a rise through could take it to the next resistance level of 70.08.
Crude oil is trading below its 20 Hr and 50 Hr moving averages.
NZDUSD decline accelerating to 0.7 handle
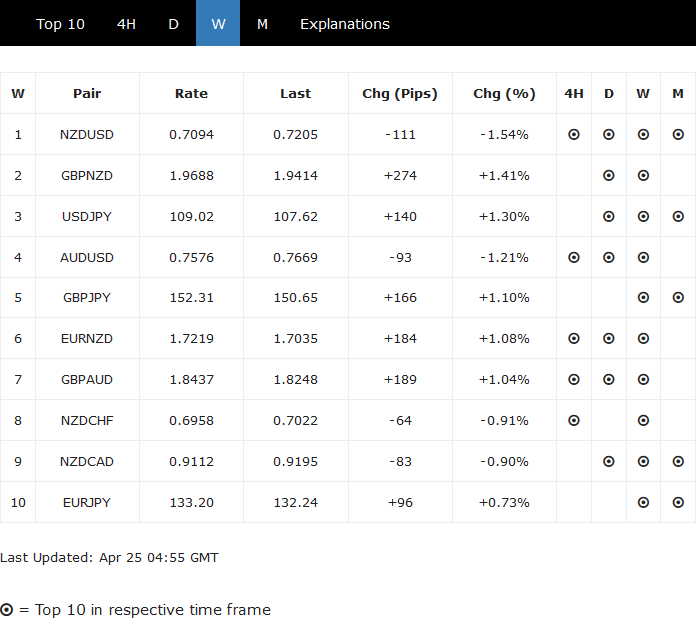
NZD is clearly the weakest one for the week. In particular, selloff in NZD/USD accelerated and continues today, in even in a rather quiet session. NZD/USD is a top 10 mover across all time frame.
Judging from the fact that 100% projection 100% projection of 0.7436 to 0.7152 from 0.7394 is firmly taken out. And there is no sign of bottoming yet. Fall from 0.7436 shouldn't be a correction to rise from 0.6779. It should be a leg in the larger pattern. For now, near term outlook will remain bearish for 61.8% retracement of 0.6779 to 0.7436 at 0.7030 and below.
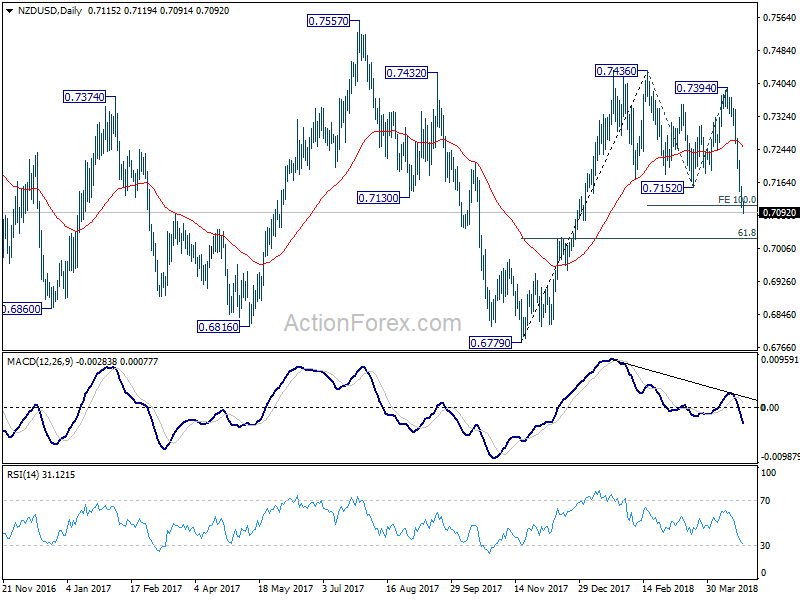
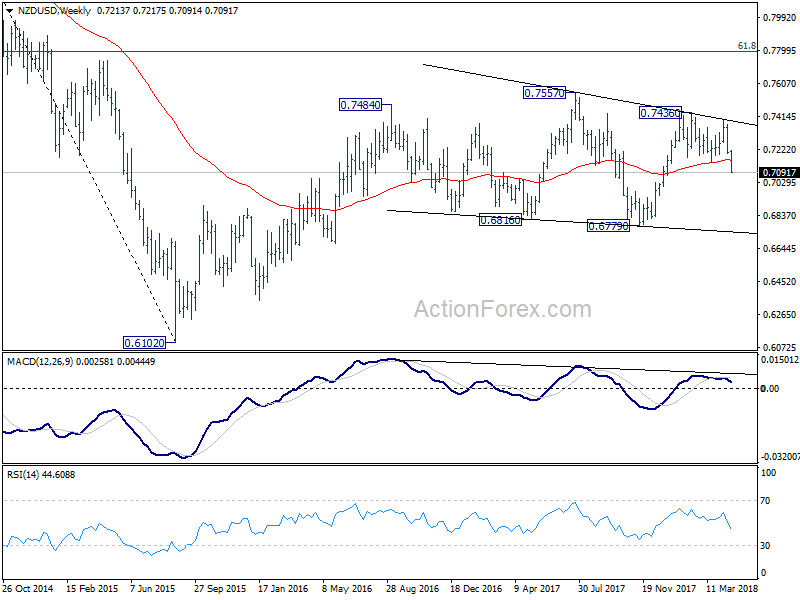
However, it should be noted that NZD/USD is now in a medium term triangle like pattern. Such a pattern could be consolidating the rebound from 2015 low at 0.6102. With that in mind, we'd not expect a break of 0.6779 low. And strong support should be seen between 0.6779 /7030 to bring another near term reversal.
GBP/USD Faces Tough Resistance Around 1.40
Key Highlights
- The British Pound declined sharply and broke the 1.4080 pivot level against the US Dollar.
- There was a break below a key bullish trend line with support at 1.4170 on the 4-hours chart of GBP/USD.
- The pair is in a major downtrend and any recovery is likely to face resistance near 1.4000-1.4020.
- The US New Home Sales in March 2018 increased 4% (MoM), more than the forecast of +1.9%.
GBPUSD Technical Analysis
A major downside move was initiated from the 1.4350 resistance in the British Pound against the US Dollar. The GBP/USD pair declined by more than 300 pips during the past few days and settled below 1.4000.
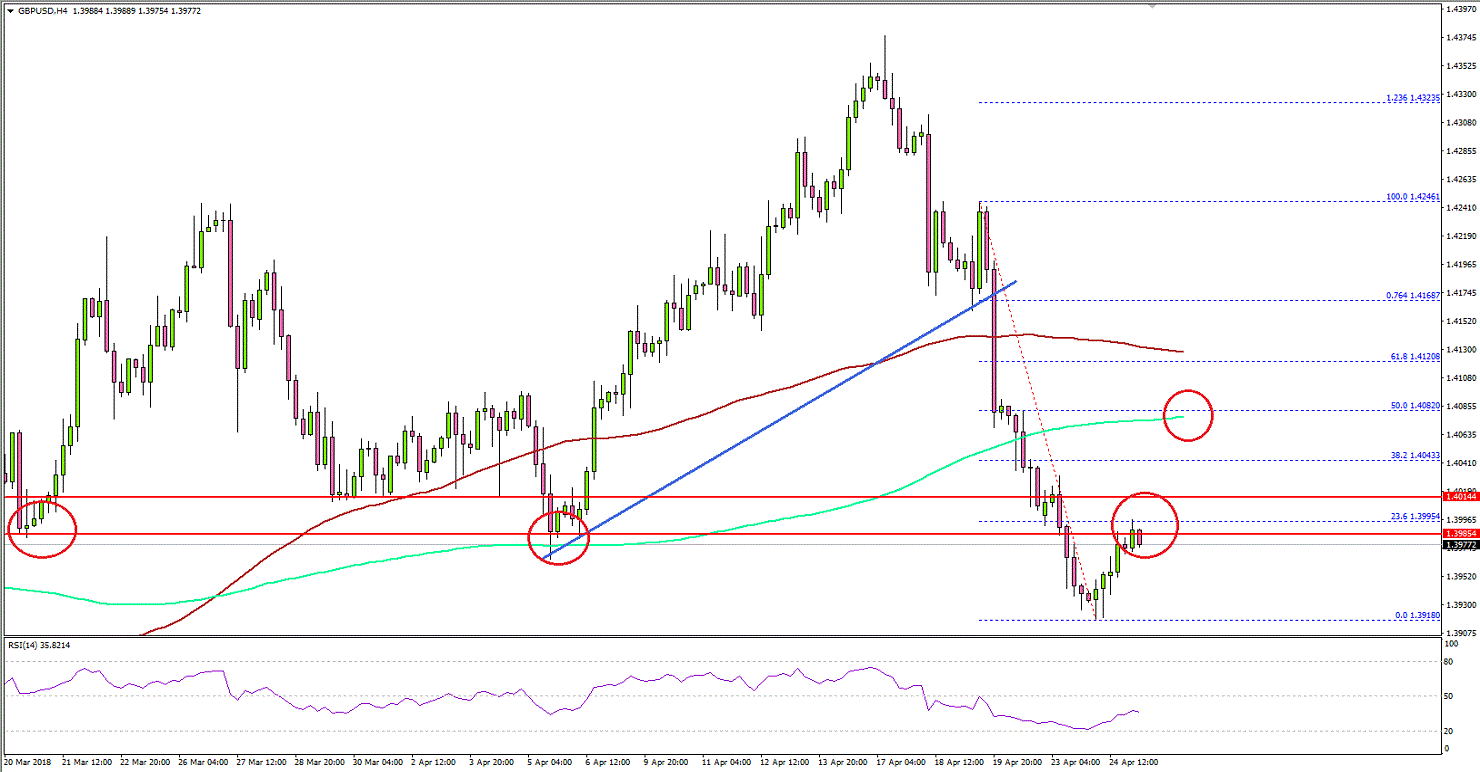
During the downside move, the pair broke a major support at 1.4200, which opened the doors for more declines. As a result, there was a break below a key bullish trend line with support at 1.4170 on the 4-hours chart.
More importantly, the pair settled below the 100 (red) simple moving average (4-hours) and the 200 (green) simple moving average (4-hours). It traded as low as 1.3918 where buyers protected further losses.
At the moment, the pair is consolidating losses above the 1.3920 level. An initial resistance is around the 23.6% Fib retracement level of the last decline from the 1.4246 high to 1.3918 low. It seems like there is a strong barrier forming around 1.4020 since it acted as a support earlier.
If the pair corrects higher, it could face a strong resistance around 1.4000-1.4020. A break above the 1.4020 resistance may perhaps open the doors for a push towards the 50% Fib retracement level of the last decline from the 1.4246 high to 1.3918 low at 1.4080.
On the downside, the recent low at 1.3918 is a decent support. A break below 1.3918 would expose the pair to more losses in the near term.
Recently, the US New Home Sales report for March 2018 was released by the US Census Bureau. The market was looking for a 1.9% rise in sales compared with the previous month.
The actual result was better as there was a rise of 4.0% in sales. Moreover, the last reading was revised up from -0.6% to 3.6%. Thus, the overall increase was very positive.
To sum up, GBP/USD may correct higher in the short term, but it won’t be easy for buyers to break the 1.4020 and 1.4080 resistance levels.
Market Morning Briefing: Euro Yen Has Risen Above 133
STOCKS
Dow (24024.13, -1.74%) has fallen sharply from levels near 24448 seen yesterday contrary to our expectation of moving up from immediate support near 24300. A fall towards 23500-23200 is possible in the next 3-4 sessions. Near term looks bearish.
Dax (12550.82, -0.17%) is down slightly while the resistance near 12650 seems to be holding well for now. Note that the Dax is stuck near important levels. A break above 12650, if seen could take it higher in the medium term towards 12800, else a fall to 12400 and lower looks poasible. 12650 is a strong medium term resistance which would be difficult to break on the upside just now.
Nikkei (22134.17, -0.65%) has dipped a bit too and while the resistance Near 22600 holds on the 3 day candles chart, a fall towards 21400 seems to be a possibility. While below 22600, the index remains bearish.
Although Shanghai (3115.70, -0.42%) has come off a bit, the 3 day candle chart shows huge buying pressure at levels near 3050, looking at the last 2 candles. And while 3150 holds strong, Shanghai could spend sometime in the 3050-3150 region trading sideways in the next few sessions. Near term is likely to be in a consolidating mode.
Nifty (10614.35, +0.28%) closed above 10600 again yesterday but may not sustain these levels for long. We stick to our bearish view towards 10450-10400.
COMMODITIES
Resistance near 76 seems to be holding on Brent (73.87) as seen on the 3-day candle charts. If that holds, the price could be pushed down to test 72-71 on the downside.
Nymex WTI (67.67) tested the resistance as visible on the daily candles and while that holds, either the price comes off towards 66 or remains stuck in the 67-70 region for some time.
The near term upside could be capped at 1340/50 for Gold (1330.80) with chances of a fall towards 1320-1300 in the coming weeks. A break above 1350 looks less likely for the near term.
Copper (3.1375) is trading above 3.1250. On the weekly candles, resistance near 3.20 seems to be holding well and while that holds, a fall towards 3.10-3.05 looks more likely in the medium term. There is some scope that the price moves up towards 3.17-3.20 but thereafter the direction is on the downside.
FOREX
Dollar index (90.845) has dipped from levels near 91 but continues to trade above crucial resistances on 3 day candles and daily line chart near 90.50-90.75. It could still struggle to breach the 90.5-91.0 zone and turn bearish in the near term from here. The recent upmove in US yields, if it continues, (see Interest Rates below) could possibly be Dollar positive and take the Dollar Index past 91.
In our Apr ’18 Euro report, we had preferred Dollar bearishness till May/Jun, after which it could turn bullish. The downmove from 103 since Dec ’16 should end some time in this quarter.
Euro (1.2225): Euro continues to stay within the crucial 1.225-1.215 zone and a decisive break below 1.215 might be difficult in the near term. If the Euro rises past 1.226, our near term preference for bullishness would come out to be correct and it could again target levels near 1.24. The ECB meeting tomorrow could be a market mover for the Euro and needs to be watched closely.
In our Apr ’18 Euro report our preference was for bullishness in the Euro till May/Jun. The upmove from 1.045 since Dec ’16 could start seeing a significant correction sometime in this quarter.
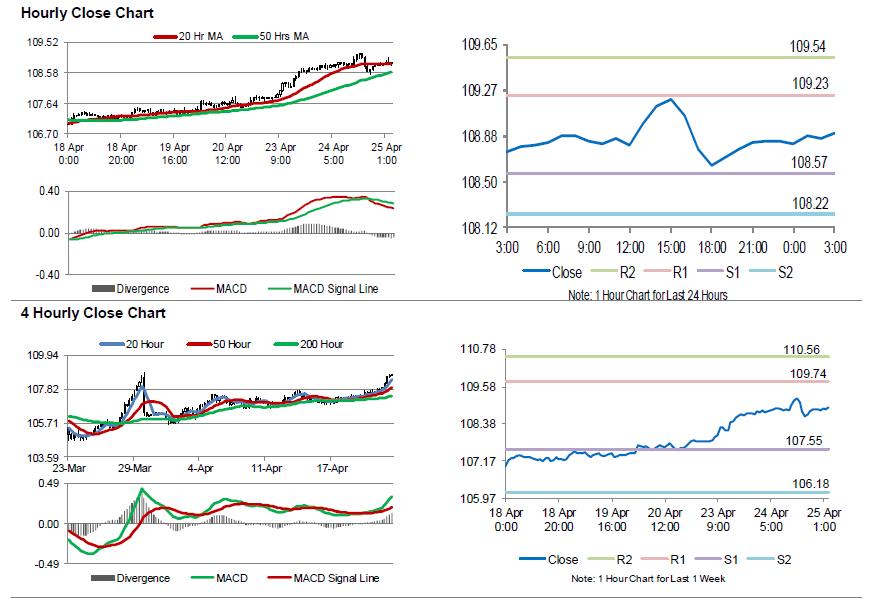
Dollar Yen (108.90) : Dollar Yen might be getting some resistance around the 21 WMA (108.93) and could dip from current levels. As mentioned yesterday, upside could be restricted by 110 in the short term, after which it should turn bearish.
Euro Yen (133.14) has risen above 133 thereby breaching resistances on daily and 3 day candles. It could still end the week below 133 if it stays below the 21 weeks moving average near 132.95. Looking at the Euro and Dollar Yen – Euro could turn bullish towards 1.225 and Dollar Yen could dip towards 108.5, giving us a target of 132.91 on Euro Yen.
Pound (1.3981) is pausing in its downmove towards crucial long term support level near 1.385 on weekly line chart. However, we expect it to test this level by next week possibly. If this support also breaks, Pound could turn very bearish in the medium term. However, our preference is for it to hold, in which case, we could see a rally towards long term resistance level of 1.46 in the weeks ahead.
Dollar Rupee (66.48): Overbought at current levels. Possible Resistance at 66.30-50. Might dip to 66.30 or maximum 66.00.
INTEREST RATES
The US 10 Year Yield has hit the the psychologically important 3% level. Whether it comes off from here again or continues its rise could be very important for bond markets. The ECB meeting tomorrow could be very important for the course of US yields. Any hint of hawkishness from Draghi could further raise US yields. We repeat that the recent upmove in US yields has happened on back of positive sentiment around the US economy’s growth (reflected in data releases of the last 2 weeks: Industrial Production, Capacity Utilization, US Retail Sales data, unemployment claims data and the Fed minutes). In addition, Crude’s rise towards 75 is continuing to increase inflation expectations and fuelling the rise in yields. The US treasury is also auctioning almost 370 billion dollars worth of notes and short term bonds this week – which could be another factor for bullishness in yields in the near term.
US 10 Yr Yield (3%), 30 Yr (3.179%), 5 Yr (2.8278%), 2 Yr (2.4878%):
The US 2 year yield (2.4878) could move further towards 2.50% and then see a dip towards 2.40%-2.35% soon.
The 10 Year yield (3%) could still come off from this important level and move back towards 2.95%-2.90%. If it rises higher towards 3.05%, then it could quickly move towards 3.20% after that.
The 30 yr yield has continued to stay below crucial resistance near 3.2%. We have been saying that a decisive breach of 3% on the 10 year yield could correspond with a breach of 3.2% by the 30 year yield. Since the 30 Year yield is still respecting this resistance, the 10 Year yield might also pause around 3%.