Sample Category Title
USDJPY – Bulls Could Extend To 110./26 On Firm Break Above Daily Cloud Top
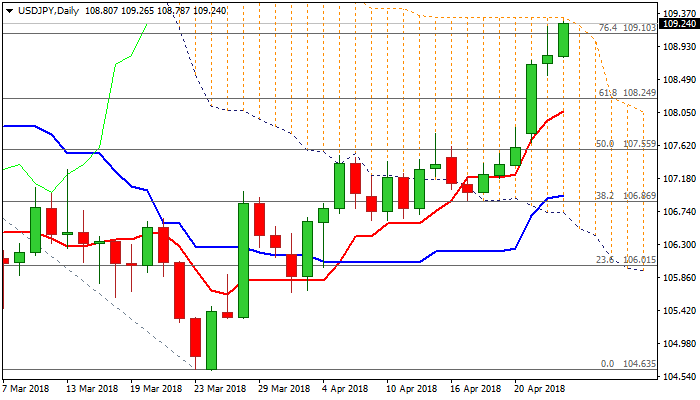
The pair probes again above 100SMA (108.95) in early Wednesday's trading after previous day's attempts through 109 handle stalled at 109.20 and session closed below 100SMA pivot. The dollar remains well supported as US bond yields continue to rise and hit four-year high above 3%, despite many market observers expectations that the rally would be capped here. Fresh rally neutralizes initial signs of stall on Wednesday's failure at 100SMA which left daily candle with long upper wick. Bullish daily techs boost positive sentiment for eventual break through daily cloud top (109.21) and fresh acceleration on triggering stops parked above daily cloud, for extension towards next targets at 110.00/26 (psychological barrier/200SMA). Daily close above cloud is needed to generate fresh bullish signal and confirm scenario. Slow stochastic is overbought on daily chart but continues to point higher, while daily RSI is at the border of overbought territory and 14-d momentum turning lower, suggesting consolidative/corrective action in the near-term. Broken Fibo barrier at 108.25 and rising daily Tenkan-sen, mark solid supports where extended dips should find ground.
Res: 109.30, 109.78, 110.00, 110.26
Sup: 108.95, 108.78, 108.54, 108.25
AUDUSD Posts Steep Declines, Ascending Trend Line Penetrated
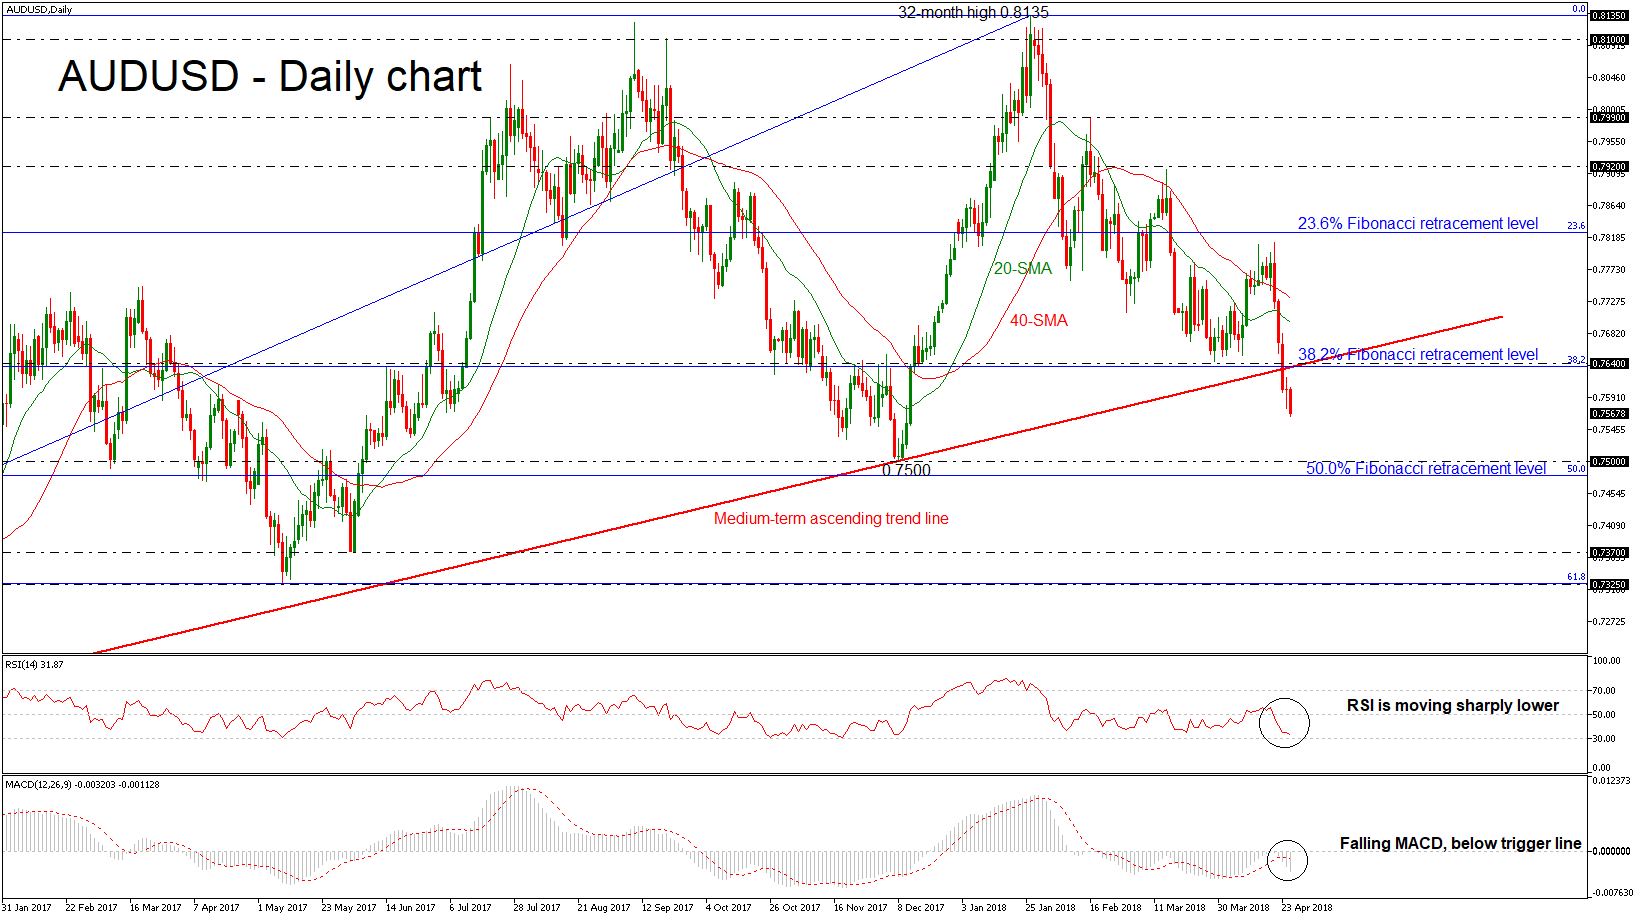
AUDUSD recorded a stunning bearish rally over the last four trading days, penetrating the medium-term ascending trend line, which has been standing since January 2016. Also, the price posted a fresh more than 4-month low of 0.7569 during today’s early European session. The aggressive bearish correction started after the pullback on the 32-month high of 0.8135 and now the bias is turning to negative.
The RSI is currently increasing negative momentum towards the oversold threshold of 30 after the sharp slip from the 50 level, while the MACD is falling in negative territory, both hinting that the next move in prices could be on the downside.
Should the market extend losses, support could be met at the 0.7500 strong psychological level, taken from the low on December 2017. This level is holding slightly above the 50.0% Fibonacci retracement level of the upleg from 0.6820 to 0.8135. A significant drop below this area could send prices towards the 0.7370 support taken from the June 2017 low.
On the flip side, if the pair bounces up, immediate resistance could be met at the 38.2% Fibonacci around 0.7640. If the market manages to pick up speed prices could re-challenge the 23.6% Fibonacci mark of 0.7825, reversing this and last week’s sell-off.
Dollar Hovers Near 4-Month Highs, Raft Of Corporate Earnings Due
Here are the latest developments in global markets:
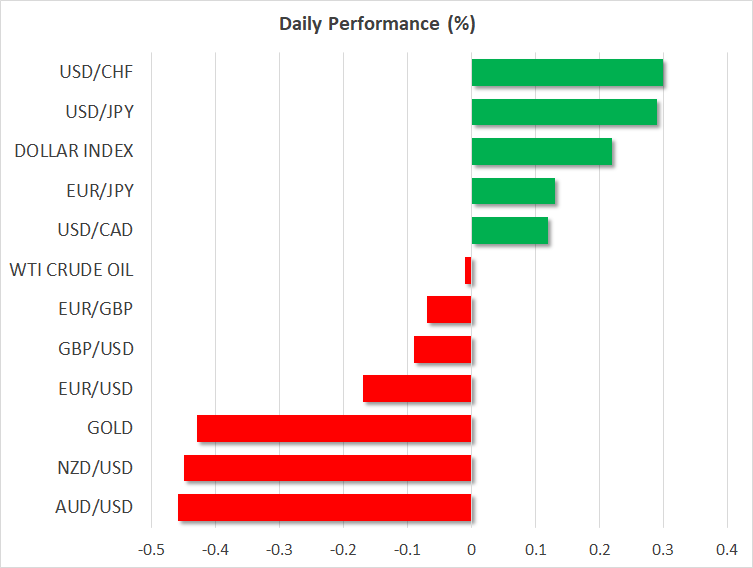
FOREX: The US dollar index is 0.2% higher today, hovering just below its four-month high posted earlier in the week, as the continued rise in longer-term US bond yields has breathe some life back into the world’s reserve currency. Both the aussie and the kiwi are 0.45% lower against the greenback, extending recent losses.
STOCKS: US markets stumbled on Tuesday, pressured by concerns around rising borrowing costs, as well as discouraging signals from the industrial and technology sectors. The Dow Jones fell 1.74%, dragged lower by Caterpillar (-6.2%), whose CFO hinted the first quarter was probably the firm’s best for the year. Meanwhile, the Nasdaq Composite declined 1.7% as FANG shares (Facebook, Amazon, Netflix, Google-parent Alphabet) all dropped by more than 3.5%. The S&P 500 tumbled by 1.34%. Futures tracking the Dow, S&P, and Nasdaq 100 are all flashing red. Asian indices were a sea of red as well. In Japan, the Nikkei 225 and the Topix edge down by 0.28% and 0.11% respectively, while Hong Kong’s Hang Seng pulled back by 1.09%. In Europe, futures tracking all the major benchmarks were in negative territory, pointing to a lower open.
COMMODITIES: Oil prices are practically unchanged on Wednesday, after retreating yesterday on the back of the broader sell-off in equity markets and a surprising build in the private API crude inventory data. Today, focus will likely turn to the release of the official EIA weekly stockpile data, though any major shifts in risk appetite also have the capacity to drive oil prices. In precious metals, gold is more than 0.4% lower today, currently trading near the $1323 mark. The yellow metal has struggled in recent days, as the rebound in the greenback is keeping a lid on any material advances in gold. With gold being denominated in dollars, an appreciation in the US currency makes the metal less attractive to investors using foreign currencies, thereby curbing its demand.
Major movers: Dollar index hovers near 4-month highs, no reprieve for antipodeans
The dollar index is 0.2% on Wednesday, staying elevated near the four-month high of 91.10 it posted on Monday, supported by sustained advances in US Treasury yields. Earlier today, the yields on 10-year Treasuries broke above the widely touted 3.0% psychological level, and have remained above it since. Higher US bond yields tend to lift the dollar, as they induce investors to increase their exposure to that currency. It will be most interesting to see whether the dollar index can break above the 91.10 zone soon, as that is the upper bound of the sideways it has been trading since mid-January, and a move above it would turn the technical picture to cautiously positive.
Meanwhile, US stocks suffered as bond yields rose. Rising yields typically weigh on demand equities, as bonds become more attractive to hold relative to stocks. The fact that the borrowing costs of companies rise as well, diminishing their ability to buy back their own stocks, also plays a major role.
Elsewhere, the antipodean currencies – the aussie and the kiwi – continued to suffer. Both are 0.45% lower against the greenback today, extending the significant losses they posted recently. Fundamentally, both currencies appear to be battered by diminishing expectations for any rate increase by either the RBA or the RBNZ this year, following relatively soft data on inflation out of both Australia and New Zealand lately. The dollar’s latest rebound, combined with some key technical breaks to the downside, may have amplified the selloff

Day ahead: Raft of corporate earnings and EIA oil report on the agenda
With the rest of the day practically empty of country-specific releases out of major economies, the focus might turn to corporate earnings and the Energy Information Administration’s weekly report on crude stocks.
On a busy corporate-earnings day, some of the big names reporting results include AT&T, Boeing, Comcast, eBay, Facebook, Ford and Twitter. Boeing and Comcast will publish their results before the US market open, with all other earnings reports scheduled for announcement after the closing bell on Wall Street.
Major US equity indices recorded a considerable drop on Tuesday, as warnings by perceived-bellwether companies – perhaps most notably Caterpillar – of higher costs on the back of rising yields weighed on equity market sentiment. It would be interesting to see to what extent this narrative plays out today, diverting to some extent the attention from corporate releases and into the bigger picture for the stock market. How Treasury yields evolve today, and in the days to come, can also fuel or remove steam out of this story.
The EIA’s report on US crude oil inventories for the week ending April 20 due at 1430 GMT will be of interest to traders of the precious liquid which is trading around levels last seen in late 2014. Crude stocks are anticipated to decline by 2.0 million barrels, posting their second straight weekly drawdown. In the previously recorded week, they fell by 1.1m barrels.
An appearance before the Senate Standing Committee on Finance by Bank of Canada Governor Stephen Poloz and Senior Deputy Governor Carolyn Wilkins is on the agenda at 2015 GMT.
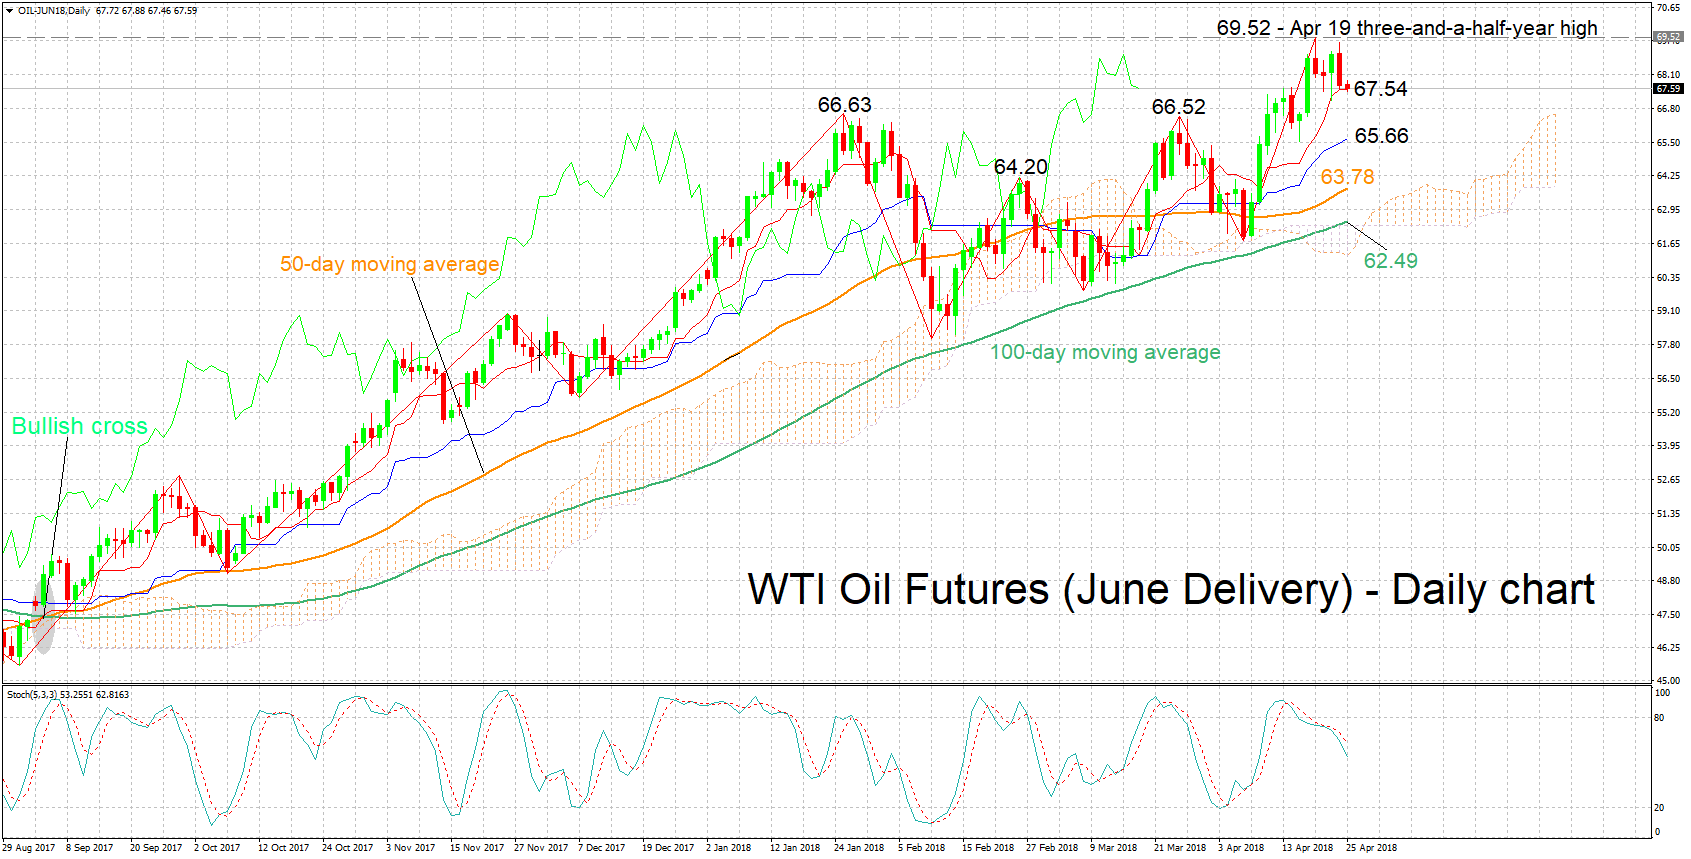
Technical Analysis: WTI oil futures retreat a bit from 3½-year high; bearish signal by stochastics in very short-term
WTI oil futures for June delivery have fallen a bit after touching a three-and-a-half-year high of 69.52 on Thursday (yesterday they came close to revisiting that peak). The positively aligned Tenkan- and Kijun-sen lines are projecting a bullish picture in the short-term, though notice that the former has flatlined and the latter is not as steeply sloped as previously; positive momentum may be easing. Moreover, the stochastics are giving a bearish signal in the very short-term: the %K line has moved below the slow %D one and both lines are heading lower.
Should today’s EIA report show a larger-than-anticipated drawdown in crude inventories, then the bullish bias in the short-term may be refueled. Resistance to advances could come around last week’s three-and-a-half-year high of 69.52 and the 70 round mark. A violation of the latter may pave the way for stronger gains.
On the downside and in case of a smaller-than-expected drawdown in crude stocks (or a buildup), support could come around the current levels of the Tenkan- and Kijun-sen lines at 67.54 and 65.66 respectively; the Tenkan-sen is tested at the moment. A couple of peaks – at 66.63 and 66.52 – lie between the two lines as well.
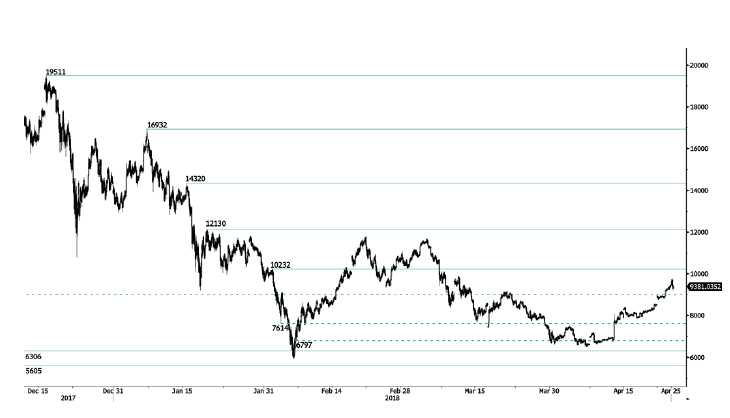
Bitcoin Bearish Consolidation Below 10000
Bitcoin rise started in mid April continues, currently trading above 9300 and heading along the 9200 range. Bitcoin bearish pattern started in March 2018 stops. The pair is contained between hourly support and resistance given at 6306 (13/11/2017 low) and 10232 (01/02/2018 high). The technical structure suggests short-term decrease.
In the long-term, the digital currency has had an exponential growth but also presented important downturns. There is decent likelihood that the currency could stabilize between 7'000 - 12'000 in 2018. Bitcoin is trading slightly above its 200 DMA (8000 range)
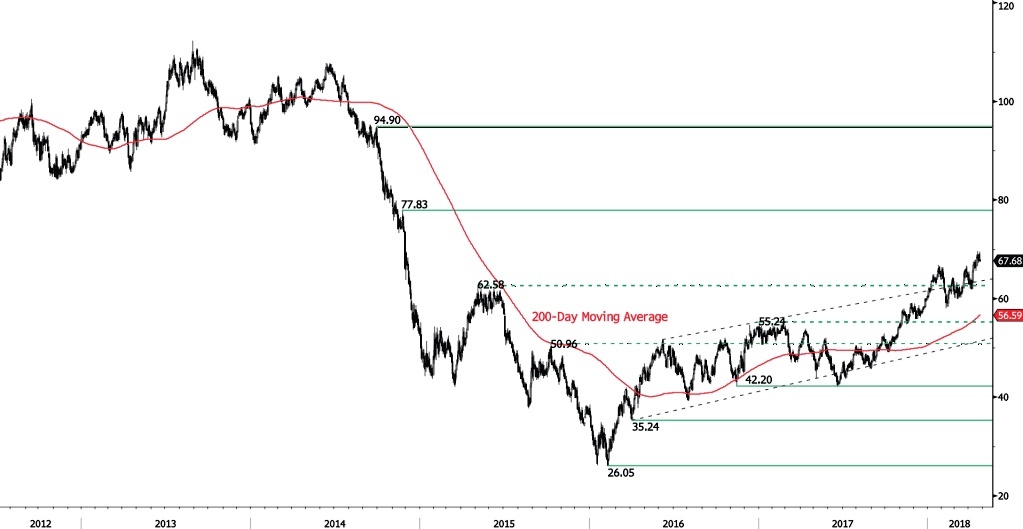
CRUDE OIL Heading Along 67.50
Crude oil is slightly decreasing following recent rise at 69.38, heading along the 67.50 range. Crude Oil is trading at its December 2014 high. The bullish pattern started in November 2017 is maintained. Hourly support at 63.20 (10/04/2018 low) is distanced. The technical structure suggests short-term downward moves.
In the long-term, crude oil has recovered after its sharp decline last year. However, we consider that further weakness is very likely. For the time being, the pair lies in an upside trend since June 2017. Support lies at 42.20 (16/11/2016) while resistance is located at 77.83 (20/11/2014). Crude oil is trading largely above its 200 DMA.
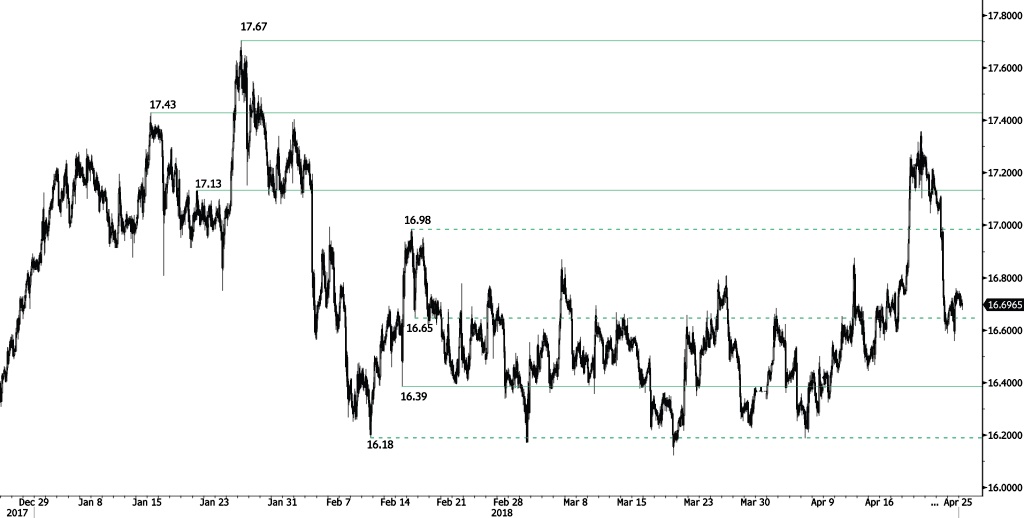
SILVER Approaching 16.65
Silver is decreasing following recent rise at 16.76, heading along the 16.60 range. Hourly support and resistance are given at 16.39 (14/02/2018 low) and 17.13 (19/01/2018 high). The technical structure suggests short-term decrease.
In the long-term, the trend remains negative/ sideways. Further downside is very likely. The pair is trading below its 200 DMA. Resistance is located at 21.58 (10/07/2014 high). Strong support can be found at 11.75 (20/04/2009).
GOLD Heading Lower
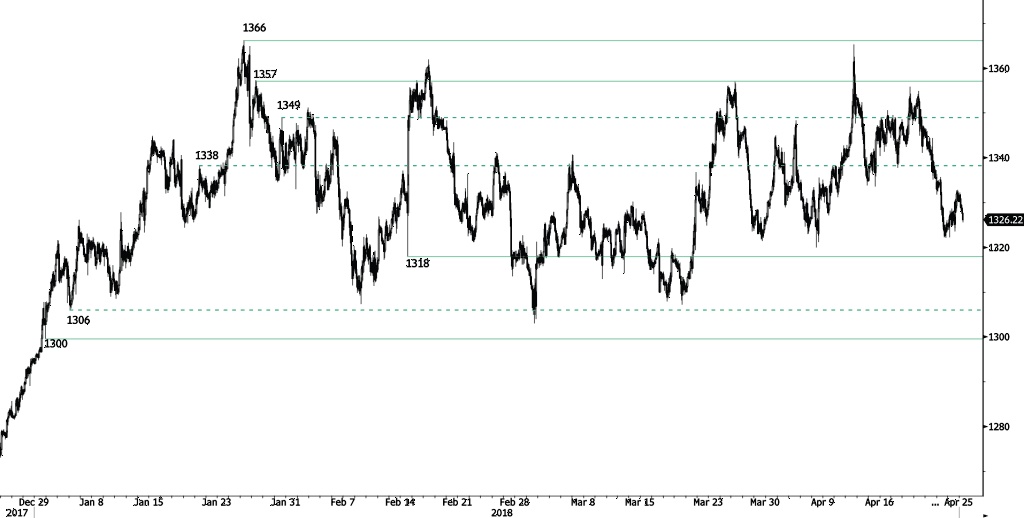
Gold is trading lower following recent rise at 1333, heading along the 1324 range. Hourly support and resistance are given at 1318 (14/02/2018 low) and 1357 (26/01/2018 high). The technical structure suggests short-term downward trading moves.
In the long-term, the technical structure suggests that there is a growing upside momentum. A break of 1'392 (17/03/2014) is required to confirm it. A major support can be found at 1'045 (05/02/2010 low).
EUR/CHF Maintained Below 1.20
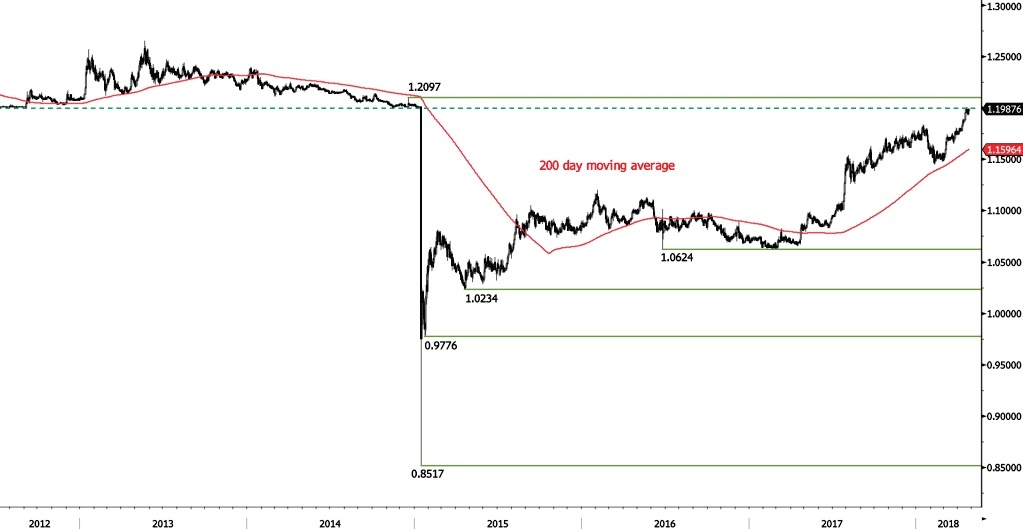
EUR/CHF is bouncing off from 1.1925 low, heading along the 1.1993 range. Strong resistance at 1.20 remains. Hourly support given at 1.1842 (11/04/2018 low) is distanced. The short-term technical structure suggests further short-term sideways trading moves.
In the longer term, the technical structure has reversed. Strong resistance at 1.20 (level before the unpeg) is now at reach. The ECB's slowing QE program is likely to cause buying pressures on the euro, which should weigh in favour of the EUR/CHF. Support and resistance can be found at 1.0624 (24/06/2016 low) and 1.2097 (18/12/2014 high).
EUR/GBP Weakening
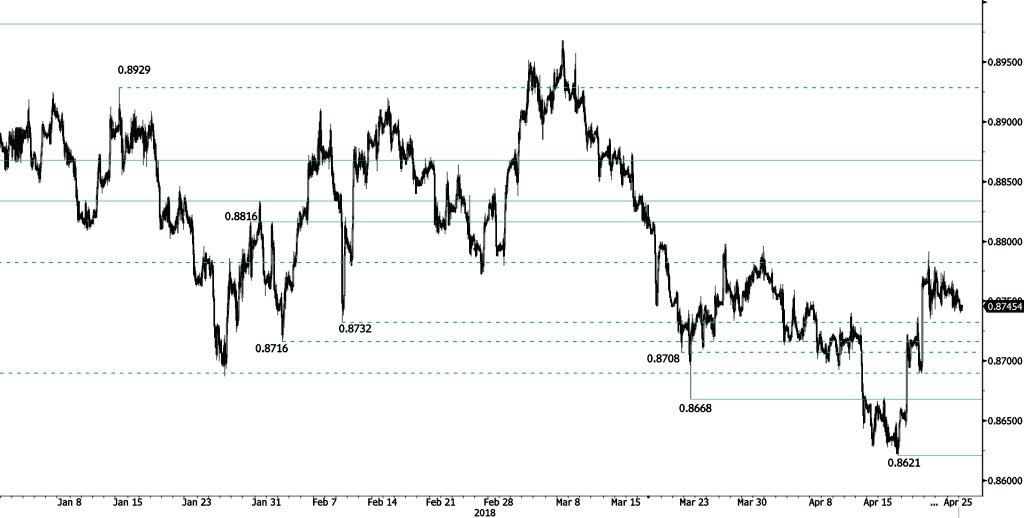
EUR/GBP decrease continues, heading along the 0.8740 range. EUR/GBP bearish pattern started in March is weakened. Hourly support and resistance are given at 0.8668 (22/03/2018 low) and 0.8816 (29/01/2018 high). The technical structure suggests short-term decrease.
In the long-term, the pair has largely recovered from 2015 lows. The technical structure suggests further upside pressure. Strong resistance can be found at 0.9500 (psychological level) while support remains at 0.8304 (05/12/2016 low). The pair is trading below its 200 DMA.
AUD/USD Continued Bearish Bias
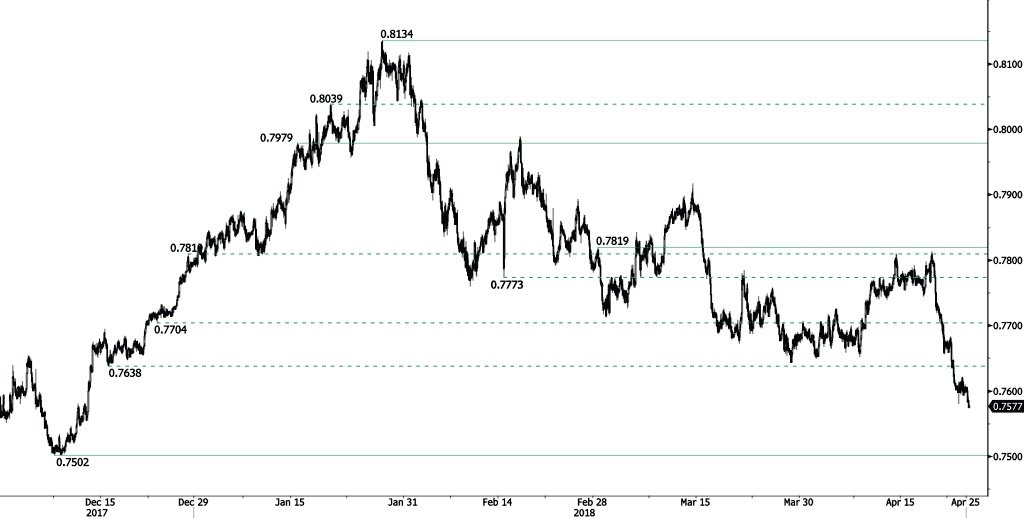
AUD/USD bearish pattern from 0.7813 (19/04/2018) continues, heading along the 0.7565 range. The pair is trading at December 2017 low. Hourly support and resistance are given at 0.7502 (08/12/2017 low) and 0.7979 (15/01/2018 high). The technical structure suggests short-term downward trading moves.
In the long-term, the upward trend slows down after failing to reach key resistance at 0.8164 (14/05/2015 low). Key support stands at 0.6009 (31/10/2008 low). A break of the key resistance at 0.8164 (14/05/2015 high) is needed to invalidate our long-term bearish view.