Sample Category Title
AUDUSD – Break Through Key Supports Opens Way For Further Weakness
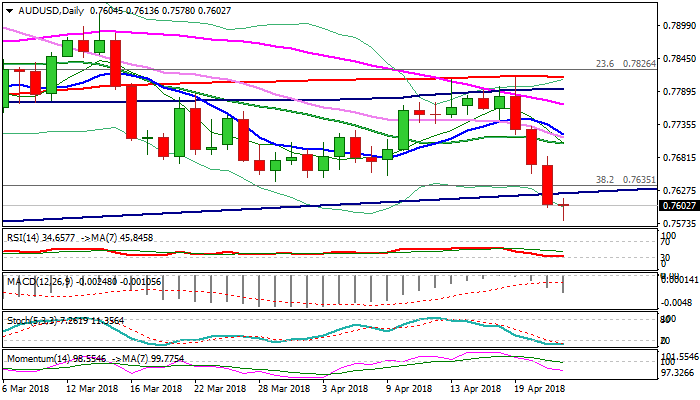
The Aussie dollar extends steep fall of past three days on Tuesday and cracks key supports at 0.7635/17 (Fibo 38.2% of larger 0.6826/0.8135 ascend/main bull-trendline off 2016 low at 0.6826). Firm break here would generate strong bearish signal for extension of fall from 0.8135 (2018 high). Bearish techs maintain negative outlook which was boosted by weaker than expected Australian CPI data that suggest RBA could further stay on hold. However, bears may show hesitation before clearly breaking key 0.7635/17 support, as slow stochastic is strongly oversold on daily chart. Corrective upticks would face solid barriers at 0.7640 (former base) and 0.7704 (falling 20SMA).
Res: 0.7640, 0.7682, 0.7704, 0.7719
Sup: 0.7578, 0.7535, 0.7500, 0.7481
Forex Technical Analysis: EUR/USD, USD/JPY, GBP/USD
EUR/USD
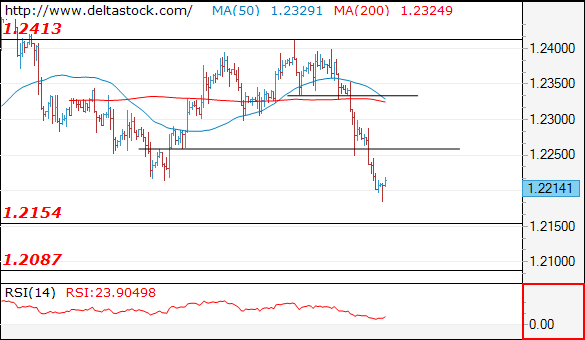
Current level - 1.2214
The bias remains negative below 1.2250, for a break through 1.2160, towards 1.2090 major static support.
| Resistance | Support | ||
| intraday | intraweek | intraday | intraweek |
| 1.2250 | 1.2412 | 1.2160 | 1.2160 |
| 1.2335 | 1.2560 | 1.2090 | 1.2090 |
 USD/JPY
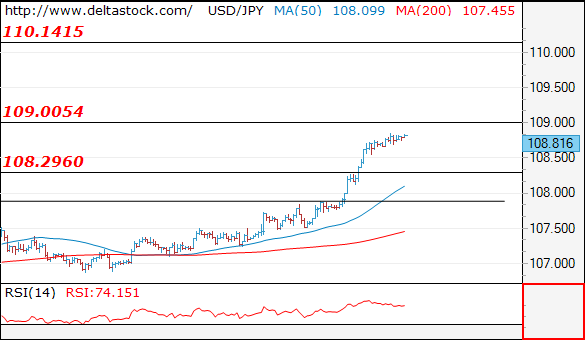
Current level - 108.81
After a short-lived corrective pullback, the pair broke through 108.30 resistance and the uptrend is intact, for a break through 109.00, towards 110.20 area. Key support lies at 108.30.
| Resistance | Support | ||
| intraday | intraweek | intraday | intraweek |
| 109.00 | 110.20 | 108.30 | 106.60 |
| 110.20 | 111.90 | 107.90 | 104.60 |
GBP/USD
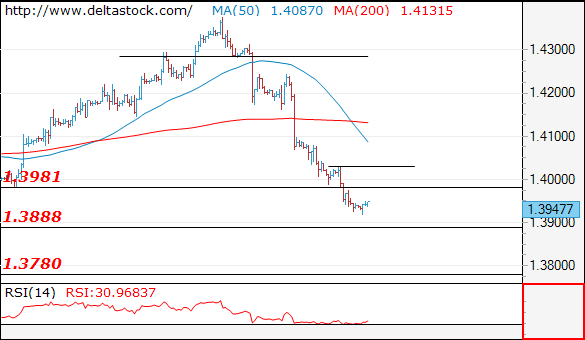
Current level - 1.3947
The downtrend is intact, heading towards 1.3880, en route to 1.3780. Initial resistance lies at 1.3980 and crucial is 1.4030.
| Resistance | Support | ||
| intraday | intraweek | intraday | intraweek |
| 1.3980 | 1.4280 | 1.3880 | 1.3780 |
| 1.4150 | 1.4280 | 1.3780 | 1.3710 |
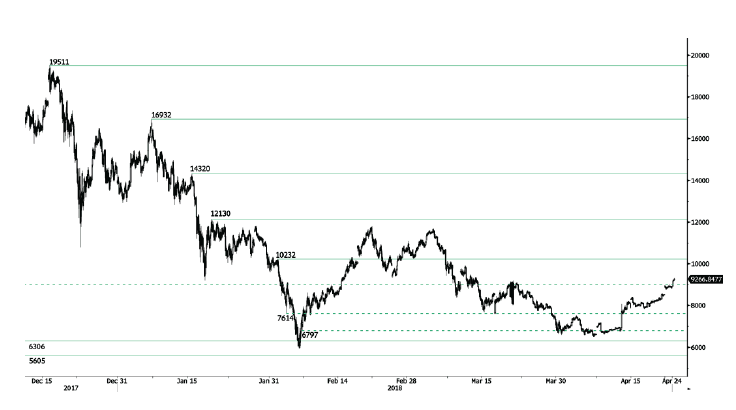
Bitcoin Edging Higher
Bitcoin rise started in mid April continues, currently trading above 9000 and heading along the 9300 range. Bitcoin bearish pattern started in March 2018 stops. The pair is contained between hourly support and resistance given at 6306 (13/11/2017 low) and 10232 (01/02/2018 high). The technical structure suggests further shortterm increase.
In the long-term, the digital currency has had an exponential growth but also presented important downturns. There is decent likelihood that the currency could stabilize between 7'000 - 12'000 in 2018. Bitcoin is trading slightly above its 200 DMA (8000 range).
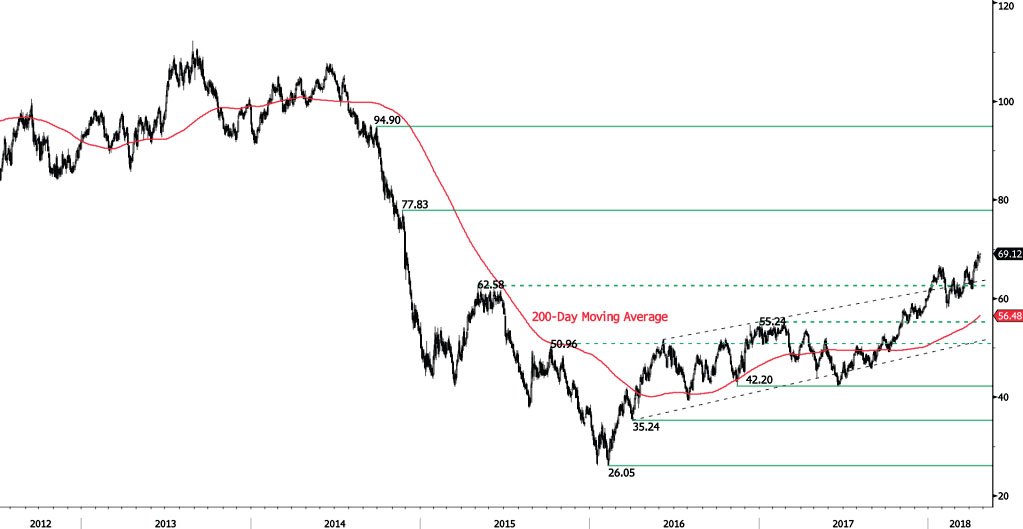
CRUDE OIL Trading Above 69
Crude oil is bouncing off from 67.14 low, trading above 69 and heading along the 69.35 range. Crude Oil is trading at its December 2014 high. The bullish pattern started in November 2017 is maintained. Hourly support at 63.20 (10/04/2018 low) is distanced. The technical structure suggests short-term upward moves.
In the long-term, crude oil has recovered after its sharp decline last year. However, we consider that further weakness is very likely. For the time being, the pair lies in an upside trend since June 2017. Support lies at 42.20 (16/11/2016) while resistance is located at 77.83 (20/11/2014). Crude oil is trading largely above its 200 DMA.
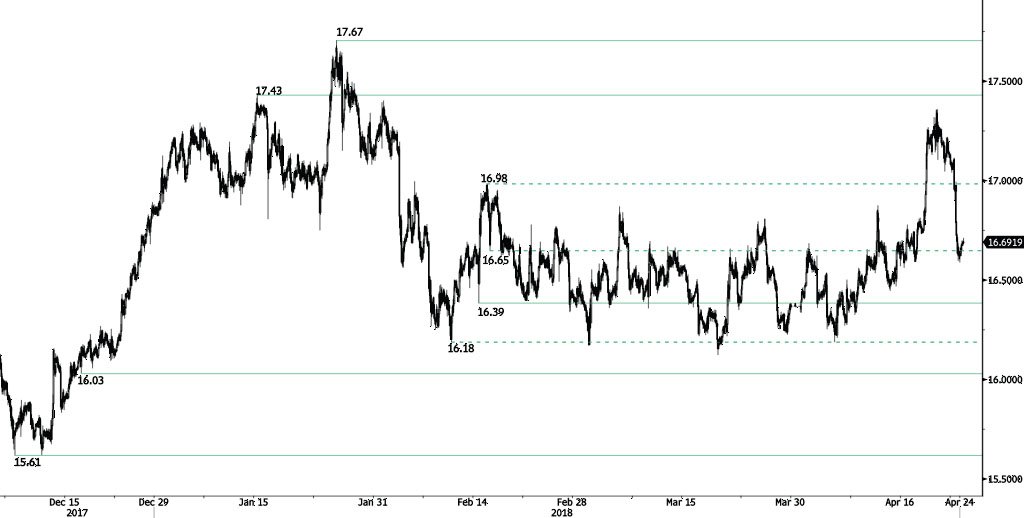
SILVER Bouncing Off
Silver is bouncing off from 16.58 low, trading at 16.66 following recent rise at 17.36 and breaking hourly support at 16.65 (15/02/2018). Silver is heading along the 16.75 range. Hourly support and resistance are given at 16.39 (14/02/2018 low) and 17.43 (15/01/2018 high). The technical structure suggests short-term increase.
In the long-term, the trend remains negative/ sideways. Further downside is very likely. The pair is trading below its 200 DMA. Resistance is located at 21.58 (10/07/2014 high). Strong support can be found at 11.75 (20/04/2009).
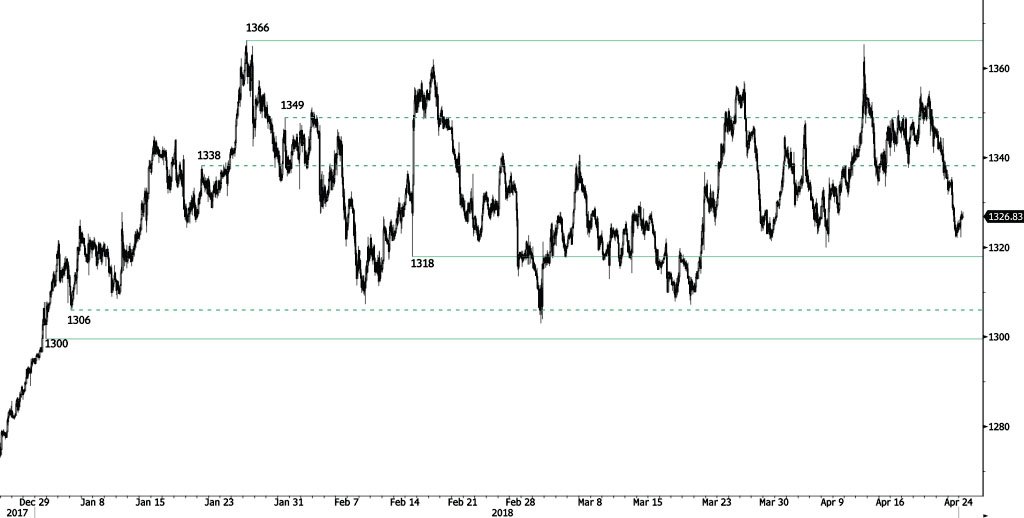
GOLD Neutral
Gold is pausing following recent decrease from 1336, heading along the 1328 range. Hourly support and resistance are given at 1318 (14/02/2018 low) and 1366 (25/01/2018 high). The technical structure suggests short-term sideways trading moves.
In the long-term, the technical structure suggests that there is a growing upside momentum. A break of 1'392 (17/03/2014) is required to confirm it. A major support can be found at 1'045 (05/02/2010 low).
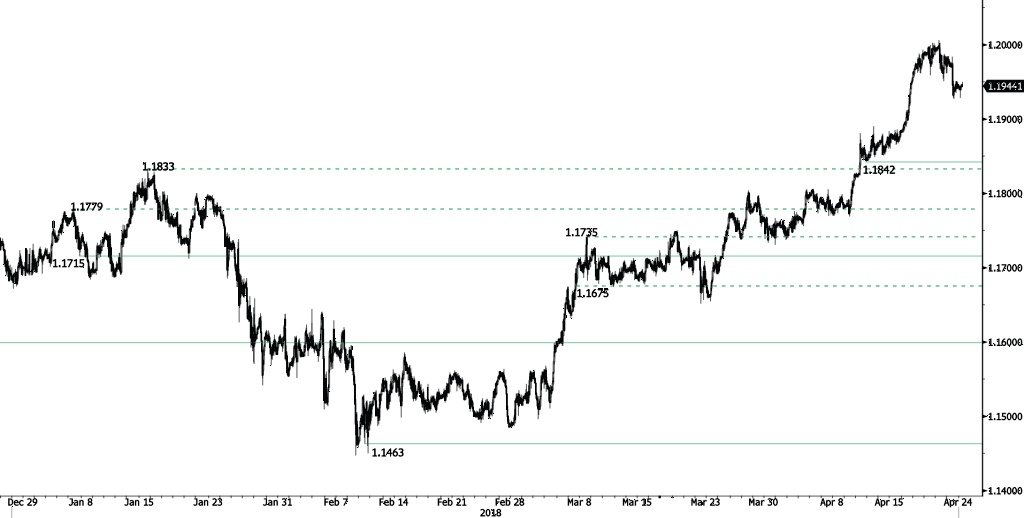
EUR/CHF Maintained At 1.1938
EUR/CHF is starting a bearish consolidation following recent decrease from 1.1983. Strong resistance at 1.20 remains. Hourly support given at 1.1842 (11/04/2018 low) is distanced. The short-term technical structure suggests further short-term sideways trading moves.
In the longer term, the technical structure has reversed. Strong resistance at 1.20 (level before the unpeg) is now at reach. The ECB's slowing QE program is likely to cause buying pressures on the euro, which should weigh in favour of the EUR/CHF. Support and resistance can be found at 1.0624 (24/06/2016 low) and 1.2097 (18/12/2014 high).
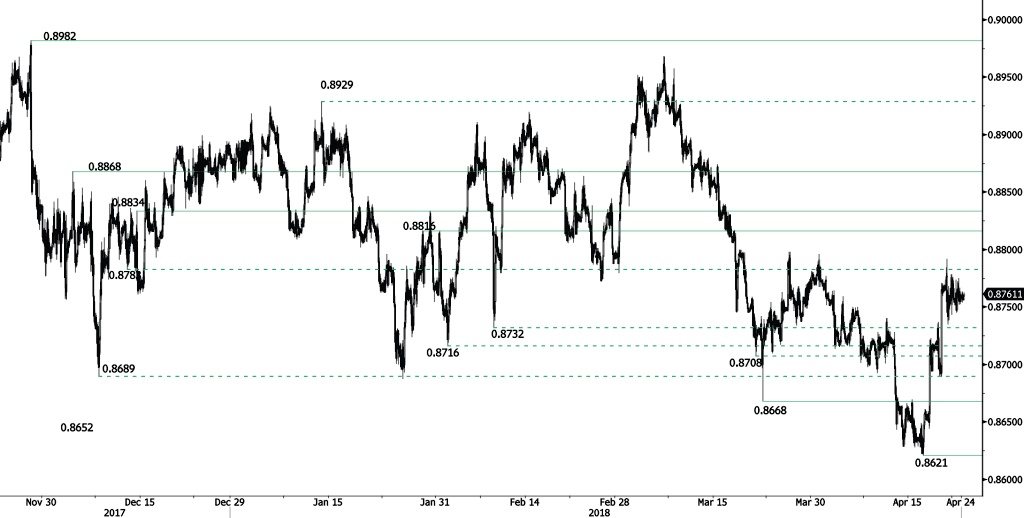
EUR/GBP Slight Increase
EUR/GBP is increasing following recent sideways trading price action, heading along the 0.8765 range. EUR/GBP bearish pattern started in March is weakened. Hourly support and resistance are given at 0.8668 (22/03/2018 low) and 0.8816 (29/01/2018 high). The technical structure suggests short-term increase.
In the long-term, the pair has largely recovered from 2015 lows. The technical structure suggests further upside pressure. Strong resistance can be found at 0.9500 (psychological level) while support remains at 0.8304 (05/12/2016 low). The pair is trading below its 200 DMA.
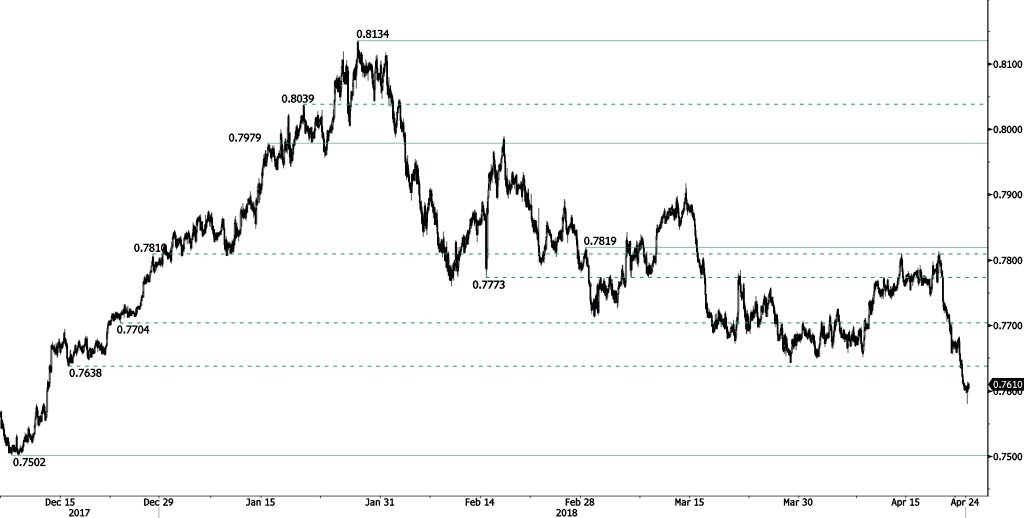
AUD/USD Bearish Consolidation
AUD/USD decrease from 0.7813 is pausing, starting a bearish consolidation at the 0.7605 range after breaking hourly support at 0.7638 (15/12/2018). The pair is trading at December low. Hourly support and resistance are now given at 0.7502 (08/12/2017 low) and 0.7979 (15/01/2018 high). The technical structure suggests short-term sideways trading moves.
In the long-term, the upward trend slows down after failing to reach key resistance at 0.8164 (14/05/2015 low). Key support stands at 0.6009 (31/10/2008 low). A break of the key resistance at 0.8164 (14/05/2015 high) is needed to invalidate our long-term bearish view.
USD/CAD Weakening
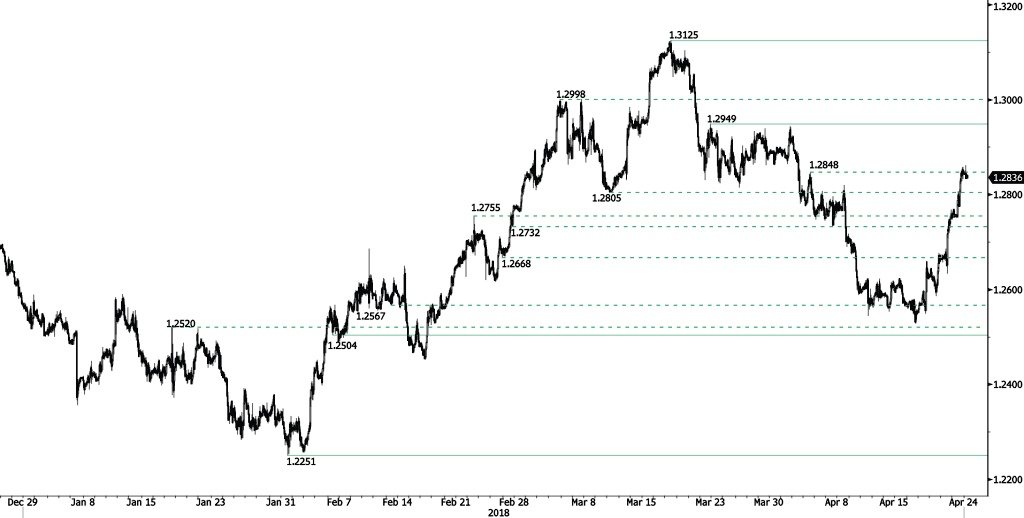
USD/CAD recovery phase from 1.2528 low pauses after breaking hourly resistance at 1.2848 (04/04/2018), decreasing and heading along the 1.2830 range. Hourly support and resistance are now given at at 1.2504 (06/02/2018 low) and 1.2949 (22/03/2018 high). The technical structure suggests short-term decrease.
In the longer term, the pair is trading between resistance point at 1.3805 (05/05/2017 high) and support at 1.2128 (18/06/2015 low). Strong resistance is given at 1.4690 (22/01/2016 high). The pair is likely to head lower. The pair is trading above its 200 DMA.