Sample Category Title
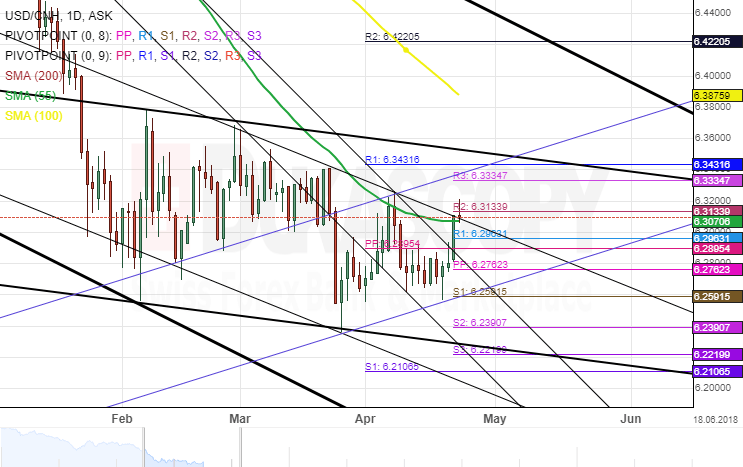
USD/CNH 1D Chart: New Pattern Is Spotted
The US Dollar surged against the rest of the financial markets on Monday. The reason was the fact that North Korea announced that it will stop its nuclear program.
The USD/CNH pair is no exception to the rule. This event quickly crashed the expectations of a decline of the Buck against the Chinese currency.
However, Dukascopy analysts noticed something important on the daily chart of the currency pair. Namely, note the newly added blue colored pattern, which represents the pairs surge in the borders of the pattern, which maps the rates decline since February.
EURUSD – Weak German Data Added To Negative Outlook As Traders Expect Dovish Tone From The ECB On Thursday
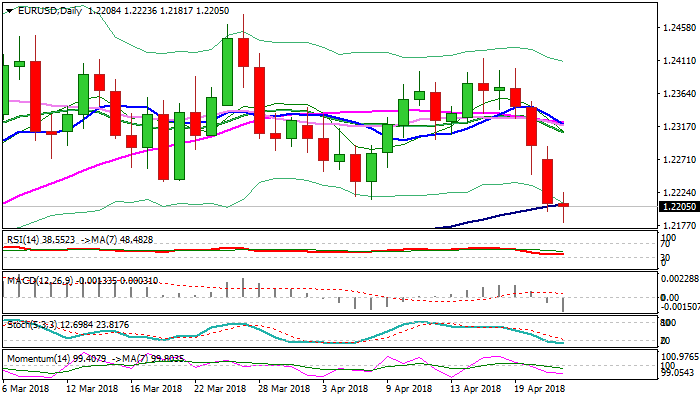
The Euro hit new session low at 1.2181 after weak German data added to negative outlook. IFO index fell below expectations in Apr )102.1 vs 102.8 f/c), continuing to deteriorate from January’s peak at 117.6 and signaling that German business morale falls further.
Weak IFO data add to concerns about the message from the ECB on Thursday (CB policy meeting) which is seen as mainly dovish and could further pressure the Euro on the outcome in line with expectations.
Bears look for negative signal on close below 100SMA (1.2206) and extension through key supports at 1.2172/53 (Fibo 38.2% of 1.1553/1.2555 / low of multi-month 1.2153/1.2555 congestion), firm break of which would generate strong bearish signal for deeper correction of 1.1553/1.2555 rally.
Daily cloud continues to weigh and cloud base (1.2235) is expected to ideally cap corrective upticks.
Res: 1.2206, 1.2235, 1.2290, 1.2308
Sup: 1.2172, 1.2153, 1.2092, 1.2054
Forex Analysis: GBPJPY And NZDUSD
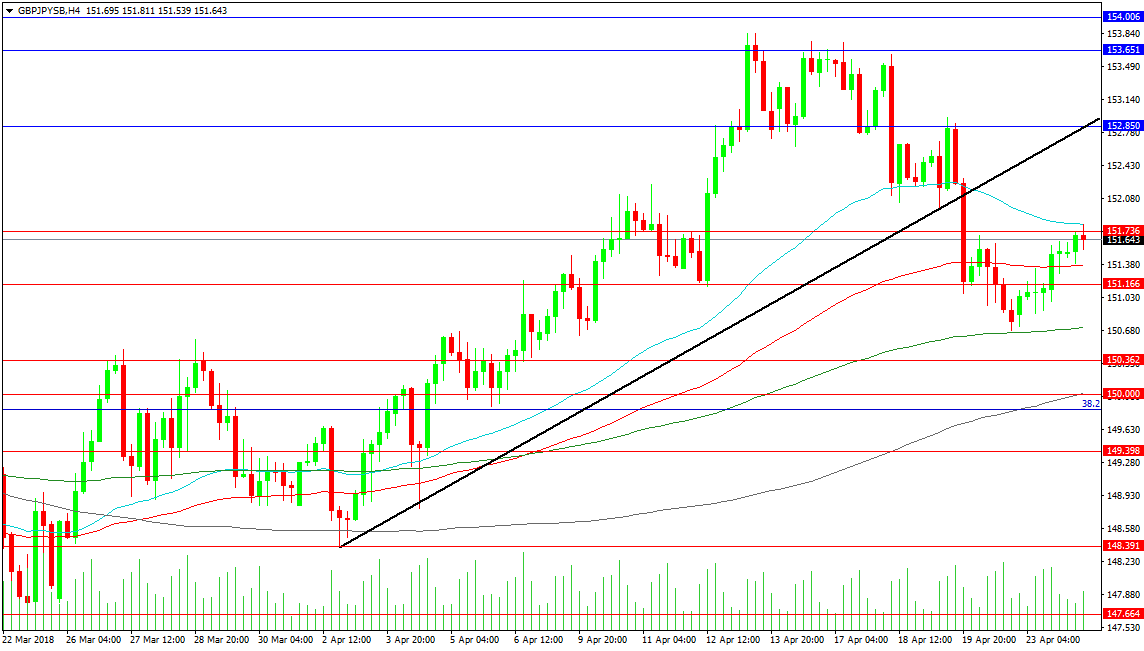
The GBPJPY pair has dropped back, after breaking the supporting trend line at the 152.100 level last week. The fall lower has found support at the 200-period MA at 150.655 and, today, price has retraced higher to resistance at the 50-period MA at 151.807. A break above this area would retarget the trend line at the 152.850 level and then the area of resistance between 153.651 and 154.000. A break higher above there would look to reach the 165.000 level.
Support can be seen at the moving averages including the 100-period at 151.375. There is support at the previous highs at 150.500, with a loss of this level opening the way for a test of 150.00. The 149.398 level was an area of consolidation used in March. Supports under this area come from previous higher lows at 148.391 and 147.664.
NZDUSD
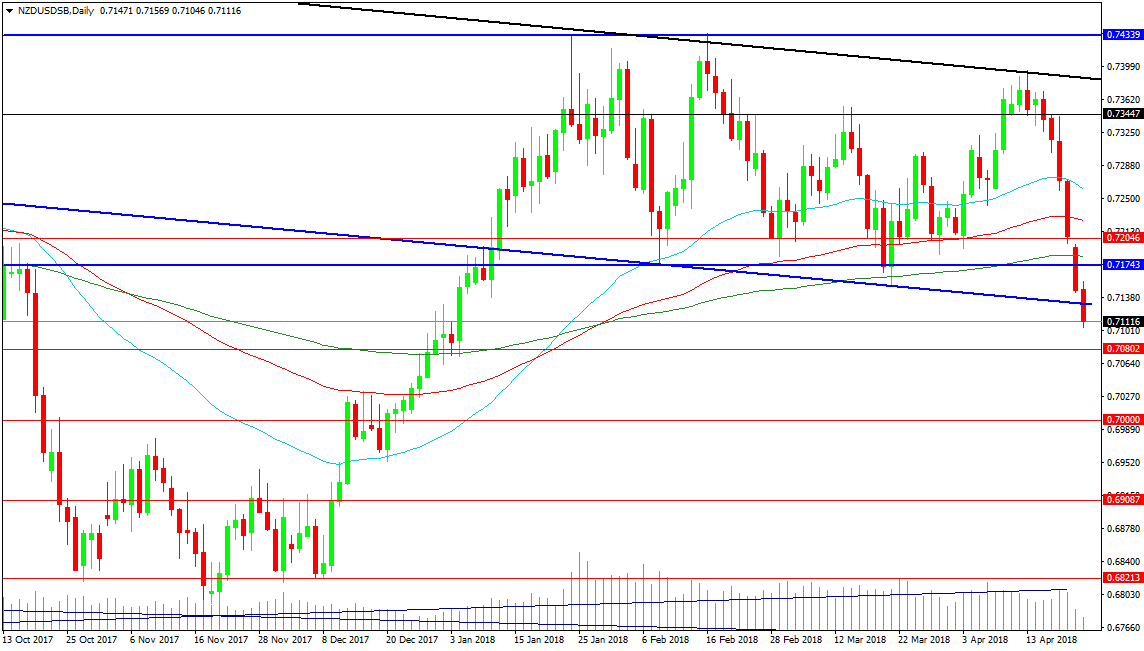
This pair has broken the supporting trend line today, leading to a sixth day of declines. The moving averages have been broken, with the 50-period used as resistance on Friday. Further declines target 0.70802, followed by 0.70000. This is a major level and price will need to stay above it to maintain any chance for long traders, but it will attract interest all the same. A loss of the level targets 0.69087 and 0.68213, where an area of support has developed extending down to 0.67500.
Resistance comes in at the 0.71743 level, with the 200-period MA at 0.71853. The 0.72046 level may provide light resistance, with a move higher testing the 50 DMA at 0.72606. A successful move up over this moving average puts long traders back in control and targets resistance at 0.73447 and the falling black trend line at 0.73865. The high at 0.74340 would be needed to eliminate any chance of a double top forming, with a target at 0.69100.
SPOT GOLD – Bears Take A Breather But Recovery Attempts Stay Capped By Daily Cloud
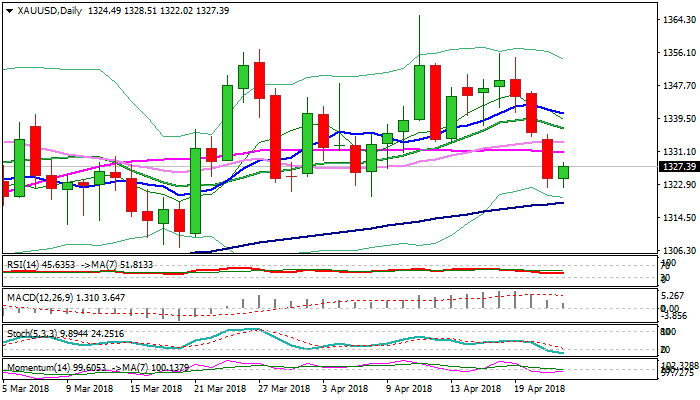
Gold price is higher on Tuesday on profit taking from three-day steep fall, which hit new 2 ½ week low at $1322.
The upside action was so far limited as strong dollar and reduced safe-haven demand continue to weigh.
Recovery attempts were so far capped by daily cloud base ($1328) and stronger upticks are expected to stay under solid resistances at $1331 (55SMA) and $1334 ( daily cloud top / 30SMA) to keep bears intact for fresh downside and test of 100SMA support at $1318.
Only firm break and close above daily cloud would sideline immediate downside risk and signal stronger retracement of $1355/22 bear-leg.
Res: 1328, 1331, 1334, 1337
Sup: 1322, 1318, 1315, 1311
WTI Crude Oil Futures Stands Near 3-Year High, Bullish Bias In Near Term
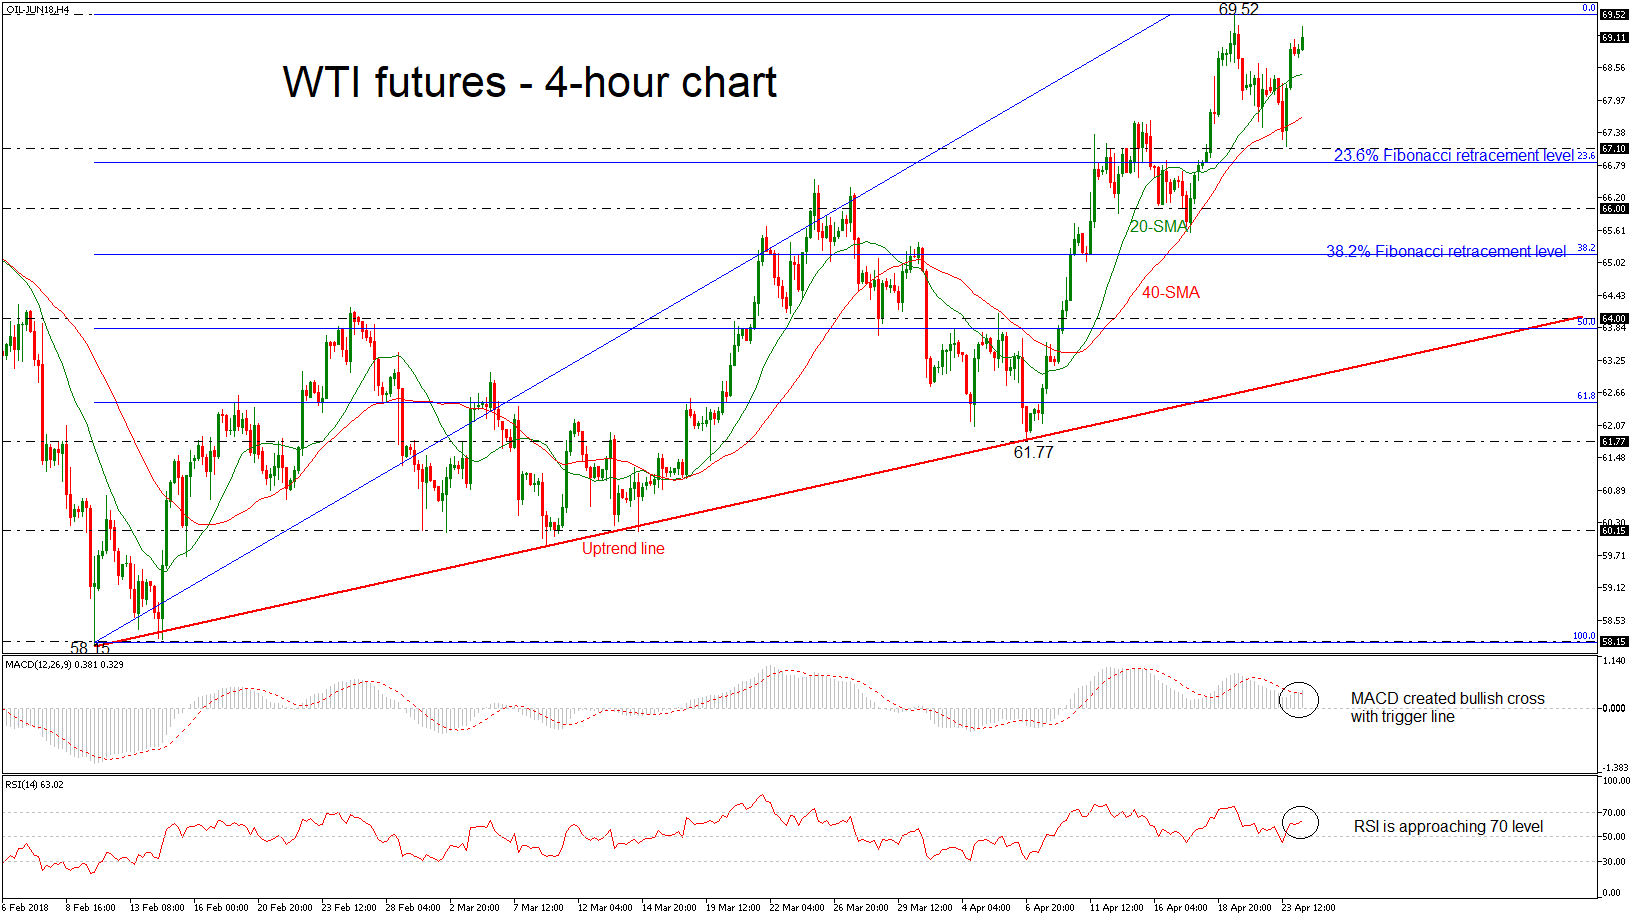
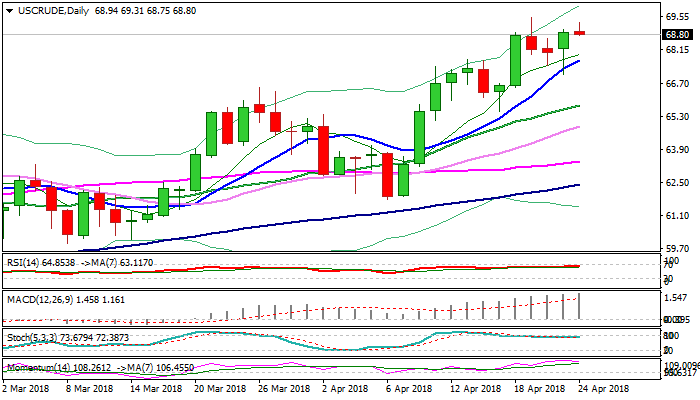
WTI futures have reversed back up again after finding support at the 67.10 barrier achieved on Monday. The price completed two straight bullish weeks and is approaching the three-year high of 69.52. The bullish picture in the short term is further supported by the technical indicators.
In the 4-hour chart, the MACD oscillator is rising and posted a bullish cross with its red trigger line, while the Relative Strength Index (RSI) is approaching the overbought level, near 70. The 20-simple moving average (SMA) is flattening, however, the 40-SMA is following the price action. The price is standing well above of the moving averages.
Further gains should see the April 19 high of 69.52 acting as a major resistance level. A successful close above this significant hurdle could open the door for the 63.00 handle.
In the event of a downside reversal, the 67.10 support could act as a barrier before being able to re-challenge the 23.6% Fibonacci retracement level near 66.80 of the upleg from 58.15 to 69.52.
It is worth mentioning that WTI crude oil has been developing within an uptrend since February 9, hitting several times the medium-term ascending trend line.
ECB Villeroy: Escalation of protectionist threats from US would dampen growth everywhere
Bank of France Governor, ECB Governing Council member Francois Villeroy de Galhau warned that "we are all aware that an escalation of protectionist threats from the United States would dampen growth everywhere."
And, he urged "Europeans, shoulder-to-shoulder with Canada, Japan and others, must resolutely defend international economic relations based on commonly respected rules and multilateral institutions."
Bitcoin Bounces Back
Bitcoin bounces back
After months in the doldrums, cryptocurrencies are finally back in the game as the total market capitalisation increases by $173bn to $418bn since the beginning of the month of April. Since the beginning of the week, Bitcoin’s price soared more than 5% and climbed above the $9,000 threshold as crypto’s outlook keeps improving.
Bitcoin is not the only cryptocurrency that enjoyed solid gains lately – it even underperforms most of other coins – as Ethereum rose 90% since April 1st, jumping from $358.4 to $684 this morning, while Bitcoin cash rose 140% to $1,570.
One may wonder why the entire market has been surging lately as no major news was released. However, given the harsh first months of the year, a period of respite was inevitable – and more than welcomed – especially against the backdrop of improving outlook on the regulatory side. It is also worth mentioning that the Lightning Network is maturing as the number of channels increases exponentially. Indeed, data showed that there is around 7,000 active channels which process transactions without impacting systematically the blockchain. Even though the network is still very young (first physical purchase was done in January 2018), it is matching market’s expectations in term of transaction fees and transaction rate: Bitcoin will be able to compete with traditional (read non-decentralized) payment systems.
Given the relative underperformance of Bitcoin compared to the market, we believe there is still upside potential, with the $10,000 mark as next target.
European industry executives’ business confidence fears start fading
Following two straight decline since January 2018, Eurozone Markit purchasing managers index (PMI) data holds steady, given at 55.20 (consensus: 54.80), signaling a rise in business activities following a shaky start in 2018. Supported by a slight acceleration in Services PMI (55) and a decline in Manufacturing PMI (56), both single currency appreciation and threatening commercial instability effects played their role, curbing exports since the beginning of the year.
France and Germany PMI data published on Monday pointed toward the same direction: services remained largest contributor while manufacturing weakened, indicating that the block leaders bolster a solid start for the Eurozone in Q2.
Due on Thursday, European Central Bank Monetary Policy meeting will maintain current interest rate at -0.40% unchanged, as expected by most market participants. Current economic data point toward a recovery in economic growth, supported by cautious normalization policy implementation from European central bankers. No rate hikes are expected for 2018 from today.
Approaching hourly resistance at 1.2165 (17/01/2018 low), EUR/USD is trading at January low. The technical structure suggests short-term downward moves, heading along the 1.2180 range.
DAX30 Continuation Of Bullish Trend
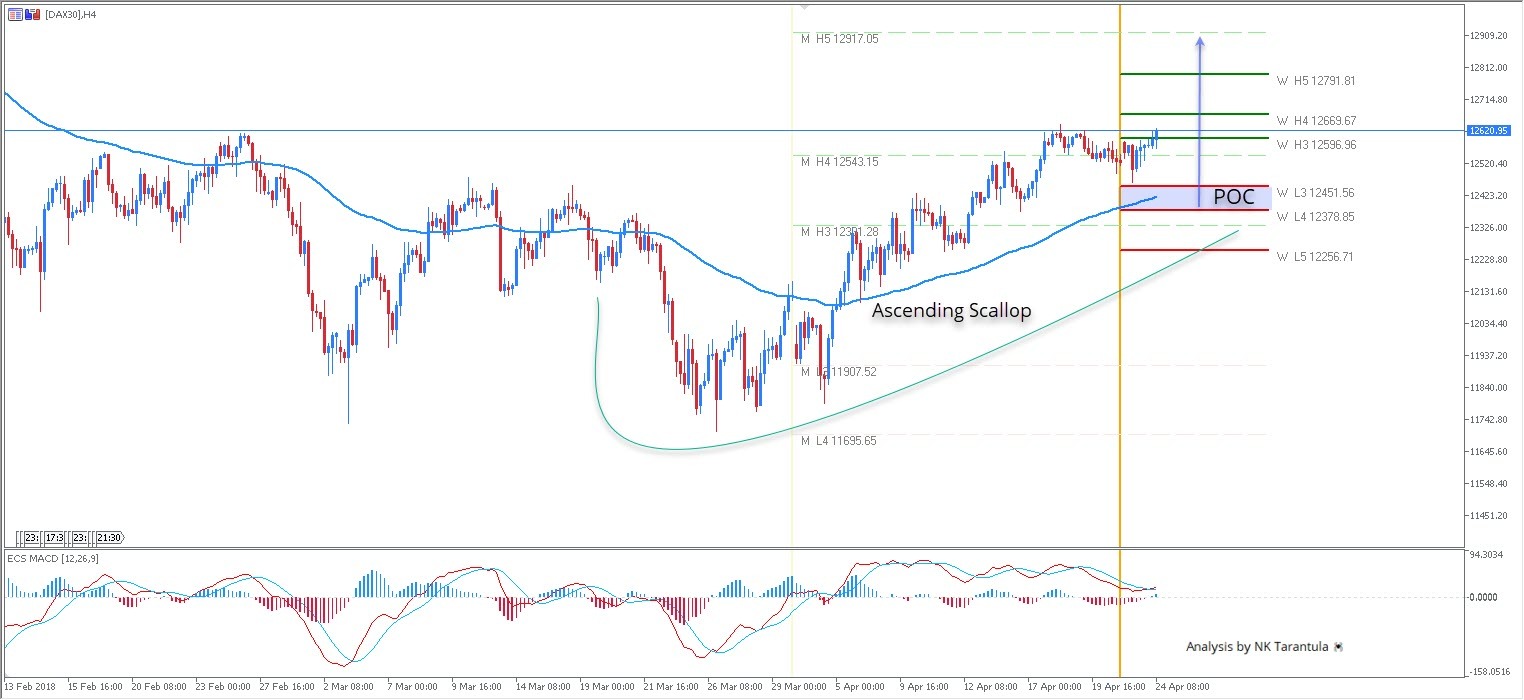
As we could see from my previous DAX30 analysis, the price action was totally respected and there is still potential for upside continuation. 12378-451 is the POC zone and we might see a rejections if the price retraces within the POC zone. Continuation above W H3 and W H4 should target W H5 – 12791. Final monthly resistance is 12917 – and we should see a profit taking if the price hits the level. Only a break below W L5 – 12255 will invalidate the ascending scallop bullish setup.
W L3 - Weekly Camarilla Pivot (Weekly Interim Support)
W H3 - Weekly Camarilla Pivot (Weekly Interim Resistance)
W H4 - Weekly Camarilla Pivot (Strong Weekly Resistance)
M H4 - Monthly Camarilla Pivot (Very Strong Monthly Resistance)
M L3 – Monthly Camarilla Pivot (Monthly Support)
M L4 – Monthly H4 Camarilla (Very Strong Monthly Support)
POC - Point Of Confluence (The zone where we expect price to react aka entry zone)
WTI OIL – Near-Term Focus Turns Higher On Fresh Geopolitical Concerns
WTI oil regained strength and bounced above $69 on Tuesday, after attempts to extend corrective pullback from new high at $69.54 (posted on 19 Apr) was strongly rejected on Monday.
Rising 10SMA contained dip and continues to underpin fresh advance (currently at $67.71).
Firm bullish setup of daily techs remained intact and fresh attempts higher turn focus towards initial target at $70.00.
Oil bulls regained traction on renewed geopolitical tensions in the Middle East and concerns about possible supply disruptions in key oil producing countries, offsetting negative impact from increasing US oil production.
Focus turns towards US supply data, which would provide more details about demand in world’s largest oil consumer country.
API report is due late today and markets will be closely watching the outcome after previous week’s stronger than expected draw in oil inventories.
Res: 69.54, 70.00, 71.86, 73.10
Sup: 68.75, 67.68, 67.12, 66.64
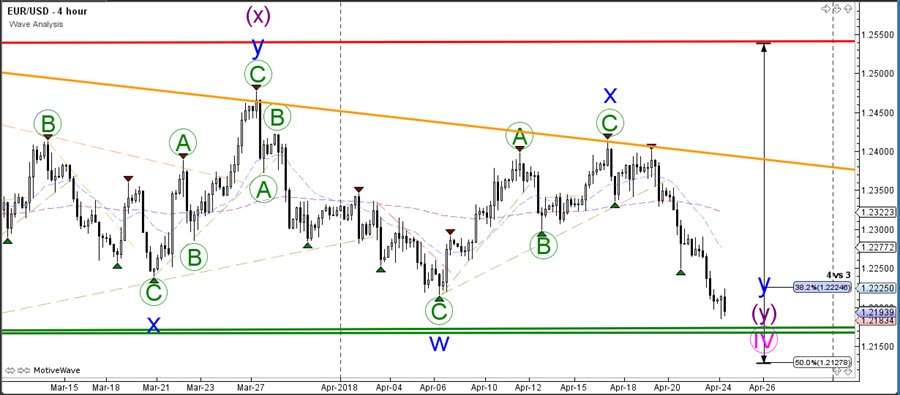
EUR/USD, GBP/USD Bearish Momentum Approaches Support Zones
The EUR/USD bearish momentum is approaching a key support zone. A bullish bounce would confirm the wave 4 (pink) correction whereas a bearish break below the 50% Fibonacci level would make a downtrend more likely. The wave 4 (pink) is the most likely pattern at the moment but price needs to confirm this pattern by making a bullish reversal at the support zone (green lines).
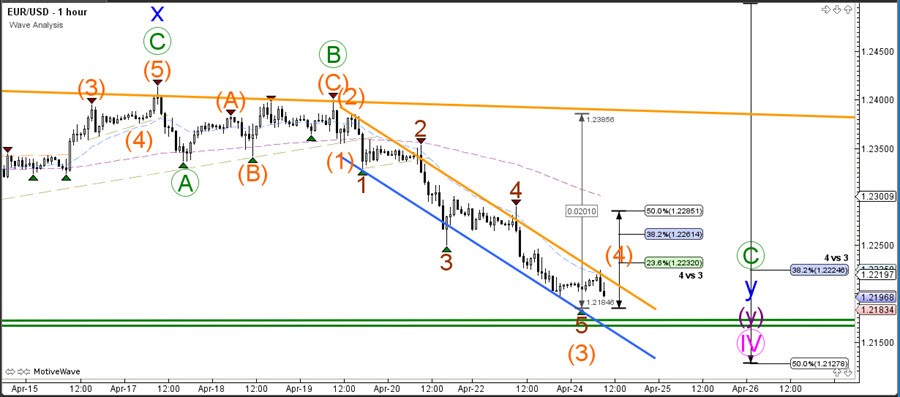
The EUR/USD bearish channel could be completing 5 bearish waves soon due to the proximity of the support zone. A bear flag pattern could still be part of a wave 4 (orange) and one more lower low is possible within the bearish correction. As long as price stays above the 1.21-1.22 support zone, price is vulnerable for a bullish reversal.
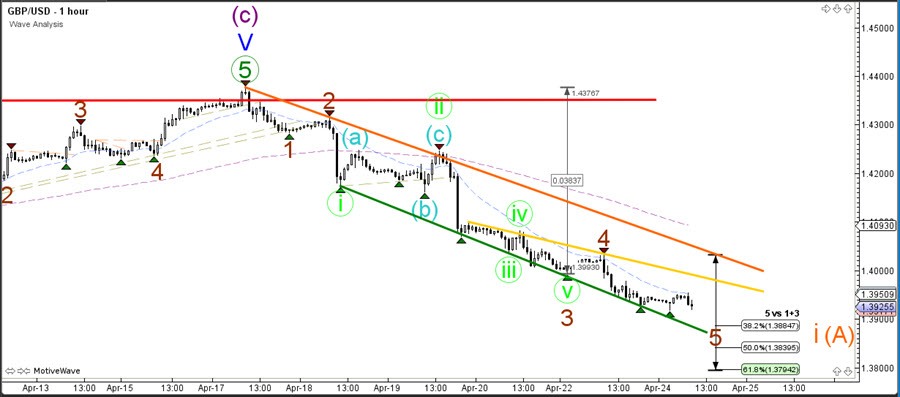
The GBP/USD bearish momentum is in a strong downtrend channel, which broke below the 1.40 support level. Price could however be close to completing 5 bearish waves within wave 1 or A (orange).
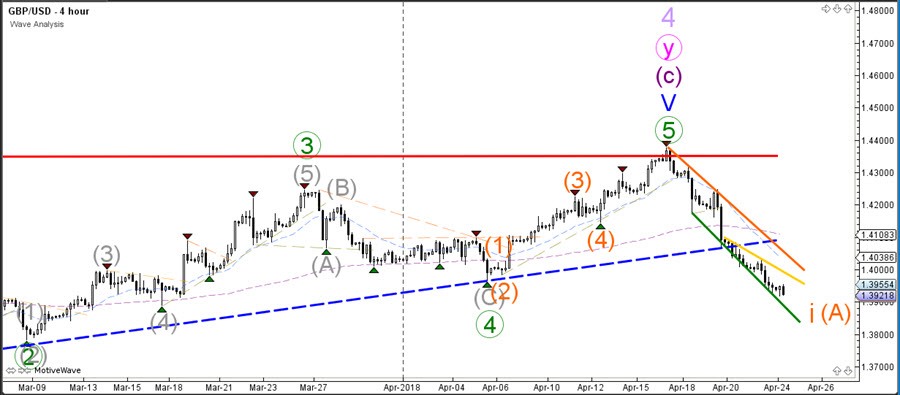
The GBP/USD could extend its bearish momentum towards the Fibonacci targets. Eventually a bullish retracement could occur and price will make a larger bullish correction. For the moment, the bearish pressure will probably take price down for a new lower low.