Sample Category Title
USD/CHF Weakening
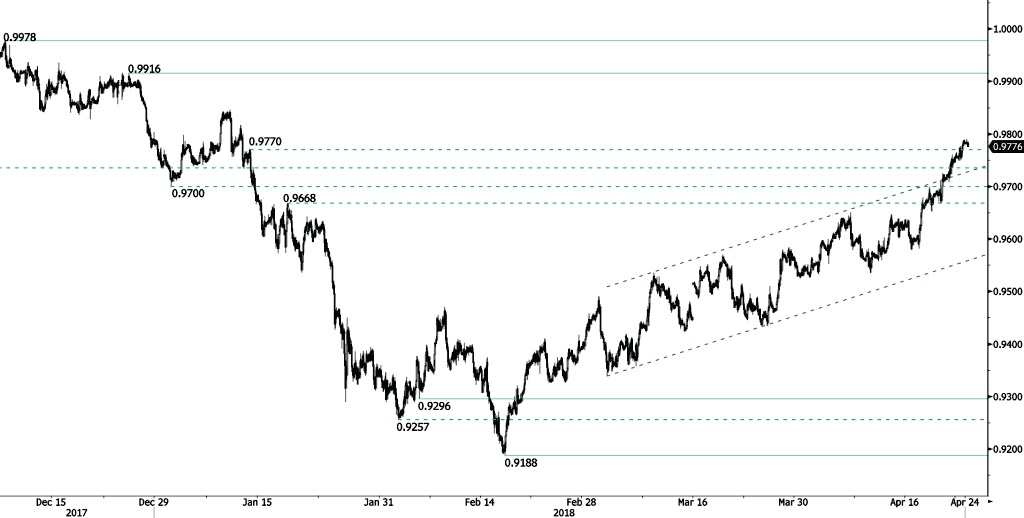
USD/CHF rise started at 0.9581 pauses, breaking hourly resistance at 0.9770 (12/01/2018) and heading along the 0.9765 range. The bullish pattern started from 0.9188 (16/02/2018 low) continues. The pair is contained between hourly support and resistance given at 0.9296 (05/02/2018 low) and 0.9916 (26/12/2017 high). The technical structure suggests short-term downward trading moves.
In the long-term, the pair is still trading in range since 2011 despite some turmoil when the SNB unpegged the CHF. Key support lies at 0.9072 (07/05/2015 low) while resistance at 1.0344 (15/12/2016 high) is distanced. The technical structure favours a long term bullish bias since the unpeg in January 2015.
USD/JPY Heading Higher
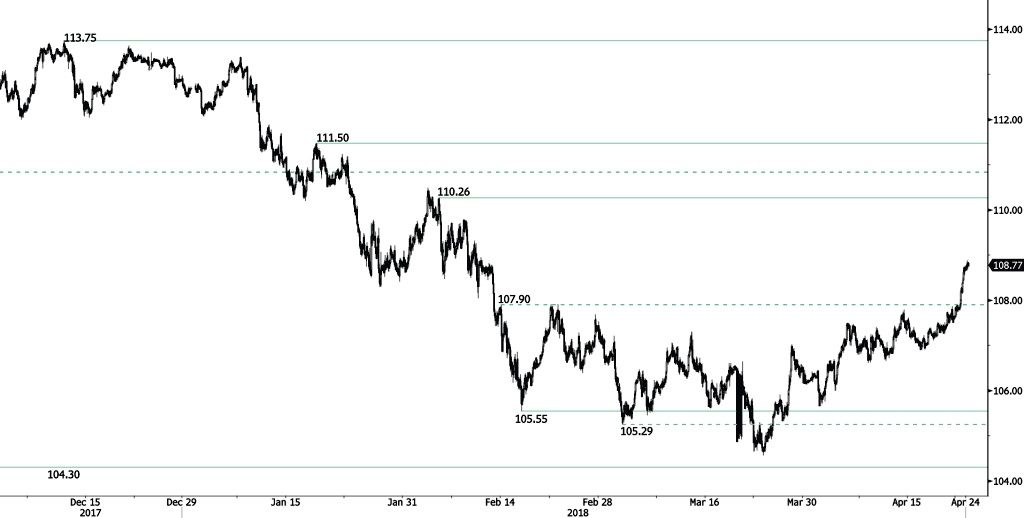
USD/JPY bounce from 106.90 low continues, the pair broke hourly resistance at 107.90 (14/02/2018). Heading along the 109 range. The bearish pattern started in January 2018 is weakening. Hourly support and resistance are given at 105.55 (16/02/2018 low) and 110.26 (05/02/2018 high). The short-term technical structure suggests continued short-term upward moves.
We favor a long-term bearish bias. Support remains at 101.20 (09/11/2016 low). A gradual rise toward the major resistance at 125.86 (05/06/2015 high) seems unlikely. Expected to decline further support at 101.20 (09/11/2016 low). The pair trades below its 200 DMA.
GBP/USD Trying To Bounce
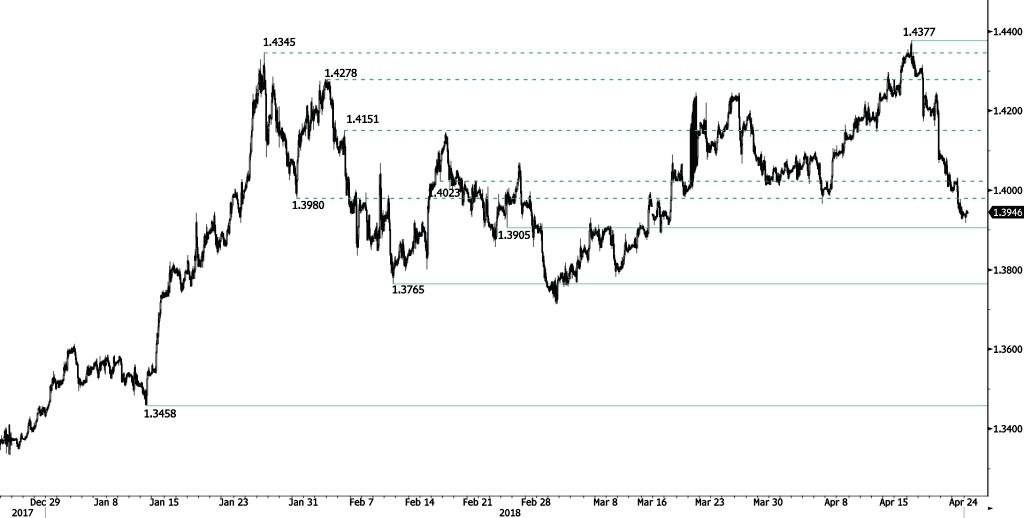
GBP/USD is bouncing off from 1.3918 low, heading along the 1.3955 range. The pair is currently trading at mid-March high. Hourly support and resistance are given at 1.3905 (23/02/2018 low) and 1.4377 (17/04/2018 high). The technical structure suggests short-term increase.
The long-term technical pattern is reversing. The Brexit vote had paved the way for further decline but the pair is moving to 2016 highs. Long-term support and resistance are given at 1.1841 (07/10/2017 low) and 1.5018 (24/06/2016 high).
EUR/USD Trying To Bounce
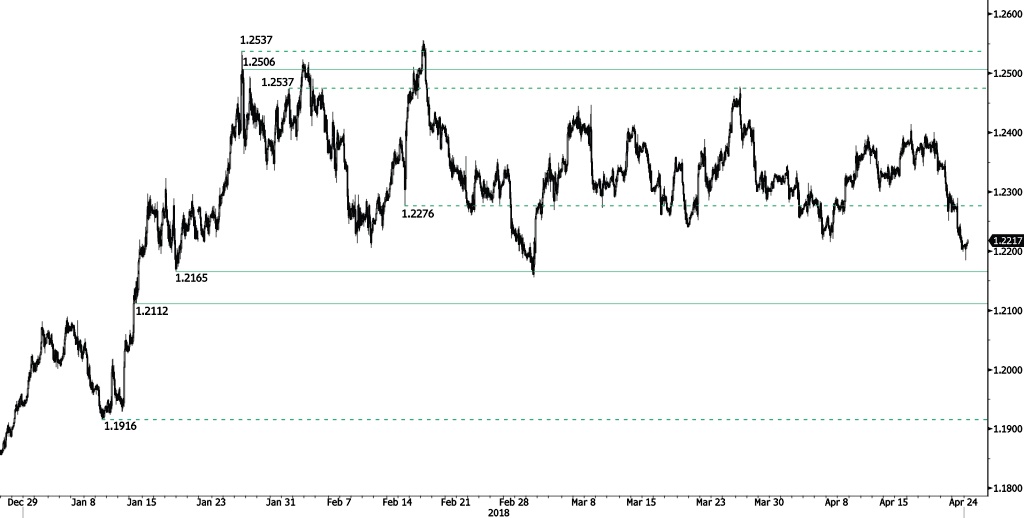
EUR/USD is trying to recover following recent decrease from 1.2289 high, heading along the 1.2220 range. The pair is currently maintained between hourly support and resistance given at 1.2165 (17/01/2018 low) and 1.2506 (25/01/2018 high). The technical structure suggests shortterm upward trading moves.
In the longer term, the momentum is turning largely positive. We favor a continued bullish bias. Key resistance is holding at 1.2886 (15/10/2014 high) while strong support lies at 1.1554 (08/11/2017 low).
Japan Economy Minister Motegi: No trade talk with US until mid June, and we still don’t want bilateral FTA
Japan's Economy Minister Toshimitsu Motegi said today that trade discussion with US Trade Representative Robert Lighthizer will begin around mid-June or later.
There was an agreement between Japan Prime Minister Shinzo Abe and US President Donald Trump on setting up a new framework focusing on bilateral trade. But Motegi reiterated today that "we're not thinking of signing a bilateral FTA."
It's believed that Japan's priority is on TPP, the pact that it leads with 10 other nations. And Abe's cabinet would want to pass relevant legislations through the parliament within the current session which ends on June 20. In addition, Japan has been clear that it opposes to a two way trade deal. On the other hand, Trump and Treasury Secretary Steven Mnuchin showed no respect to Japan's preference and persistently tried to force bilateral trade agreement on Japan.
GBPUSD Steadies After Steep Losses, Remains In Sideways Channel
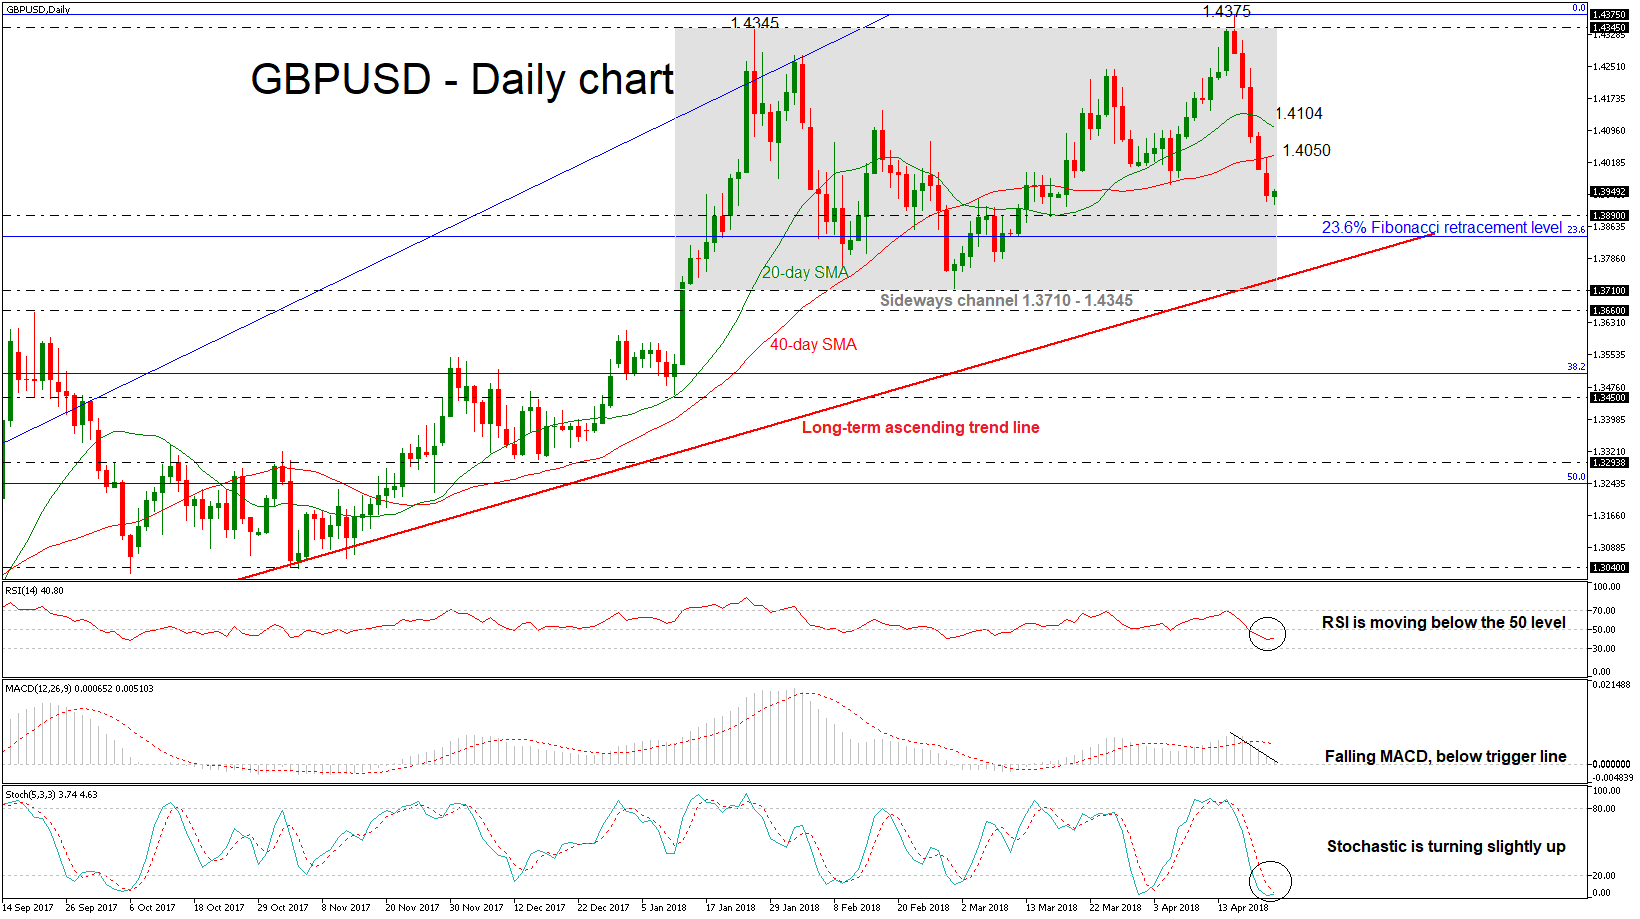
GBPUSD sank aggressively over the last five trading days following the bounce off the 22-month high of 1.4375, which it hit last week. The pair recorded a new five-week low during today’s Asian session of 1.3917. Price action is at the moment taking place not far above this bottom.
The RSI has fallen into negative territory but is sloping slightly to the upside, indicating that the market could weaken a little bit in the short-term to provide further losses. Stochastics are still in oversold levels, with the indicators turning slightly upwards, while the MACD supports a bearish picture since the index continues to increase negative momentum below its red-signal line.
Should the market extend losses, support could be met between the 1.3890 level and the 23.6% Fibonacci retracement level of 1.3840 of the upleg from 1.2100 to 1.4345, which holds near the long-term ascending trend line. Steeper decreases though could drive the price below the significant diagonal line, shifting the bias to bearish. Then, the market could challenge the 1.3660 – 1.3710 support zone.
Conversely, if the pair bounces up, immediate resistance could be met at the 40-day simple moving average near 1.4050 and then it could touch the 20-day SMA around 1.4104. A jump above these obstacles could drive the price north towards the 1.4345 resistance level
Looking at the medium-term, the price has been trading within a sideways channel since mid-January with upper boundary the 1.4345 resistance level and lower boundary the 1.3710 support. Turning to longer-timeframe, the cable is still endorsing a bullish scenario as it has been holding in an ascending move since March 2017.
Dollar Bulls ‘Back On The Case’, US Consumer Confidence Due
Here are the latest developments in global markets:
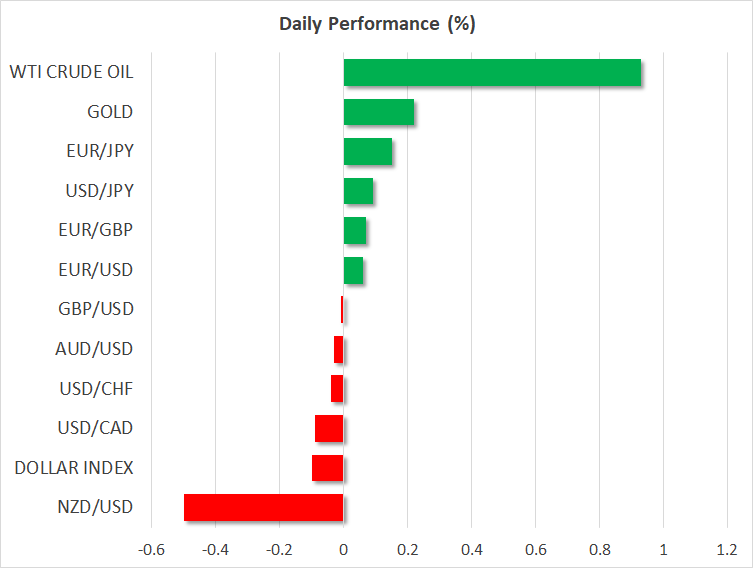
FOREX: The US dollar traded 0.1% lower against a basket of six major currencies on Tuesday, giving back some of the notable gains it posted yesterday on the back of surging US bond yields. Despite today's pullback, the dollar index is still trading near a three-month high. Elsewhere, kiwi/dollar fell by 0.5%, with no clear fundamental catalyst behind the decline.
STOCKS: US markets closed lower yesterday, for the most part. While the Nasdaq Composite and the Dow Jones declined by 0.25% and 0.06% respectively, the S&P 500 managed to eek out a 0.01% gain, and close in positive territory. Equities appear to be struggling amid a sustained increase in US bond yields, a factor that typically weighs on demand for stocks as bonds start to offer a better return. Asian indices, on the other hand, were mostly in the green today. In Japan, the Nikkei 225 and the Topix climbed by 0.86% and 1.08% correspondingly, boosted by a fall in the yen. In Hong Kong, the Hang Seng advanced 0.85%. In Europe, futures tracking the major indices were mixed, though all were close to neutral territory.
COMMODITIES: Oil prices are higher today, building on their gains from yesterday. WTI and Brent crude are up by 0.9% and 0.8% respectively, both trading near their respective three-and-a-half year highs. There were no major oil-related headlines, so prices appear to be supported by speculation that fresh sanctions on Iran are looming, and that Saudi Arabia is committed to boosting prices. In precious metals, dollar-denominated gold is 0.2% higher today, recovering some of the losses it posted yesterday as the US dollar surged. Elsewhere, aluminum prices plunged 7% on Monday, after the US extended the deadline for sanctions on Russia's aluminum producer, Rusal.
Major movers: Dollar propelled higher by surging Treasury yields
The US currency enjoyed another day of advances on Monday, with the dollar index reaching its highest level since January 12, propelled higher by a sustained rise in longer-term US Treasury yields. The yield on 10-year Treasuries climbed to 2.998% before retreating somewhat, coming just shy of touching the notorious 3.0% level, and increasing the attractiveness of the greenback overall.
Technically, the dollar index is at an important crossroads. It is trading just below the 91.00 zone, which is the upper bound of the sideways range that has contained the price action since the middle of January, between that hurdle and 88.20. A decisive break above 91.00 in the coming days would mark a higher high on the daily chart, thereby turning the technical picture to cautiously positive, from neutral currently.
Fundamentally, it is interesting to note that the rise in US yields has been accompanied by a hawkish repricing of Fed rate expectations. At the time of writing, markets have fully priced in two more quarter-point rate hikes this year, and also see a 25% probability for a third one according to the Fed fund futures. For comparison, just a few days ago, only one more hike was fully priced in and markets saw an 80% chance for a second one. Thus, investors appear to be betting that the commodity-related surge in inflation that is likely to occur in the coming months will lead the Fed to act more aggressively, lending support to the greenback.
In the antipodean sphere, aussie/dollar is practically unchanged, following a mixed bag of inflation data out of Australia. While the headline CPI rate for Q1 disappointed slightly, the trimmed mean rate surprised to the upside. Overall though, this set of data suggests there is no pressure on the RBA to act any time soon, reinforcing the narrative the Bank is set to remain on hold through 2018.
As for kiwi/dollar, it is 0.5% lower today, without any clear fundamental trigger behind the plunge.
Day ahead: Ifo surveys out of Germany; US consumer confidence and new home sales also due
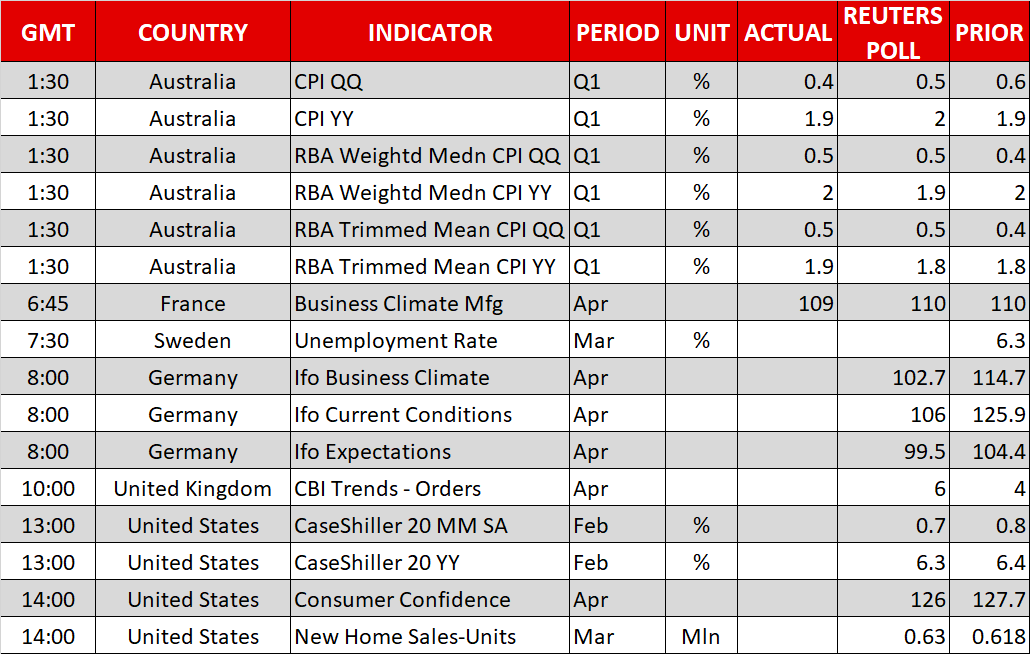
Tuesday's calendar features the release of business confidence surveys out of Germany, as well as consumer confidence and new home sales data out of the US.
At 0730 GMT, krona pairs will be in focus as Sweden sees the release of March's unemployment rate.
The Ifo Institute for Economic Research will publish its business climate index for Germany at 0800 GMT. The measure, which gauges business confidence, is anticipated to continue declining in April, falling to its lowest since late 2012 and pointing to further loss of economic momentum in the eurozone's largest economy. The institute's current conditions and expectations indices will also be made public at the same time and are also expected to record declines.
In the UK, the Confederation of British Industry will release its order book balance for the month of April. Analysts are projecting an increase, after factory orders fell to a five-month low in March (though still remained relatively robust by historic standards).
The most important releases out of the US will pertain to the Conference Board's consumer confidence gauge for April and March's new home sales. Consumer confidence is forecast to ease for the second straight month, though still remain at elevated levels, while new home sales are projected to rise by 1.9% m/m, more than making up for February's fall of 0.6%. Earlier in the day (1300 GMT), the Case-Shiller indices, gauging house prices, will also be made public out of the world's largest economy.
In one of the busiest weeks in terms of corporate earnings releases, 3M and Harley-Davidson are among companies releasing results on Tuesday; both report before Wall Street's opening bell.
In energy markets, the API weekly report on crude inventories is due at 2030 GMT.
Policymakers making appearances include Bank of England Governor marks in store this time arounMark Carney and Philadelphia Fed President Patrick Harker, a non-voting FOMC member in 2018 (both at 1800 GMT). Last week's comments by the former led to a tumble in hike odds by the BoE during its May meeting and it will be interesting to see whether he has any market-sensitive red.
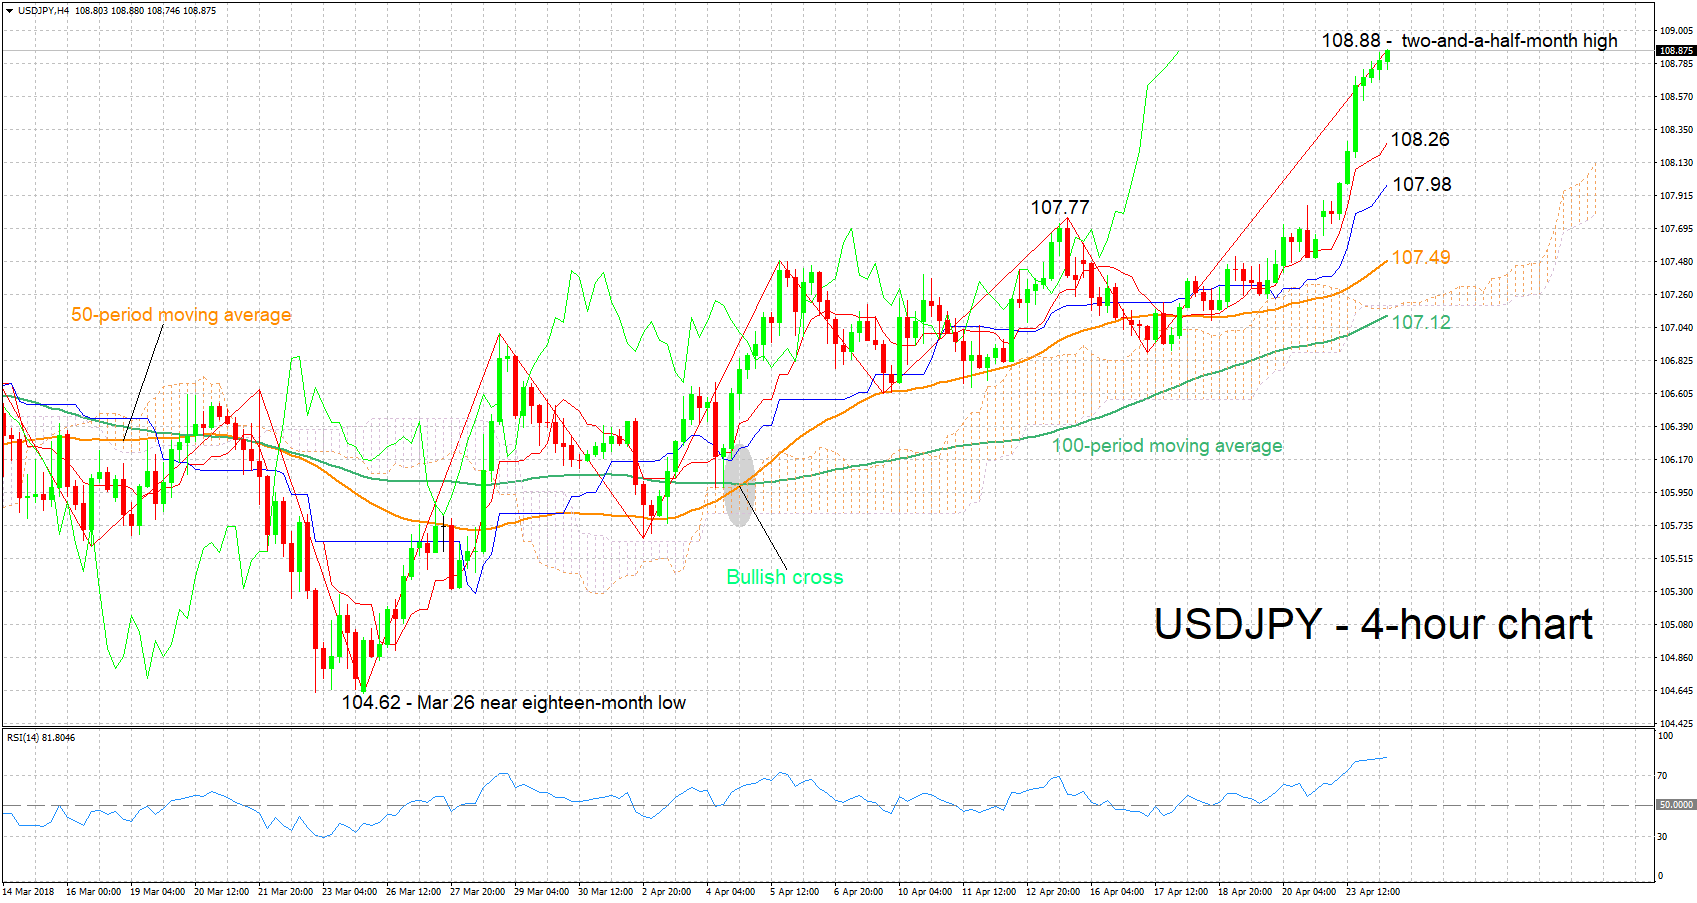
Technical Analysis: USDJPY short-term bullish at 2½-month high; RSI overbought
USDJPY just recorded a two-and-a-half-month high of 108.88. The positively aligned Tenkan- and Kijun-sen lines are projecting a bullish short-term picture. The RSI supports this view as it is well above its 50 neutral-perceived level and continues rising. Notice though that the indicator's positive slope has eased somewhat – something which might signal weakening positive momentum – while it is also in overbought territory above 70.
Upbeat US releases later in the day might add further gains to the pair. The area around the 109 round figure might be acting as a barrier to gains at the moment, with an upside break potentially targeting the 110 handle, that may also hold psychological significance.
Weaker-than-anticipated data might open the window for profit-taking, pushing the pair lower. Support to declines could come around the current levels of the Tenkan- and Kijun-sen lines at 108.26 and 107.98 respectively. The range around the latter also encapsulates the 108 handle.
US-Japanese bond yield differentials also have the capacity to spur movements in the pair.
German Ifo business climate dropped to 102.1, EURUSD dip to day low
German Ifo business climate dropped to 102.1 in April, below expectation of 102.8. Expectations dropped to 98.7, below consensus of 99.5. Current assessment also dropped to 105.7, below expectation of 106.5.
Ifo President Clemens Fuest commented that "high spirits among German businesses have evaporated," and, "the German economy is slowing down." Ifo economist Klaus Wohlrabe noted that the 5th drop in a row in the Ifo reading is merely a sign of normalization, and Germany is far from a recession. GDP growth is seen as slowed to 0.4% in Q1 versus Q4's 0.6%.
EUR/USD dips to day low after the release and is on course for 1.2154 support.
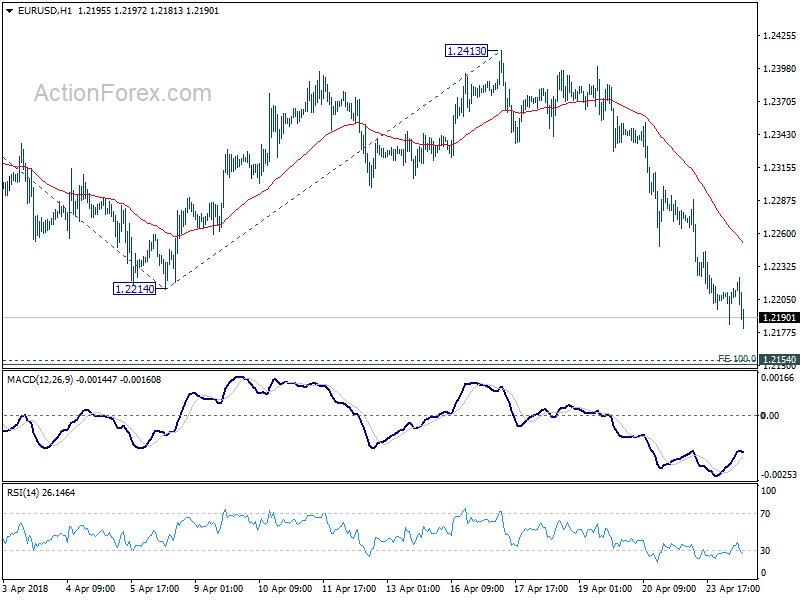
EURUSD – Bears Pressure Key Supports At 1.2172/53
The Euro extends steep three-day fall on Tuesday and broke below rising 100SMA (1.2206) which was cracked on Monday's strong bearish acceleration when the pair was down 0.5%.
The single currency was down around 1.5% on fall from 1.2413 high, pressuring key supports at 1.2172 (Fibo 38.2% of 1.1553/1.2555) and 1.2153 (low of multi-month 1.2153/1.2555 congestion.
Monday's close below the base of thick daily cloud at 1.2235 was strong negative signal for final attack at 1.2172/53 pivots.
Break here would sideline broader bulls and trigger deeper correction of broader uptrend from 1.0304 (Jan 2017 low).
Multiple daily MA's bear-crosses and firmly bearish momentum studies support further weakness, however, bears may take a breather before attacking 1.2172/53 pivots, as slow stochastic is deeply oversold on daily chart. But without firmer bullish signal so far.
Broken 100SMA marks initial barrier, guarding more significant daily cloud base, which is expected to cap upticks and keep bears intact.
Only penetration and close within cloud would sideline immediate downside risk and signal stronger correction of steep fall from 1.2413 (17 Apr high).
Res: 1.2206, 1.2235, 1.2290, 1.2308
Sup: 1.2172, 1.2153, 1.2092, 1.2054
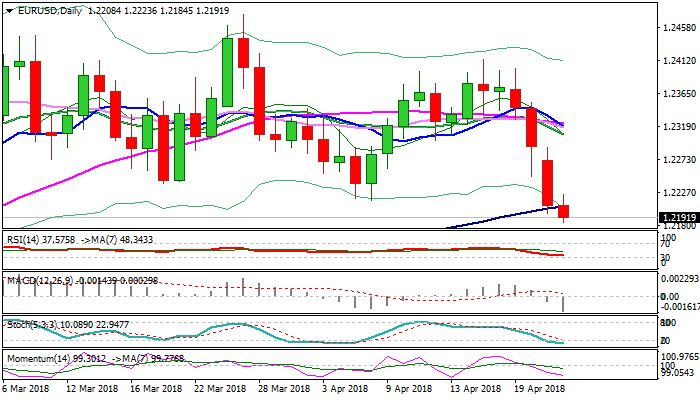
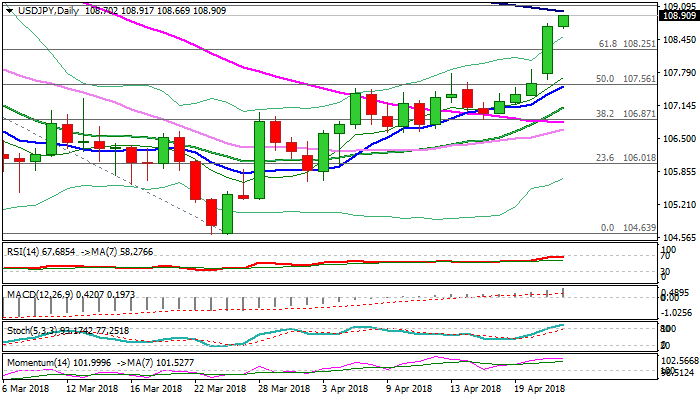
USDJPY – Bulls Eye Key Barriers At 109.00/31, Corrective Easing May Precede Fresh Rally
The pair maintains firm bullish tone in early Tuesday’s trading and extended strong rally on Monday (up 0.85%, the biggest one-day gain since 28 Mar) to new 2 ½ month high at 108.87.
Close above double-Fibonacci barriers at 108.25/49 on Monday was strong bullish signal for test of next targets at 109.00 (falling 100SMA) and 109.31 (daily cloud top).
The dollar continues to advance, supported by rising US yields and eventual break through 109.00/31 pivots would generate another strong bullish signal and accelerate further after triggering stops, parked above.
Bulls may take a breather before breaking above 109.00/31 barriers as slow stochastic is overbought on daily chart, but without firmer bearish signal for now.
Corrective dips are expected to offer better buying opportunities.
Daily Tenkan-sen in steep ascend continues to underpin the advance (currently at 107.78) and expected to contain extended dips.
Res: 109.00, 109.31, 109.78, 110.00
Sup: 108.66, 108.49, 108.25, 107.78