Sample Category Title
Gold Price Remains Supported Above $1,328
Key Highlights
- Gold price found support near the $1,320 level and recovered recently against the US Dollar.
- There are two bullish trend lines forming with support near $1,328 on the 4-hours chart of XAU/USD.
- The US PPI in March 2018 posted a rise of 3% (YoY), more than the forecast of 2.9%.
- Today, the US CPI report for March 2018 will be released, which is forecasted to increase by 2.4% (YoY).
Gold Price Technical Analysis
After a major decline, gold price found support near the $1,320 level against the US Dollar. The price traded higher and moved above the $1,330 resistance zone.
There was also a break above the 50% Fib retracement level of the last decline from the $1,348 high to $1,319 low. More importantly, the price settled above the 200 simple moving average (green, 4-hour) and the 100 simple moving average (red, 4-hour).
On the downside, there is are two bullish trend lines forming with support near $1,328 on the 4-hours chart of XAU/USD. The trend line support is near the 200 SMA, which means the $1,328 level is a crucial area for buyers.
As long as the price is above the $1,328 support, it may continue to move higher. On the upside, there is a connecting bearish trend line with resistance at $1,341 on the same chart. A break above $1,341 could clear the path for more gains towards $1,350 in the near term.
Recently, the US PPI report for March 2018 was released by the Bureau of Labor statistics, Department of Labor. The market was looking for a 2.9% rise compared with the same month a year ago.
The actual result was positive as the PPI increased 3% in March 2018. In terms of the monthly change, there was a rise of 0.3%.
Overall, it seems like there could be ranging moves in gold price ahead of today’s US CPI and FOMC meeting minutes release.
Economic Releases to Watch Today
- UK Industrial Production for Feb 2018 (MoM) – Forecast +0.4%, versus +1.3% previous.
- UK Manufacturing Production for Feb 2018 (MoM) – Forecast +0.2%, versus +0.1% previous.
- UK Goods Trade Balance for Feb 2018 – Forecast £-11.950B, versus £-12.325B previous.
- US Consumer Price Index March 2018 (MoM) – Forecast 0%, versus +0.2% previous.
- US Consumer Price Index March 2018 (YoY) – Forecast +2.4%, versus +2.2% previous.
- US Consumer Price Index Ex Food & Energy March 2018 (YoY) – Forecast +2.1%, versus +1.8% previous.
- FOMC Meeting Minutes.
AUDNZD Forming A Long Term Ascending Triangle
Today we've got a potential setup forming on the AUDNZD weekly chart. What we're seeing here is the testing of a multi-year rising trendline. With price currently at this area of support we can assume one of two things will occur; 1 – Support will hold and price will bounce off our trendline, or 2 – Support won't hold and price will continue it's medium-term downward momentum.
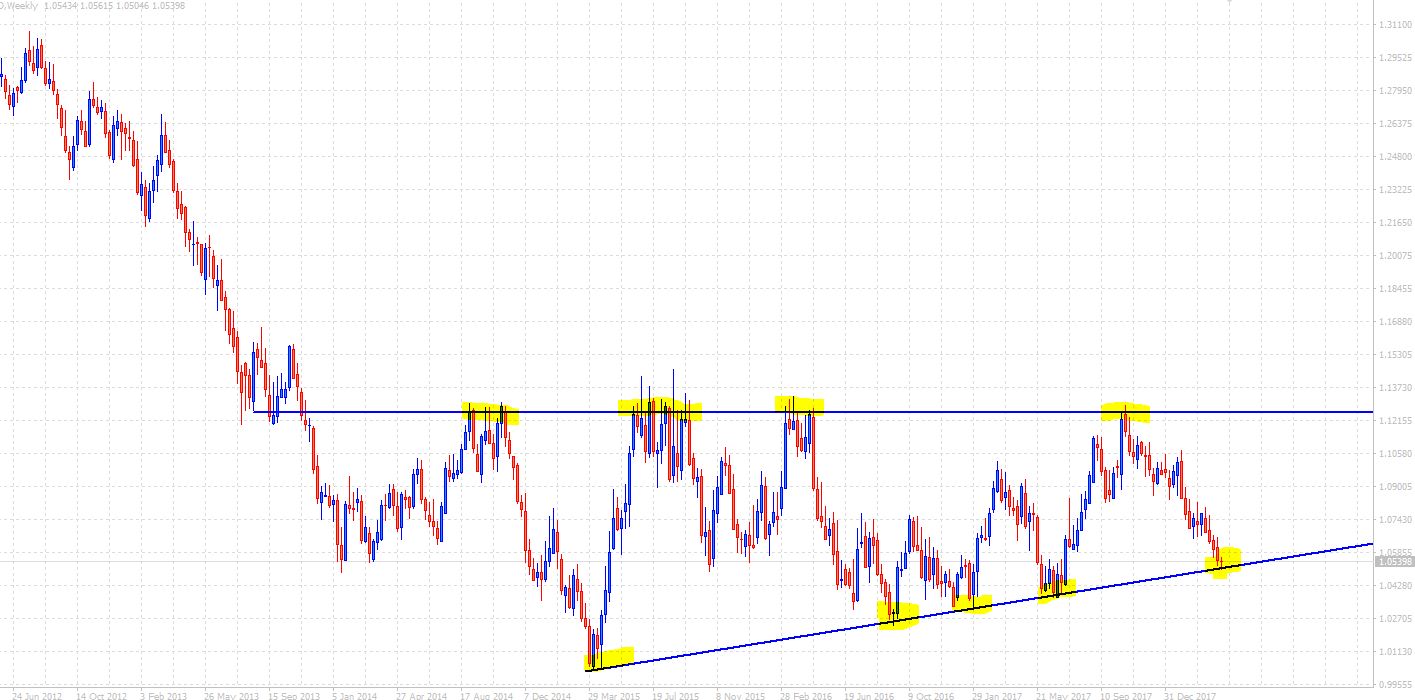
If we consider the horizontal multi-year resistance line above, we can see that price has been range bound in between these two lines for close to four years. These two trendlines also form the makings of an ascending triangle which in the long term could result in a significant trend reversal.
There are a few ways to potentially play this current setup:
- A trader could look to buy a rejection of our rising support trend line with quite favourable risk-reward;
- A trader could look for a confirmed break through support and short; or,
- We could sit on the sidelines and see if our ascending triangle forms and buy the breakout of the confirmed pattern
Having been in a multi-year downtrend, this pattern could potentially indicate a bottom and personally I favour the long side purely because the risk-reward is appealing to me.
Xi Is Music To The Markets Ears
Xi is music to the market's ears
US stock markets are flying on President Xi's conciliatory overtones over tariffs have diffused building trade war tensions Investors took great comfort in his remarks as the S&P500 remained on the ups into the closing bell. In a market starved of good news, Xi's dialled back trade war rhetoric was music to investor's ears.
While investors are relishing this moment, trade war issues are not about to leave the political stage any time soon. In fact
President X's remarks, while conciliatory to tariffs, they were restatements of previous pledges with no new compromises to President Trump.
Oil Markets
Oil prices are towering on the heightened tension in the middle east, and the looming May 12 Iran Nuclear deadline. But the significant counterbalance remains US crude oil production which for the week ending March 30 increased to 10.460 million bpd. Also, The American Petroleum Institute reported a surprise build of 1.758 million barrels which has temporarily taken a bit of wind out of the market sails
However, with all the possible supply disruptors, traders are content to stay long given a likely chance the US will impose sanctions on Iran and will have ” forceful” response to Syria
Gold Markets
Trade war on/trade war off is very much the tale of the tape as Gold prices erased early gains to trade lower on Tuesday after President Xi dialled back trade rhetoric. But with investors positioning for Iran and Syria geopolitical flashpoint to reignite, gold remained and should remain firmly bid on the dip.
Currency Markets
Not sure I have a great deal to add. The revolving door of risk ambulations is exceedingly challenging to anticipate let alone trade.
Japanese Yen
JPY was the worst as USDJPY crept back up to 107.20+ on improved risk sentiment. Nevertheless, still, very much a range trade with traders content to add some small shorts on upticks awaiting the next wave or risk aversion.
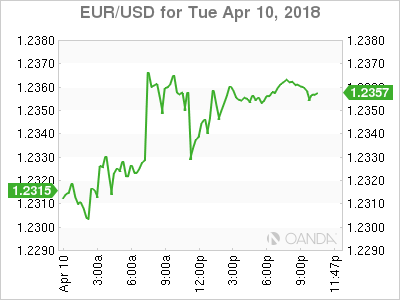
The Euro
The markets were adding to EURUSD longs the back of hawkish comments from the ECB's Nowotny. To be honest, this provided a welcome distraction from all the trade noise!!
The Malaysian Ringgit
$Asia traded lower on the positive regional momentum following CNH gains after President Xi 's speech, which hit all the right buttons for regional growth.
But the Ringgit remains very much stuck in neutral, and not unexpectedly so given the mild political headwinds. Oil prices continue to be incredibly supportive, but investors appear more content to sit this one out until the election passes.
Dollar Weaker As Trade Tensions Ease Ahead Of Inflation Data
The US dollar depreciated against commodity currencies (AUD, CAD, NZD), the EUR and the GBP as China focused on opening its market to more foreign investment easing trade concerns. The euro was further helped by hawkish comments from ECB member Nowotny. The highlights of the Wednesday session on the economic calendar will be the release of US inflation data at 8:30 am EDT and the meeting notes from March’s Federal Open Market Committee (FOMC) where Chair Powell lifted rates by 25 basis points to be released at 2:00 pm EDT.
- Fed to release minutes of March FOMC
- US inflation data expected flat on Wednesday
- Oil rising as Middle East tensions escalate
Nowotny’s Comments Lift Euro
The EUR/USD gained 0.29 percent on Tuesday. The single currency is trading at 1.2356 after comments from European Central Bank (ECB) Governing council member Ewald Nowotny about the end of the QE program. He also proposed rising the deposit rate higher to kickstart the rate hike process. A speech by Chinese President Xi Jinping at an annual economic summit eased trade concerns as Mr Xi focused on providing higher market access. The USD lost some of the support as investors sold the currency with equities one of the main beneficiaries
The greenback did receive good news on Tuesday as the Producer Price Index (PPI) came in higher than expected at 0.3 percent. The higher price of finished goods sold by producers is a leading indicator of consumer inflation. This sets the stage for tomorrow’s release of the monthly CPI data. Headline CPI is expected flat at 0.0 percent, but the more relevant core CPI could rise 0.2 percent. The path of the Fed’s tighter monetary policy could be affected if inflationary pressures continue to be absent.
Loonie Rises as NAFTA Hopes Lifted by Mexican Comments
The USD/CAD lost 0.69 percent in the last 24 hours. The currency pair is trading at 1.2608 as commodity prices and a softer tone on global trade from China put the loonie at a six week high. President Trump cancelled his plans to participate in the Summit of the Americas which could potentially be a setback for an announcement of the progress of the NAFTA talks. The negotiations moved very little until last week when the US softened its approach paving the way for the Mexican to say there is an 80 percent chance of the deal being reached in early May.
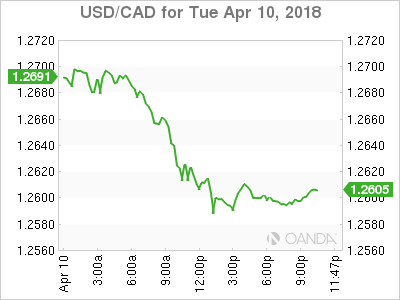
Although the NAFTA announcement was unlikely this week, supportive comments were expected from President Trump. The Canadian currency still gained as risk appetite returned to markets as the anxiety surrounding an escalating trade war between the US and China subsided after Mr Xi’s speech.
Housing starts in Canada surprise to the upside with 225,000 new residential buildings versus the expected 219,000. The second housing indicator released today was not as positive as building permits took a 2.6 percent loss in February. The gain of 5.2 percent in January partly explains the fall the following month. The biggest declines came in or near Toronto.
The week in Canadian indicators will close with the release of the New House Price Index on Thursday. The biggest mover this week was the Bank of Canada (BoC) Business Outlook Survey that showed a resilient optimistic reading despite trade and economic slowdown concerns.
Oil Rises on Middle East Tension and Soft USD
Energy prices headed higher on Tuesday. West Texas Intermediate is trading at 65.57 as geopolitical factors and the US lower forecast on production. The weakness of the USD has also pushed crude prices higher as Middle East tensions took a higher priority after US President Donald Trump cancelled his participation in the Summit of the Americas to work on a response to Syrian chemical weapons attack.
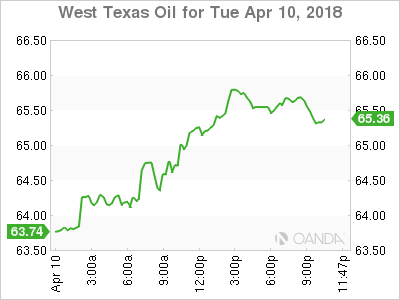
Supply disruptions have been of the biggest factors driving crude prices. The Organization of the Petroleum Exporting Countries (OPEC) and other major producers agreement to limit output has combined with geopolitical events that has set back global supply. US production that was supposed to take advantage of the higher prices has not materialized and if anything today’s US Energy Information Administration (EIA) release of a lower forecast for 2018 has been a boost for crude.
Market Events to Watch this Week
Wednesday, April 11
4:30am GBP Manufacturing Production m/m
8:30am USD CPI m/m
8:30am USD Core CPI m/m
10:30am USD Crude Oil Inventories
2:00pm USD FOMC Meeting Minutes
8:30pm JPY BOJ Gov Kuroda Speaks
Thursday, April 12
3:00pm GBP BOE Gov Carney Speaks
Eco Data 4/11/18
[php_everywhere instance="1"]
US Inflation Data & Fed Minutes in the Limelight
Wednesday promises to be an eventful day for the dollar, with US CPI data for March and the minutes from the latest FOMC meeting likely to trigger renewed volatility in the world’s reserve currency. While a potential acceleration in inflation and a confident tone in the minutes could help the greenback recover a little, numerous trade and political uncertainties persist. Until they dissipate, any rallies in the currency could remain relatively limited.
Monetary policy has moved out of the spotlight in recent weeks, taking a back seat to global trade concerns, which have dominated price action in markets. With anxieties on the trade front subsiding somewhat though, for now at least, attention could gradually shift back to economic releases. In this respect, the US CPI data and the FOMC minutes from the March policy meeting that will be released on Wednesday at 1230 and 1800 GMT respectively are likely to set the tone for the greenback.
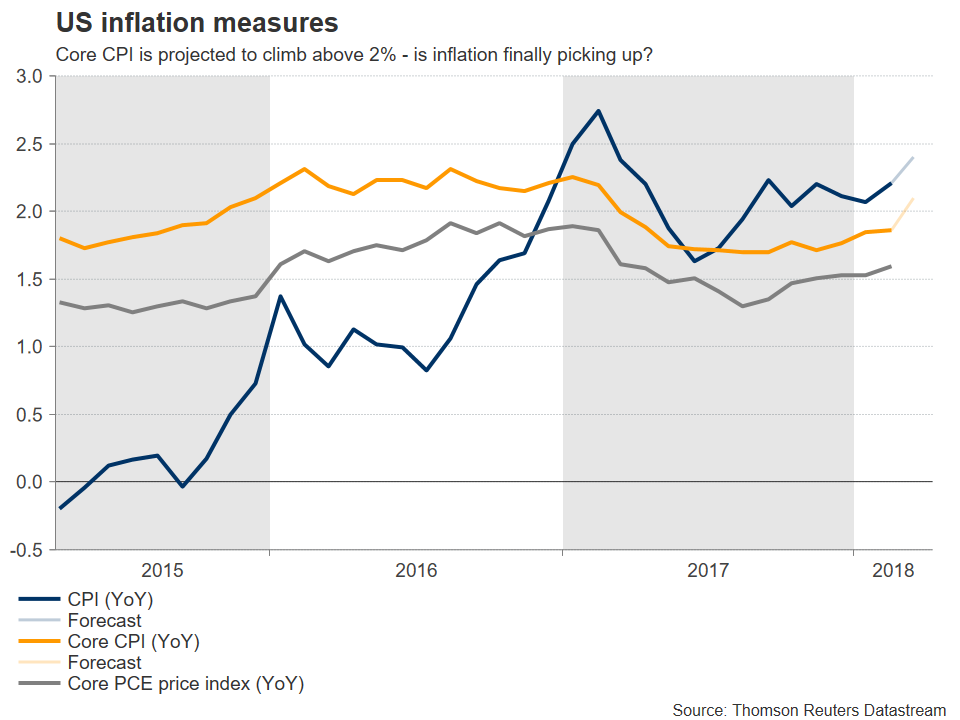
Kicking off with inflation, in March, the US CPI rate is forecast to have risen to 2.4% year-on-year, from 2.2% previously. The core rate – which excludes volatile items – is projected to have climbed to 2.1%, from 1.8% in February. These optimistic forecasts are supported by the Markit manufacturing and services PMIs for March, both of which showed a strong increase in prices charged by US firms. If the actual CPI figures meet these forecasts, then the narrative that US inflation is finally picking up steam would gain traction, amplifying expectations for a more aggressive tightening pace by the Fed.
 Speaking of the Fed, the minutes from the March FOMC gathering – where the Committee raised interest rates by 25bps – will be closely watched for any fresh policy hints. Prior to that meeting, there was speculation policymakers could raise their rate projections to signal a total of four rate hikes in 2018, from three previously. However, officials disappointed those looking for such changes, keeping the so-called “dot plot” for 2018 unchanged at three hikes, triggering a drop in the dollar.
That said, there were hawkish signals too, which markets mostly overlooked back then. First and foremost, the decision to keep the 2018 dots unchanged was a very close call. If just one more policymaker had raised her/his own projection to four hikes, the median dot for 2018 would have shifted higher as had been anticipated by some. Moreover, the rate projections for 2019 were revised up, which is another sign the Committee is becoming more confident in general. If the minutes reflect a sense of optimism, the dollar could gain as speculation for four hikes this year resurfaces.
Of course, there are also risks for the dollar. For instance, if the minutes reveal concerns about trade tensions and their potential impact, that could overshadow other positive signals on hikes. However, such worries are unlikely to be reflected in these minutes, given Chair Powell’s comments after the meeting that a discussion on trade had taken place, but the Committee’s outlook had not changed due to these risks. Not to mention that the gathering took place before trade tensions truly escalated, back when only the US tariffs on steel and aluminum were public.
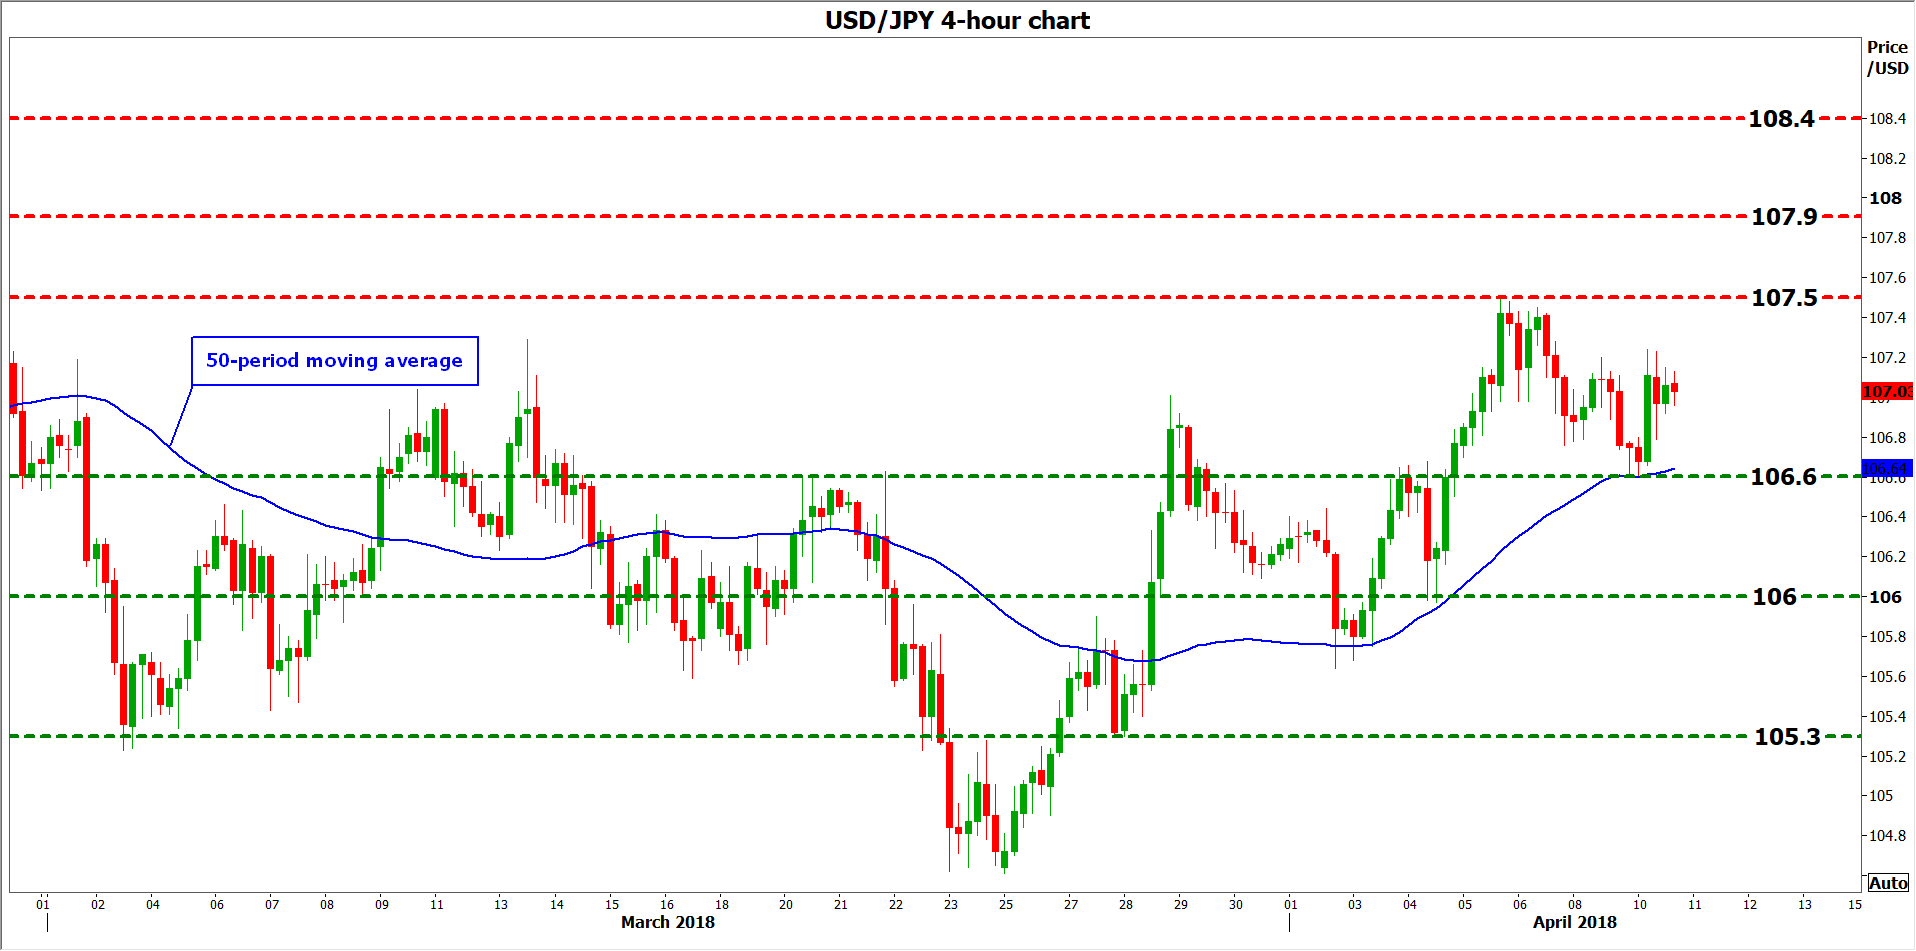 As for what is priced in already, investors have fully discounted another 25bps rate hike by year-end, and they also see an 80% probability for a second one, according to the Fed funds futures. An upside surprise in the CPI data or an upbeat tone in the minutes, could cement expectations for another two hikes this year and hence, push the dollar higher. Dollar/yen could edge up and challenge the 107.50 zone, defined by the April 5 highs. Further advances may encounter resistance initially around the peaks of February 21, at 107.90, and subsequently at 108.40, the lows of February 6.
On the flipside, a disappointment in the CPIs, or a downbeat account of the FOMC meeting that focuses on trade risks for instance, could bring the greenback under renewed selling interest. In this case, dollar/yen could drop back down for a test of the 106.60 territory, identified by the April 10 lows. Steeper declines would likely bring the round figure of 106.00 into play, and further down, attention would shift to the 105.30 barrier, marked by the February 27 trough.
In the bigger picture, it’s important to note that even if the dollar spikes higher on these releases, numerous uncertainties persist. On trade, although US-China tensions subsided lately, we are not “out of the woods” yet. In politics, the Mueller investigation is heating up, while in geopolitics, the US is contemplating military action against Syria, risking fresh tensions with Russia. Until these risks ease, and most notably the trade risk, any rallies in the dollar could remain relatively limited.
Pound Hits 2-Week High, Key Manufacturing Report Next
The British pound has recorded gains for a third straight session. In Tuesday trade, GBP/USD is trading at 1.4160, up 0.26% on the day. On the release front, the sole British event was a speech from BoE Chief Economist Ande Haldane. In the US, inflation indicators beat the estimates. PPI edged up to 0.3%, beating the estimate of 0.1%. Core PPI also improved to 0.3%, edging above the estimate of 0.1%. On Wednesday, the UK releases Manufacturing Production and the US publishes consumer inflation reports.
Investor risk appetite is up after Chinese President Xi Jimping sent out a conciliatory message earlier on Tuesday. Xi was speaking at a development conference in China, and promised to lower tariffs on vehicle imports into China. This has been a major sticking point between the US and China, with President Trump complaining that China has a 25% tariff on US vehicle imports, yet the US only charges 2.5% on Chinese vehicles. Although China has previously declared that it would reduce the tariffs on vehicles, the markets were looking for some positive news, as the trade battle between the two largest economies in the world has shaken the markets in recent weeks. Xi added that China was looking to solve issues through dialogue rather than confrontation, and the markets are hoping that the US and China can avert a trade war, which could drag down the global economy.
What can we expect from the Bank of England? The bank does not meet for a rate meeting until next month, but there is support for a quarter-point rate increase. On Tuesday, BoE member Ian McCafferty urged the bank not to delay in raising rates, and other policymakers support this view. One strong reason in favor of a rate hike is that inflation remains around 3%, well above the 2% target. However, the lukewarm British economy and the dark cloud of Brexit are key reasons why Governor Mark Carney has not been enthusiastic about raising rates. As things currently stand, a quarter-point rate hike seems likely at the May meeting.
UK Trade and Production Data Eyed as Pound Approaches $1.42
The pound was one of the best performing currencies against the US dollar in the first three months of 2018. But as the British currency basks in the growing optimism about the prospect of a favourable post-Brexit trade deal with the European Union, the renewed strength may not be good news for UK exporters, with early indications pointing to slowing manufacturing growth in the first quarter. The Office for National Statistics will publish its latest figures on industrial and manufacturing production on Wednesday, along with monthly trade numbers.
Industrial output is forecast to rise by 0.4% month-on-month in February, down from 1.3% in the prior period. On an annual basis, growth of total production industries is expected to accelerate to 2.9% from 1.6% in January. Looking at the biggest component of industrial production, manufacturing output is expected to expand by 0.2% m/m in February. The 12-month rate is forecast to pick up to 3.3%.
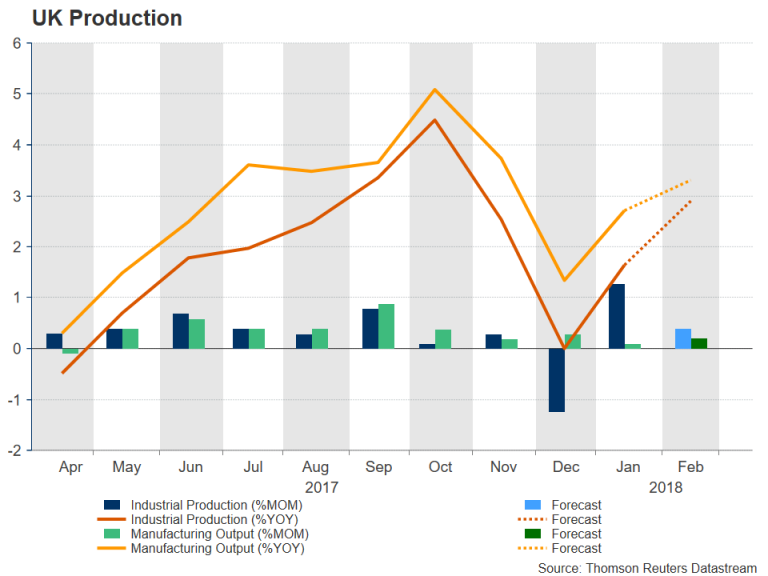 The manufacturing sector is on track to record its 10th straight month of growth in February and is enjoying its longest period of expansion since the late 1960s. However, month-on-month growth has been averaging just 0.2% since November and is lagging its European peers. While uncertainty relating to Brexit remains a significant weight on the sector, its performance is nonetheless unimpressive given the sharp depreciation of the pound after the Brexit referendum and the strong upturn in global growth during 2017.
The absence of a stronger recovery in manufacturing and export growth raises concerns about the sustainability of Britain’s massive trade deficit, which has been steadily deteriorating since the late 1990s. (The UK current account deficit hit a record 5.8% of GDP in 2016). Trade figures due on Wednesday are expected to show only a small reduction in the trade deficit in February, from £12.33 billion for £11.95 billion.
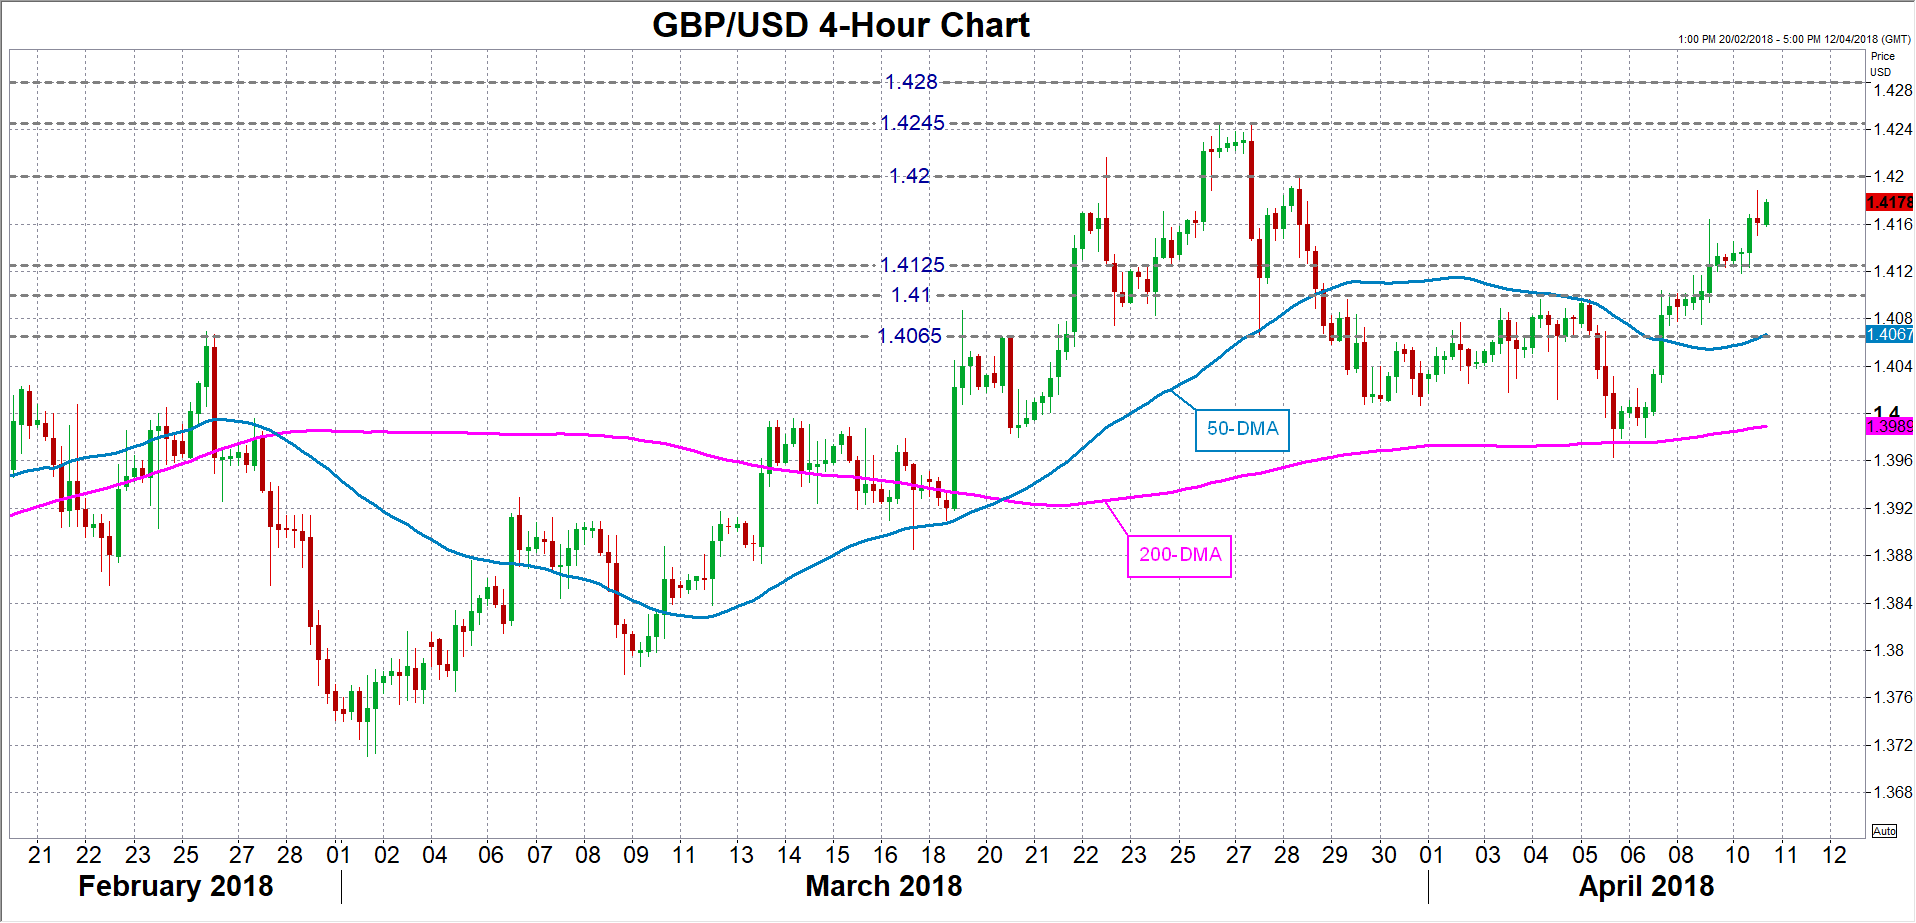
With market odds of a rate hike by the Bank of England in May running over 80%, it would require a significant miss in the data for traders to sharply sell off the pound, especially as technical indicators suggest the pound/dollar rally of the past three trading sessions is not yet looking particularly overstretched. However, in the event of a negative surprise in the data, cable could dip towards $1.4125, while bigger losses would see a test of $1.41 level before the 50-day moving average would come into view around $1.4065.
But should the data beat expectations, the pound may gain further upside momentum and eye the $1.42 handle. A break above this level could could see sterling struggle to overcome resistance at $1.4245 and $1.4280.
Yen Dips as Xi Calms Trade War Concerns
USD/JPY has posted gains in the Tuesday session, erasing the losses seen on Monday. In the North American session, USD/JPY is trading at 107.16, up 0.37% on the day. On the release front, Japanese Preliminary Machine Tool Orders gained 28%, its weakest gain in eight months. Later in the day, Japanese releases Core Machinery Orders and PPI. In the US, inflation indicators beat the estimates. PPI edged up to 0.3%, beating the estimate of 0.1%. Core PPI also improved to 0.3%, edging above the estimate of 0.1%.
Investor risk appetite is up, but the safe-haven yen is lower after Chinese President Xi Jimping sent out a conciliatory message earlier on Tuesday. Xi was speaking at a development conference in China, and promised to lower tariffs on vehicle imports into China. This has been a major sticking point between the US and China, with President Trump complaining that China has a 25% tariff on US vehicle imports, yet the US only charges 2.5% on Chinese vehicles. Although China has previously declared that it would reduce the tariffs on vehicles, the markets were looking for some positive news, as the trade battle between the two largest economies in the world has shaken the markets in recent weeks. Xi added that China was looking to solve issues through dialogue rather than confrontation, and the markets are hoping that the US and China can avert a trade war, which could drag down the global economy.
US nonfarm payrolls, one of the most critical economic reports, was a major disappointment on Friday. The economy added just 103 thousand jobs, well off the forecast of 188 thousand. Still, the markets do not appear overly concerned, as payroll reports often sag in March. On a more positive note, wage growth improved to 0.3%, up from 0.1% a month earlier. This release matched the estimate. The improvement is likely to reinforce sentiment that the Fed could press the rate trigger four times in 2018, which could push the US dollar higher.
CADJPY, AUDJPY, NZDJPY, which is our preferred choice to go long?
AUD/JPY, NZD/JPY and, CAD/JPY are the clear winners for the day on easing risk aversion. These three pairs are in the top 10 movers across time frames. But which one pair is the better one to go long?
 Let's take a look at respective Action Bias.
A quick glance at AUD/CAD. The cross is clearly in persistent downside D action bias table. And there is no sign of a turn in both 6H and H action bias. This is consistent with smooth decline as seen in the D action bias chart.
 The action bias table of AUD/NZD looks even worse with downside biases seen all over the place across 6H, D and W time frame. H neutral action bias suggests the decline might be slowing temporarily. But there is no sign of a reversal. This could also be reflected in the D action bias chart too, that the cross is in a clear down trend.
 So, while AUD/JPY is the top mover for today, it seems that NZD/JPY and CAD/JPY will have a better advantage.
How about NZD/CAD? The action bias table shows it's having persistent blue bars in W time frame and persistent red bars in D time frame. But red bars of downside bias are not apparent in 6H and H time frames. Looking at the D chart, NZD/CAD has been in a solid up trend since December, but turned into correction/consolidation since mid March.
 So, for quick intraday trade, there is not much difference between NZD/JPY and CAD/JPY. But for position trading, NZD/JPY is slightly preferred as our choice to go long.
The NZD/JPY action bias table showed persistence upside bias blue bars in H and 6H time frame. This also pushes D action bias to upside side blue too. Taking into consideration that 78.61 resistance is taken out decisively today to confirm near term reversal. NZD/JPY presents long opportunity for 81.55 resistance in near term.