Sample Category Title
CADJPY Edges Higher after Touching 16-Month Low of 80.55
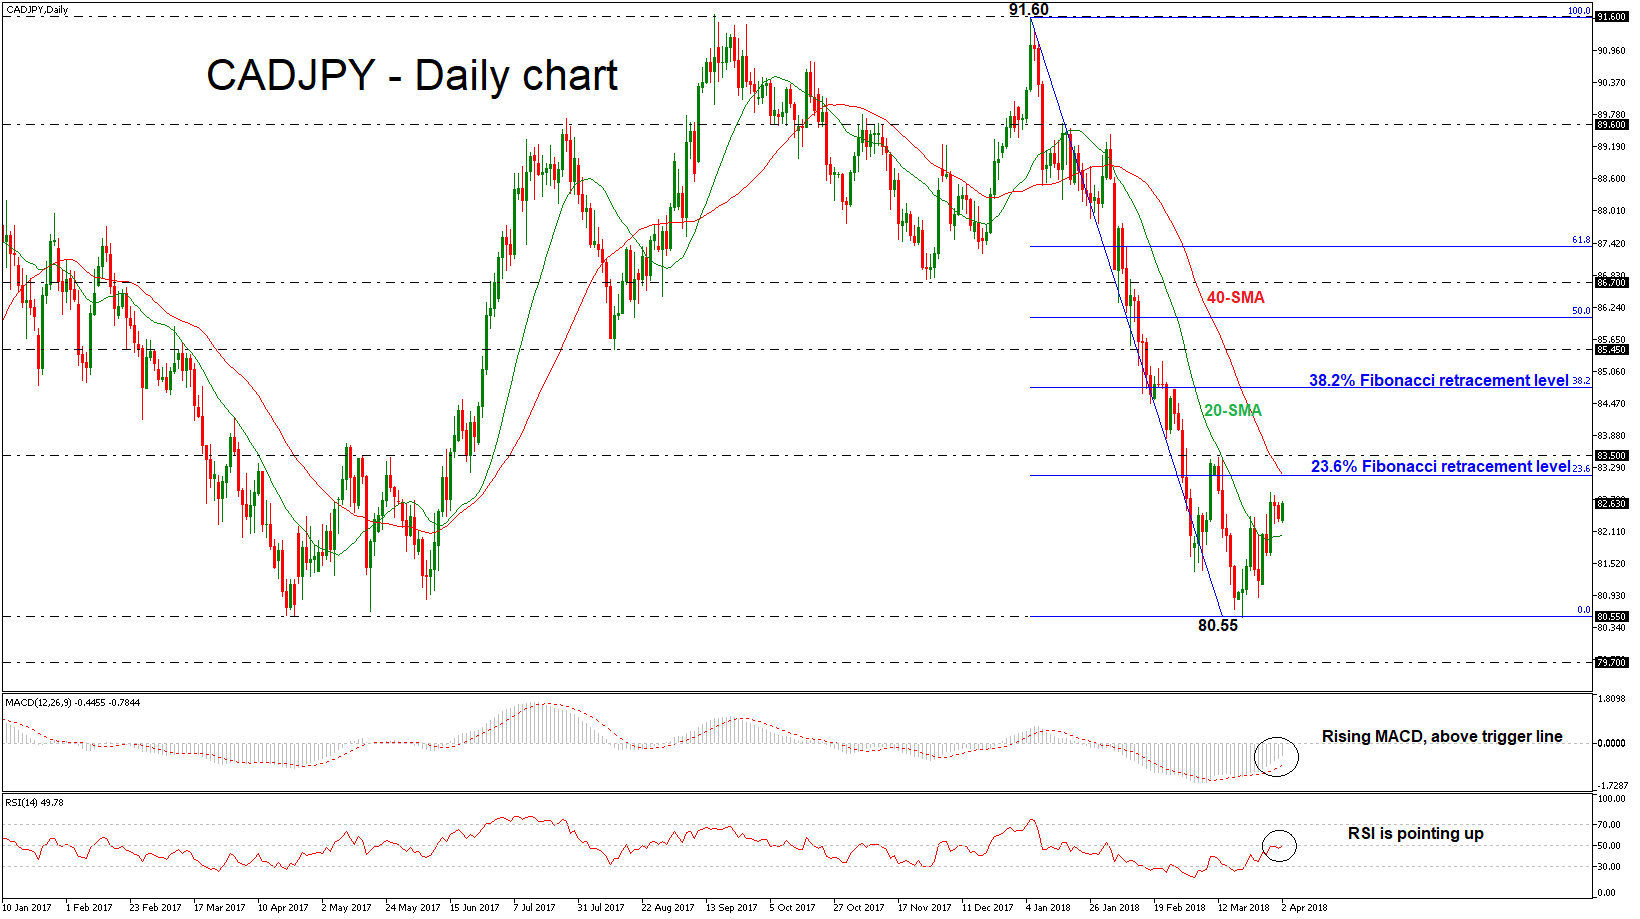
CADJPY has been in bullish correction mode following the bounce off the 80.55 support level. The pair posted two consecutive weekly green sessions after it recorded a 16-month low. The short-term technical indicators are endorsing the upward retracement in the price action.
Technically, in the daily chart, the MACD oscillator continues to move higher towards its zero line and also stands above its trigger line, while the RSI indicator is holding near the 50 level, suggesting that the slightly positive movement continues.
In case of a continuation of the bullish retracement, the price could touch the 40-day simple moving average (SMA), near 83.13, which overlaps with the 23.6% Fibonacci retracement level of the downleg from 91.60 to 80.55. A jump above this region could drive the pair towards the 83.50 resistance level. Moreover, if buyers manage to push above that barrier, the pair could hit the 38.2% Fibonacci mark of 84.75.
Further losses should see the April 2017 low of 80.55 acting as a major support. A drop below this zone could reinforce the bearish structure in the short-term and open the way towards the next key level of 0.7970, taken from the high in October 2016.
RBA Set to Remain on Hold as Trade Uncertainties Loom
The Reserve Bank of Australia (RBA) will announce its rate decision on Tuesday, at 0430 GMT. With the Bank widely anticipated to take no action, the focus will probably turn to the statement accompanying the decision for fresh policy signals. Considering recent developments around global trade, the RBA has every reason to err on the side of caution, potentially reaffirming that any rate hike in Australia is still a long way off.
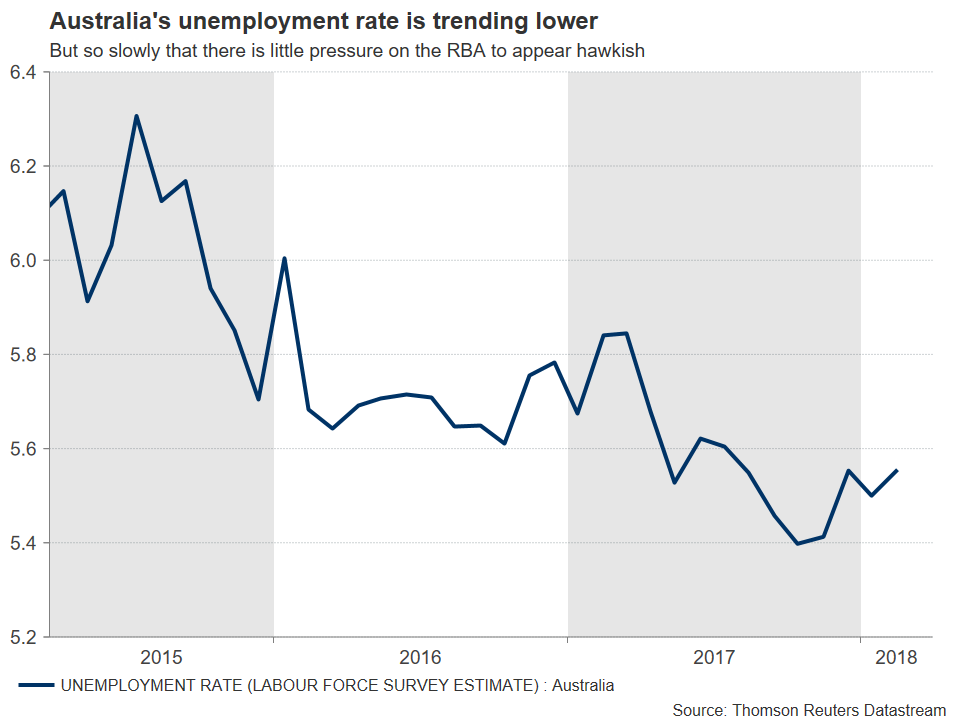
Not a lot has happened domestically in Australia since the Reserve Bank last met in early March. In terms of economic data, GDP for Q4 disappointed, but the nation’s trade balance returned to a surplus in January. Meanwhile, the unemployment rate ticked up in February, but that was probably owed to more people entering the labor market, as the labor force participation rose too. Thus, economic data alone suggest there is little need for the RBA to change its neutral tone upon completion of its meeting.
 However, global developments have not been as benign. Following the latest announcement by China to impose retaliatory tariffs on the US, the risk of increased protectionism on a global scale has increased drastically. If such risks were to materialize, Australia would be among the most vulnerable economies, considering its reliance on commodity exports.
Taking a look at the minutes from the latest RBA gathering, one can hardly find any mentions to global trade risks. There was only a single sentence that said policymakers “observed that the risks to the global economy, and therefore the outlook for Australia, would rise if other countries also increased trade protection”. While that may not seem like much at first glance, what is important here is that officials did discuss the possibility of a trade war at that meeting – and that prospect has only become more realistic since then. Moreover, Australia’s large trade exposure to China represents an extra reason for policymakers to be wary of an escalation in tensions; if China takes an economic hit, so does Australia.
Overall, there appear to be more reasons for the RBA to err on the side of caution, as opposed to appearing optimistic. Policymakers could highlight the recent trade uncertainties and indirectly reaffirm that rates are likely to remain on hold for the foreseeable future; a view that markets share. Australia’s overnight index swaps now suggest a mere 23% probability for a 25bps rate hike by year-end, down from 60% back in early January.
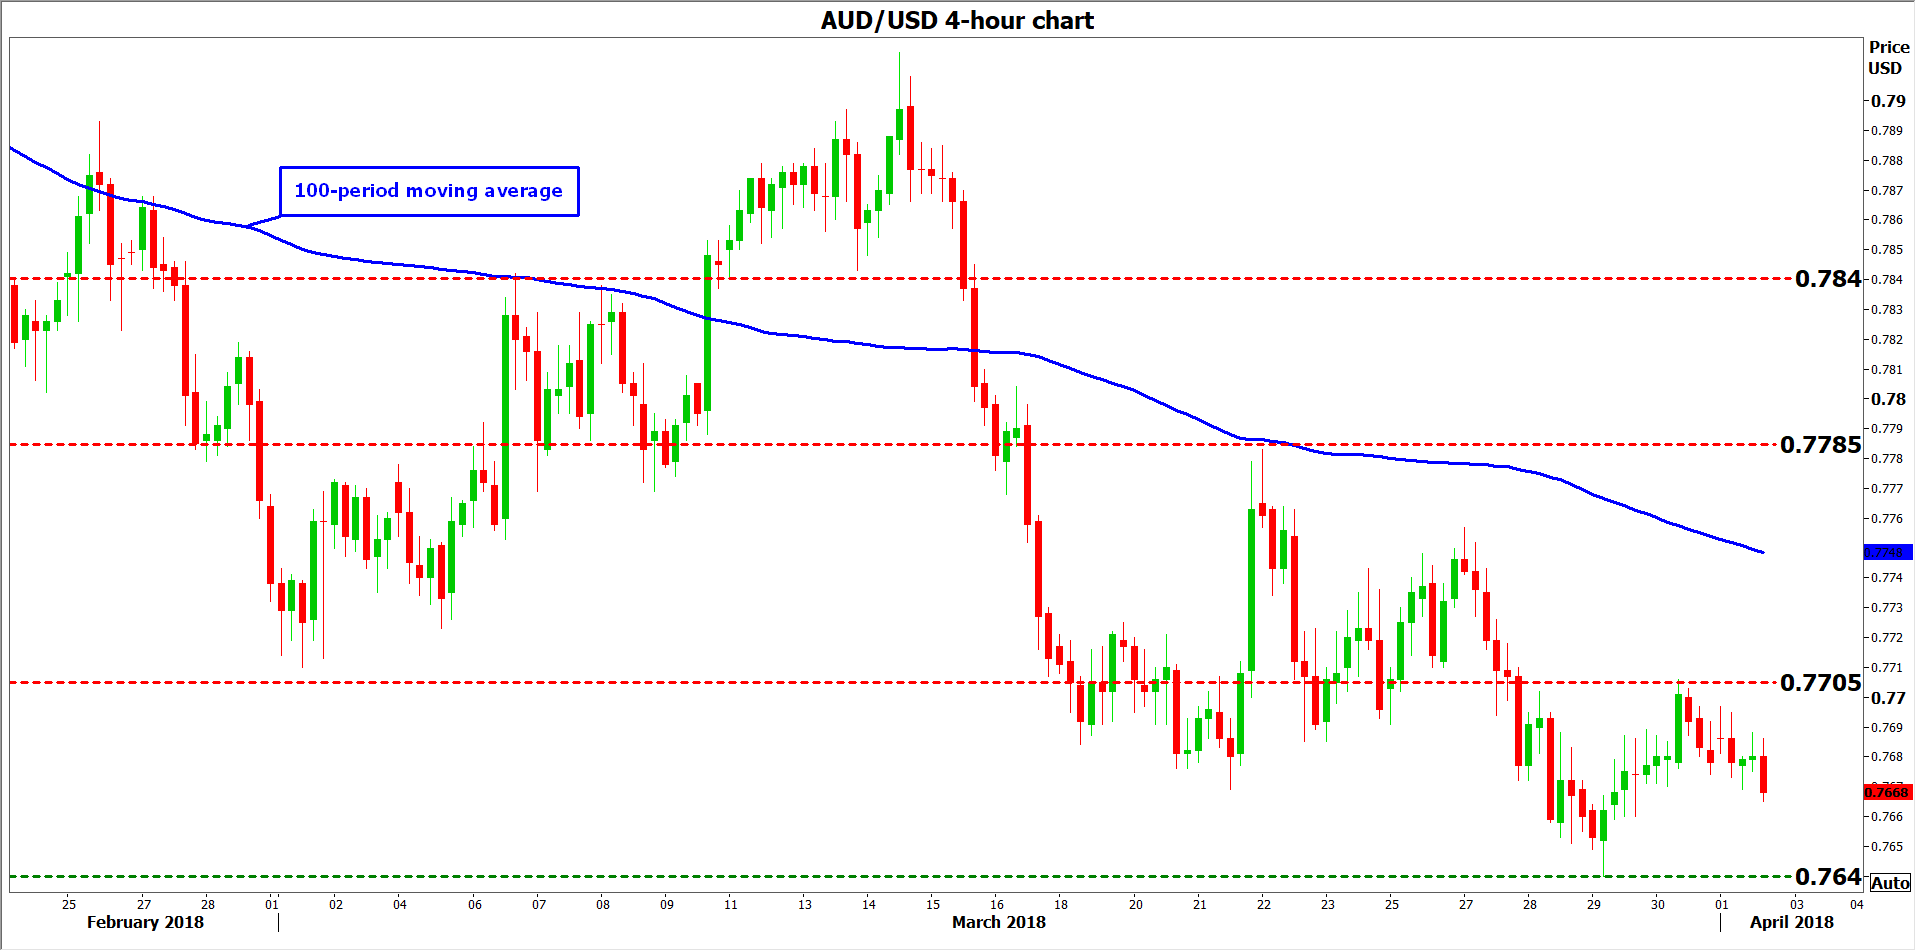
Should policymakers for example indicate that further trade protection poses a downside risk to Australia’s terms of trade, then the probability for a rate hike this year could decline further and the Aussie could come under renewed selling pressure. In this case, aussie/dollar could head lower for a test of the 0.7640 zone, marked by the March 29 lows, with a downside violation of that hurdle likely to bring the 0.7550 area into play, identified by the troughs of November 29.
If on the other hand the overall policy message from the RBA is seen as one that increases the likelihood for a rate hike this year, that may lead to a sharp positive reaction in aussie/dollar, as it would likely come as a surprise. The pair could break above its latest highs at 0.7705, and aim for a test of the 0.7785 territory, defined by the March 22 tops. If buyers manage to overcome that hurdle too, resistance may be found near 0.7840, marked by March 6 highs.
SPOT GOLD – Doji Reversal Pattern is Forming on Daily Chart
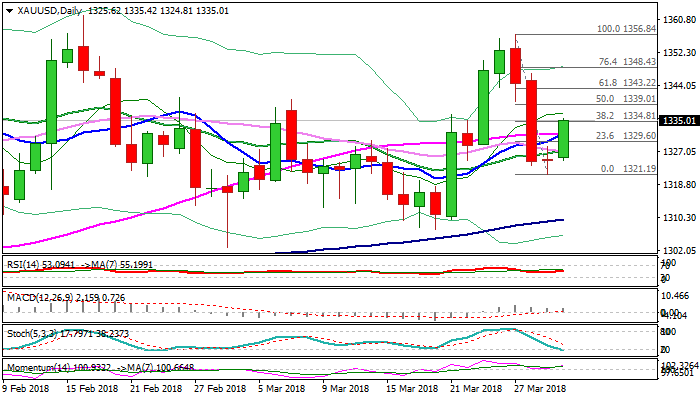
Recovery picks up pace on Monday and cracked pivotal barrier at $1338 (Fibo 38.2% of $1356/$1321 bear-leg).
Fresh bullish acceleration completes Doji reversal pattern on daily chart which signals further recovery.
Softer dollar underpins yellow metal on Monday, with fresh bullish signal generating on lift above a cluster of MA’s (between $1326/31) and 14-d momentum climbed in the positive territory. Recovery rally cracked Fibo barrier at $1334 and pressures next pivot at $1338 (daily cloud top).
Close above these barriers is needed to confirm reversal and open way for further retracement of $1356/$1321 bear-leg.
Plethora of MA’s at $1331/27 zone now reverted to supports and should keep the downside protected.
Res: 1335; 1338; 1343; 1348
Sup: 1331; 1326; 1325; 1321
Traders Were Bullish on Petroleum but Turned Bearish on Natural Gas
CFTC Commitments of Traders
With the exception of natural gas, speculators were bullish over the energy complex in the week ended March 27. Net LENGTH for crude oil futures jumped +12 062 contracts from a week ago to 715 7708. NET LENGTH of heating oil gained +1 948 contracts to 14 987 while net LENGTH for gasoline rose 1 689 contracts to 79 902. Net SHORT for natural gas added +5 256 contracts to 94 161 for the week.
With the exception of gold, speculators were bearish over the precious metal complex last week. Net LENGTH for gold increased +54 623 contracts to 203 354. Net SHORT for silver added +1 141 contracts to 13 657 for the week. For PGMs, net LENGTH for platinum slipped -1 032 contracts to 28 039 while that for palladium slipped -294 contracts to 12 047.
Hong Kong Dollar Weakest in Three Decades Due to Ample Liquidity
USDHKD has continued flirting slightly below 7.85, the weak end of its trading band. Since late-February, the market has been speculating about what and when the Hong Kong Monetary authority HKMA, the de facto central bank of Hong Kong, would do to maintain the peg. We judge that the relative Hong Kong dollar weakness of late is driven by yield differential. If the weak end (7.85) of the peg is reached, the HKMA is obliged to intervene by buying Hong Kong dollar (HKD) in order to maintain the currency peg with the US dollar (USD). The intervention would drain interbank liquidity and cause HIBOR to increase. We do not expect the pace of interest rate increase would imitate that of the previous Fed’s rate hike cycle in 2004-2006.
The Linked Exchange Rate System in Hong Kong
In order to restore market confidence of its currency amidst negotiation of sovereignty handover, the Hong Kong government announced in October 1983 to peg HKD to USD at a rate of 7.8. After several rounds of fine-tuning, the HKMA introduced in 2005 a strong-side Convertibility Undertaking to buy USD from licensed banks at HK$7.75 to one USD, as well as a weak-side Convertibility Undertaking to sell USD at HK$7.85 to one USD. This allows the currency pair to achieve symmetry around the Linked Rate of HK$7.80. Within the Convertibility Zone (7.75-7.85), the HKMA may choose to conduct market operations consistent with predefined principles with the aim of promoting the smooth functioning of the money and foreign exchange markets.
By pegging its currency with USD, the Hong Kong government has surrendered its autonomy in monetary policy, which has been dependent on that of the US since then. The chart below shows that the HKMA has been adjusting its policy rate (the base rate) in similar pace as the Fed’s rate moves.
Cause of Recent HKD Weakness
The key reason of the relatively weakness of HKD against USD is the ample interbank liquidity in the city. Thanks to massive capital inflow resulting from the ultra accommodative monetary policy across the global, the interbank liquidity in Hong Kong has soared to HK$ 426B in 2015, almost 400 times the pre-crisis amount. Exceptionally low interbank interest rate in Hong Kong (HIBOR) has widened the yield differential between HIBOR and LIBOR since last year, causing capital to flow out of Hong Kong. HKD has recently become a popular carry trade currency due to its low borrowing cost.
While capital outflow has resulted in HKD’s relative weakness, it is far from hurting interbank liquidity in Hong Kong. HKMA’s issuances of Exchange Fund Notes/Bill in the second quarter of 2017 have absorbed HK$80B from the interbank, the liquidity level is still maintained at an abundant level of about HK$180B since November 2017, limiting the increase in HIBOR and prolonging the wide HIBOR-LIBOR spread.
Since the HIBOR-LIBOR spread has stayed in the widest level since 2017, we do not feel surprise if capital outflow continues. Yet, the pace of capital outflow is unlikely to reduce the interbank liquidity to the extent that HIBOR has to rise much more rapidly. The result is prolonged weakness in HKD.
The HKMA has been committed to defending the linked system more over three decades, it would definitely keep the promise and intervene should the weak side of the currency pair (7.85) is reached. Actions to support HKD would drain liquidity and speed up HIBOR’s rise. However, the pace would be far from being similar to the period of 2004-2006, during which the Fed had hiked the policy rate by 425 bps. The Fed has to double the pace of rate hike now if it wants to repeat the policy cycle back then.
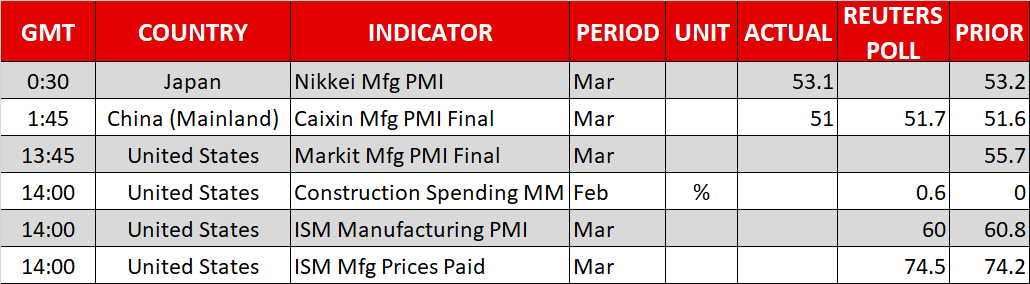
ISM manufacturing to bring some life into dull trading
After half day of dull trading, GBP is the strongest one so far, followed by CAD. JPY, USD and CHF are like brothers again trading as the weakest ones together.
But it should be noted that activity is very low due to holidays. The top moving one GBPNZD is just up 77 pips. GBP/JPY as the second top mover is up 52 pips only.
Volatility will likely come back in US session. The main focus will be on ISM manufacturing whish is expected to drop slightly from 60.8 to 60.0 in March. Price paid index is expected to dropped from 74.2 to 72.5. And of course, as prelude to Friday's NFP, ISM manufacturing employment will also be watched.
In addition to that, US will release PMI manufacturing final and manufacturing. Canada will also release PMI manufacturing. Minneapolis Federal Reserve Bank President Neel Kashkari will also speak.
Dollar Inches Down As Trade Woes Linger, US Data & RBA Decision Eyed
Here are the latest developments in global markets:
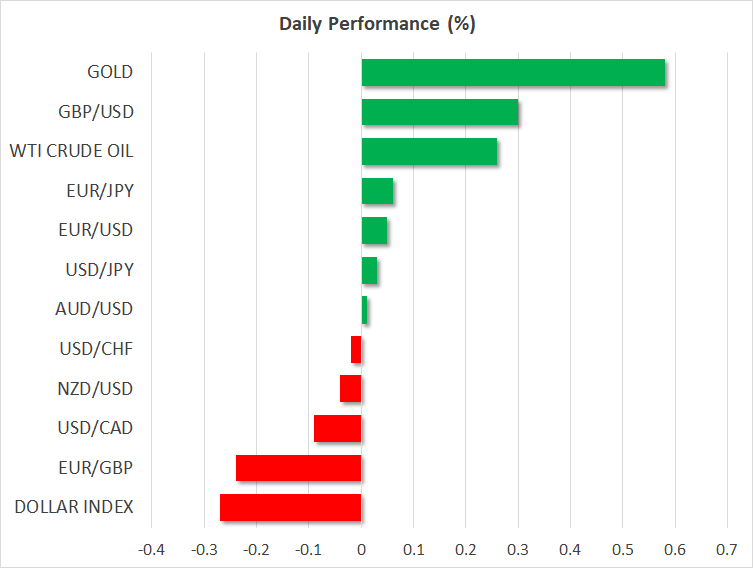
FOREX: The US dollar held steady versus the Japanese yen today (+0.04%), taking a breather after last week’s rally. The US dollar index fell by 0.28% though, currently hovering just below the 90.00 handle. Traders are awaiting the US labor market data on Friday, which are expected to show a drop in the unemployment rate to its lowest level since 2000. Moreover, investors will keep their focus on any news regarding trade and protectionism, following the recently-announced tariffs by China against the US. Euro/dollar was trading marginally higher by 0.05% during today’s European session, while pound/dollar advanced by 0.31%, surpassing 1.4050. Antipodean currencies were mixed, with aussie/dollar up at 0.7681 (+0.04%), but kiwi/dollar down at 0.7232 (-0.03%). Dollar/loonie was last seen at 1.2875 (-0.12%).
STOCKS: In Europe, all of the major benchmarks remained closed today in celebration of the Easter Monday holiday. In the US though, trading will resume today as per normal. Futures tracking the major US benchmarks are currently flashing red, pointing to a lower open, possibly due to the news that China will introduce tariffs on the US effective today. In Asia, Japan’s Nikkei 225 and the Topix closed 0.3% and 0.44% lower, both indices unable to sustain early gains.
COMMODITIES: In energy markets, West Texas Intermediate (WTI) crude oil and London-based Brent crude edged higher today. WTI was up by 0.28%, slightly above $62 per barrel, while Brent jumped by 0.52% at $69.70 per barrel. In precious metals, copper surged by 0.93% and gold prices rose by 0.58%.
Day ahead: US data and RBA decision on the agenda as markets await trade updates
With most European markets still closed, attention will likely remain on any potential updates in the “trade war” narrative. Besides any trade news, there are some US economic data and a speech by an FOMC policymaker on the agenda for today. A few hours afterwards, during the Asian session on Tuesday, all eyes will turn to the Reserve Bank of Australia’s (RBA) policy decision.
On the subject of trade, investors will likely remain vigilant for any comments from the US administration regarding the recently-announced tariffs by China. Any hints of countermeasures would likely amplify concerns that the situation could escalate further and thereby, curb risk appetite.
In terms of economic data, the most noteworthy release will be the US ISM manufacturing PMI for March, at 1400 GMT. The index is expected to have declined to 60.0, after reaching a 14-year high of 60.8 in February, signaling that the manufacturing sector may have lost some speed but still remains on a very healthy track. The final Markit manufacturing PMI for March is also due out at 1345 GMT, though investors tend to pay more attention to the ISM print.
In Canada, the Markit manufacturing PMI for March is due out as well, at 1330 GMT.
At 2200 GMT, Minneapolis Fed President Neel Kashkari (non-voter) will deliver remarks. Although Kashkari has traditionally been on the dovish end of the spectrum and has voted against previous rate hikes, he recently said he supported the latest hike in March. If he reiterates a neutral view, that would be another indication that even the most cautious FOMC policymakers are becoming more confident in the economy’s outlook.
Looking further ahead, the RBA will announce its rate decision on Tuesday at 0430 GMT. The Bank is widely anticipated to stand pat, so attention will likely turn to the statement accompanying the decision for fresh policy signals. Recent Australian data and developments have been mixed, so policymakers are unlikely to change their neutral tone based on that. Having said that, it would be interesting to see if officials make any mention of the recent trade uncertainties, and whether those are posing downside risks to Australia’s economy. If so, the Aussie could come under renewed selling interest.
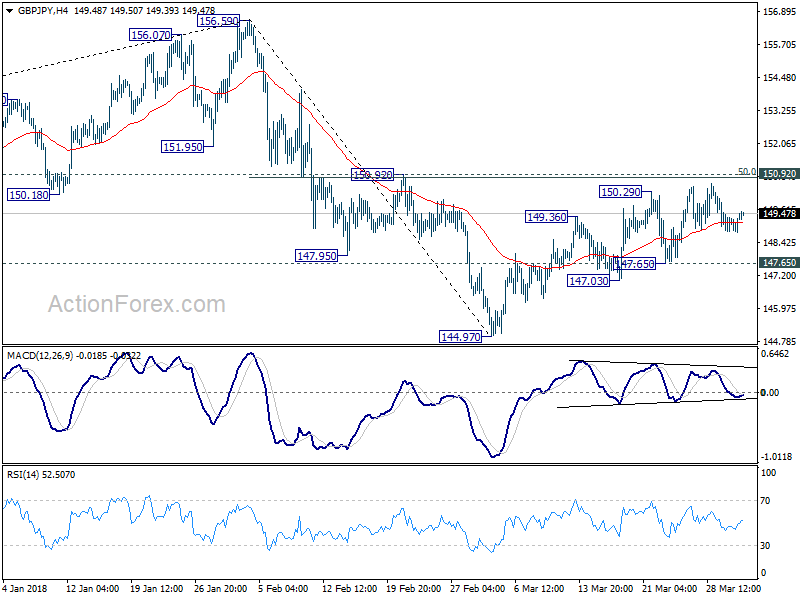
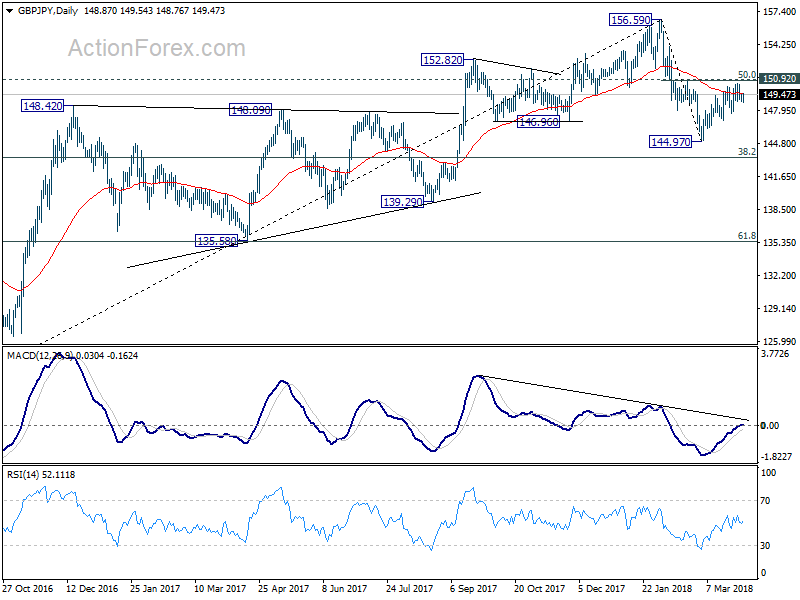
GBP/JPY Daily Outlook
Daily Pivots: (S1) 148.71; (P) 149.06; (R1) 149.32; More...
GBP/JPY's corrective rise from 144.97 might still extend. But we'd expect strong resistance from limit upside and bring fall resumption. On the downside, below 147.65 minor support will bring retest of 144.97 low first. However, sustained break of 150.92 will indicate near term reversal and pave the way back to retest 156.69 high.
In the bigger picture, the case for medium term reversal continues to build up. There is bearish divergence condition in daily MACD. 146.96 support was taken out. And GBP/JPY was rejected by 55 month EMA. Break of 38.2% retracement of 122.36 to 156.59 at 143.51 will pave the way to 61.8% retracement at 135.43 and below. This will now be the preferred case as long as 150.92 resistance holds.
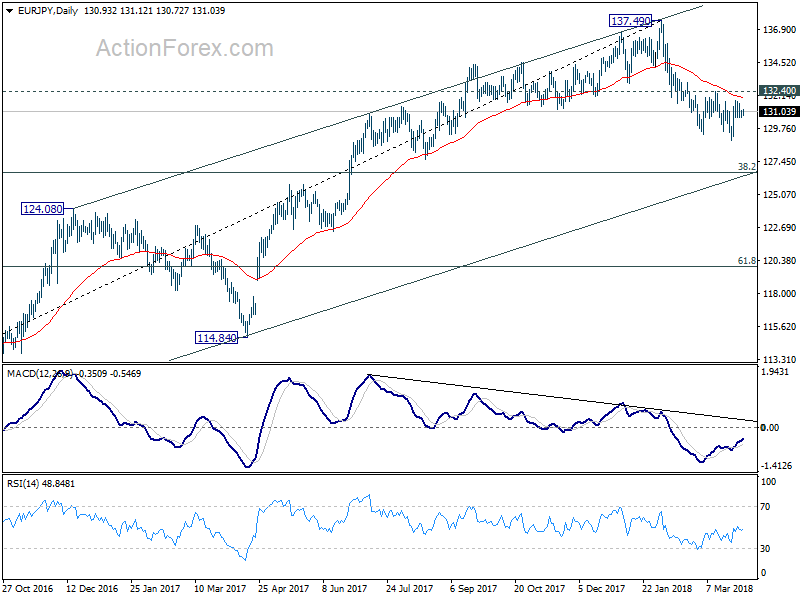
EUR/JPY Daily Outlook
Daily Pivots: (S1) 130.65; (P) 130.84; (R1) 131.12; More....
Intraday bias in EUR/JPY remain neutral as this point. Near term outlook stays bearish with 132.40 resistance intact. And deeper decline is expected. On the downside, break of 128.94 will extend the whole fall from 137.49 to 126.61 medium term fibonacci level next. Nonetheless, break of 132.40 should confirm short term bottoming and turn bias back to the upside for stronger rebound.
In the bigger picture, current development argues that rise from 109.03 (2016 low) has completed at 137.49, on bearish divergence condition in weekly MACD. Deeper fall should be seen to 38.2% retracement of 109.03 to 137.49 at 126.61 first. Sustained break there would pave the way to 61.8% retracement at 119.90. On the upside, break of 132.40 resistance will indicate that the pull back is completed and bring retest of 137.49. But still, break of 137.49 is needed to confirm medium term rise resumption. Otherwise, outlook is neutral at best for consolidations. 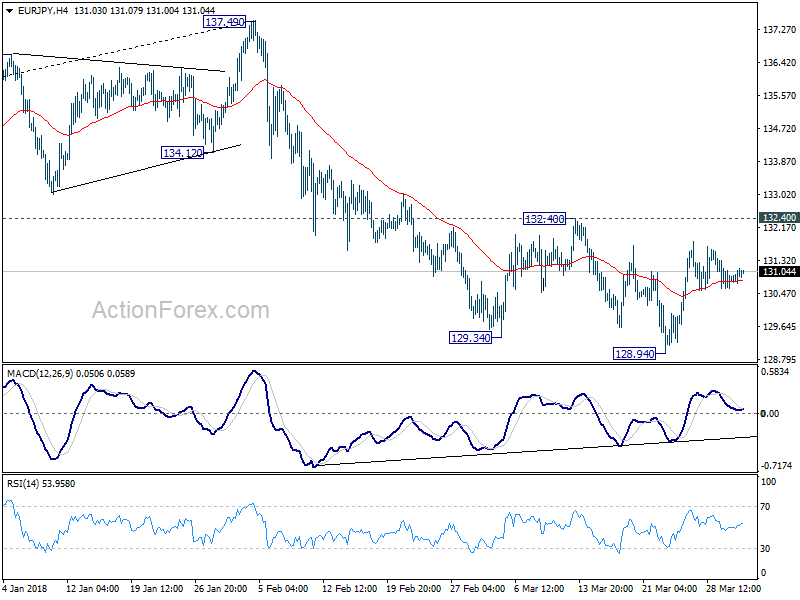
EUR/GBP Daily Outlook
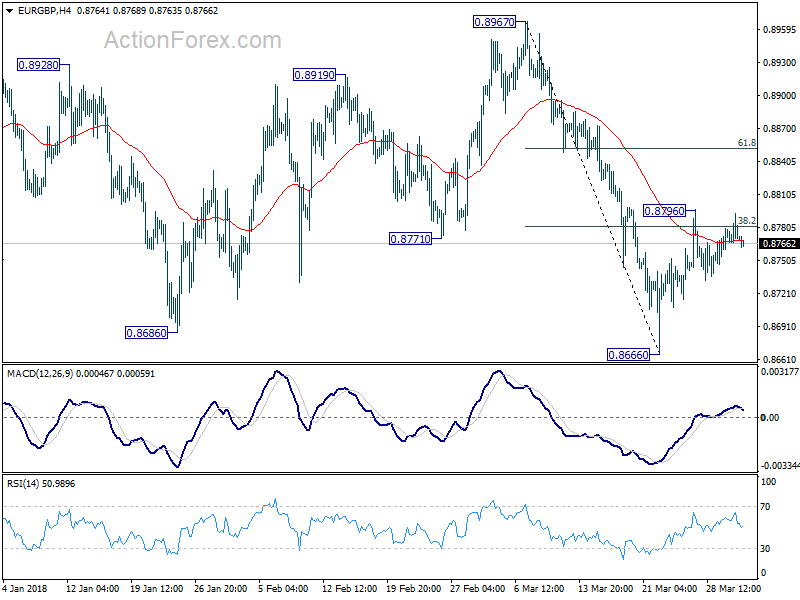
Daily Pivots: (S1) 0.8765; (P) 0.8777; (R1) 0.8792; More...
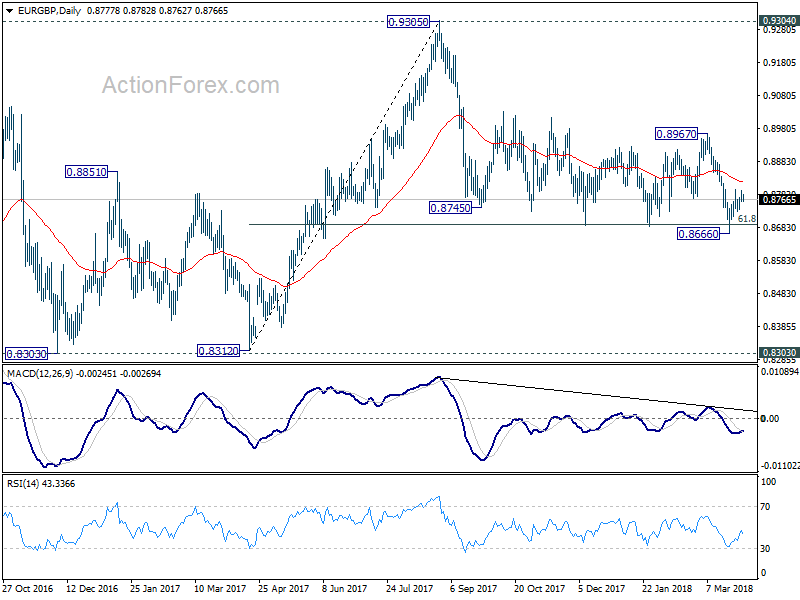
Intraday bias in EUR/GBP remains neutral fir the moment. As noted before, the cross was supported by 0.8686 key support level, we'd slightly favoring the case for further rebound. On the upside, above 0.8796 will target 61.8% retracement of 0.8967 to 0.8666 at 0.8852 and above. Nonetheless, on the downside, firm break of 0.8666 will resume the decline from 0.9305 and pave the way to 0.8303 key support zone next.
In the bigger picture, there are various ways to interpret price actions from 0.9304 high. But after all, firm break of 0.9304/5 is needed to confirm up trend resumption. Otherwise, range trading will continue with risk of deeper fall. And in that case, EUR/GBP could have a retest on 0.8303. But we'd expect strong support from 0.8116 cluster support (50% retracement of 0.6935 to 0.9304 at 0.8120) to contain downside.