Sample Category Title
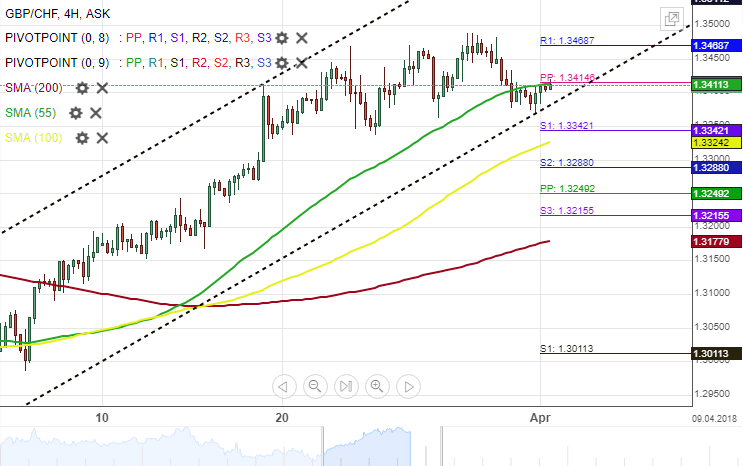
GBP/CHF 4H Chart: Junior Ascending Channel Prevailed
After reaching the lower boundary of a dominant channel on March 1, the Pound Sterling began to appreciate substantially against the Swiss Franc. As a result, the pair reached a four-month high.
A combination of the 55-, 100-, and the 200– hour SMAs has guided the currency pair higher after a crossed over on March 14. However, a resistance cluster set by the weekly pivot point and the 55—hour simple moving average has hindered any potential upside moves.
Everything being equal, a breakout is expected in either direction during the following trading sessions. Technical indicators suggest the breakout could occur through the lower boundary of a junior pattern in the short-term.
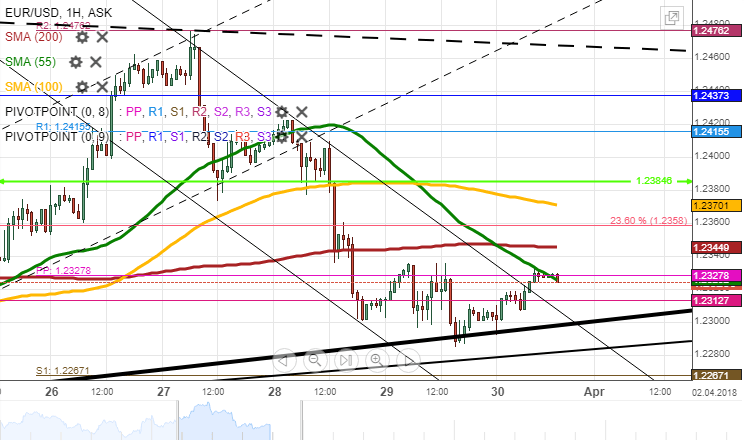
EURUSD Analysis: Moves Along 55-Hour SMA
The Euro remained steady against the Greenback on Good Friday, as it squeezed between the 200-hour SMA and the senior channel. The pair managed to break above the 55-hour moving average mid-day, but had remained trading along this line by Monday morning.
Given that the pair is likewise supported by the monthly PP and the senior channel, it is likely that the Euro tries to gain some advantage against its American counterpart in this session. Upside potential, however, is limited due to the combined resistance of the 100– and 200-hour SMAs, the weekly PP and the 23.60% Fibo. Thus, the pair is likely to continue moving in between these barriers with a slight tendency northwards.
Some volatility could be introduced by the ISM Manufacturing PMI published at 1400GMT.
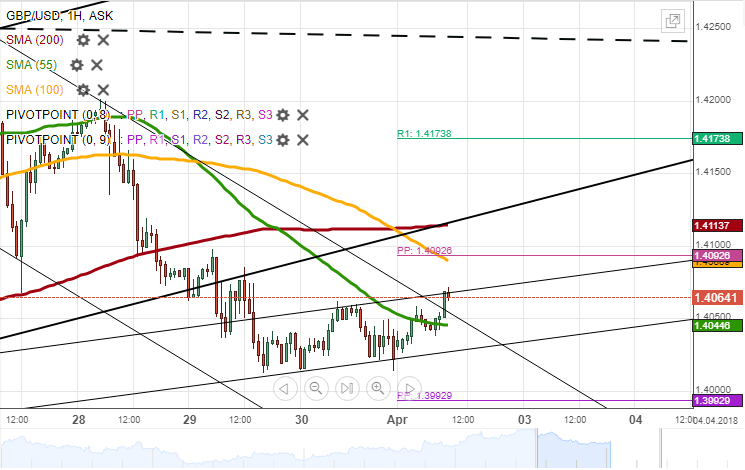
GBPUSD Analysis: Shows Slight Tendency North
Following two sessions of decline, the bearish sentiment of the GBP/USD exchange rate allayed considerably on Friday. The pair halted slightly above the psychological 1.40 mark and remained fluctuating in the 1.4020/60 range for the whole session.
By Monday morning, the Sterling had reached the 55-hour SMA, thus providing additional pressure from above. The slight tendency upwards apparent on Friday does suggest that this moving average could be breached, thus pushing the rate towards a more significant resistance formed by the 100– and 200-hour SMAs and the weekly PP near 1.41. This level which roughly coincides with a breached channel is likely to be today's high.
Meanwhile, a fall below 1.40 should not occur in this session, as this mark is supported by the monthly PP.
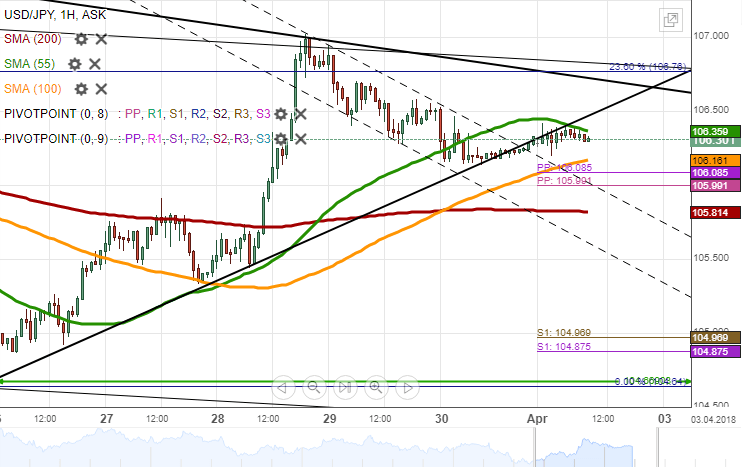
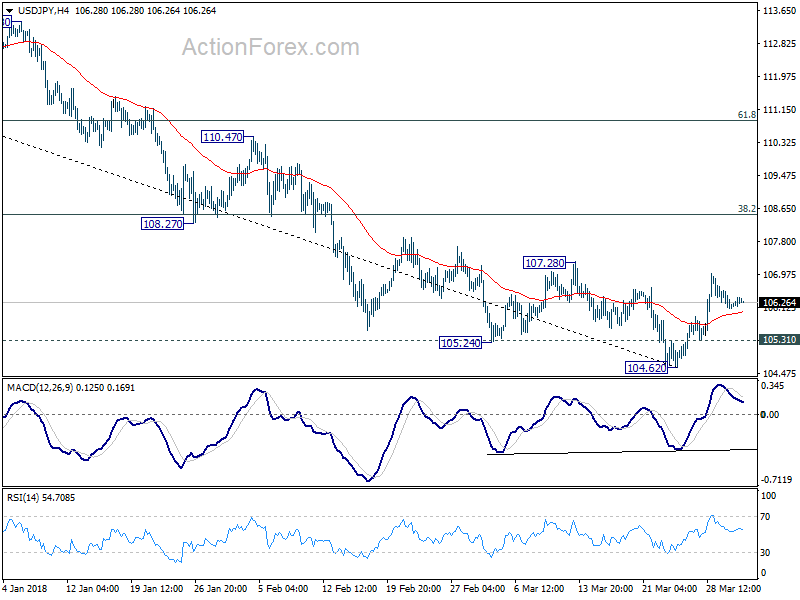
USDJPY Analysis: Pressured From Both Sides
The Good Friday was spent with mainly low volatility and narrow movement for USD/JPY. A breakout of the 55-hour SMA was not followed by a fall, as the pair started moving along a short-term trend-line.
All indications point to a possible decline in this session. The expected fall, however, is likely to be limited due to a strong support cluster set by the weekly and monthly PPs and the 100-hour SMA near 106.00.
It seems that the pair might lack enough downside momentum to move past this mark in case no fundamental releases, such as the ISM Manufacturing PMI released at 1400GMT today, strengthen the bearish sentiment. This strong support might actually push the pair higher towards the 23.60% Fibo at 106.80.
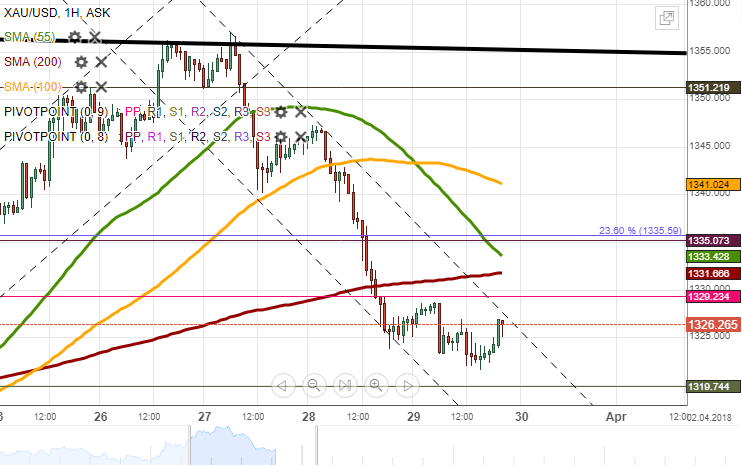
XAUUSD Analysis: Finds Strong Resistance
No trading of XAU/USD occurred on Friday, so the pair started the day from its Thursday's closing position.
The yellow metal managed to gain some strength against the US Dollar during the Asian session today and thus breached the prevailing short-term channel. Its further advance above the 1,330.00 was restricted by the 55– and 200-hour SMAs.
Technical indicators flash bullish signals, suggesting that the aforementioned resistance, likewise reinforced by the 23.60% Fibo, should surrender. In case this scenario occurs, the pair will target the 100-hour SMA at 1,340.00—a level which should mark today's high.
On the other hand, the pair has more potential to move lower in this session, as the nearest support, apart from the monthly PP at 1,330.00, is set only by the weekly PP at 1.3200.00.
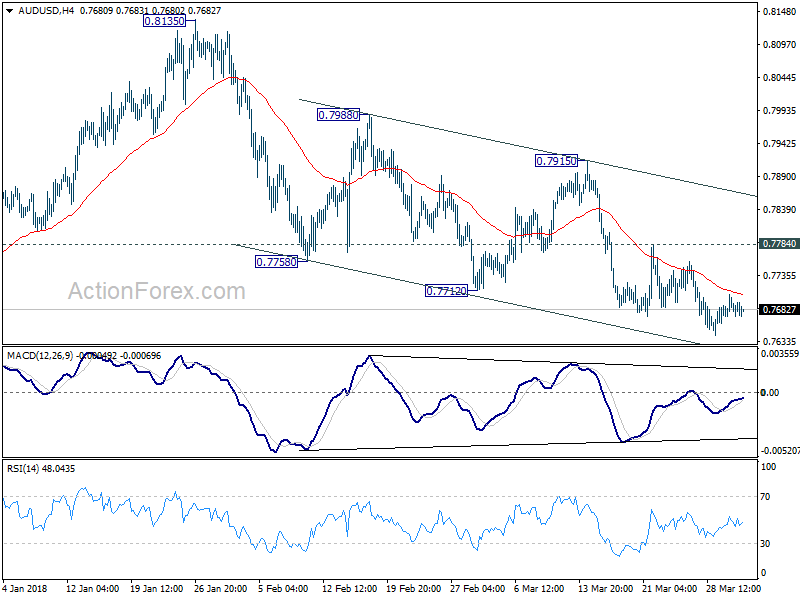
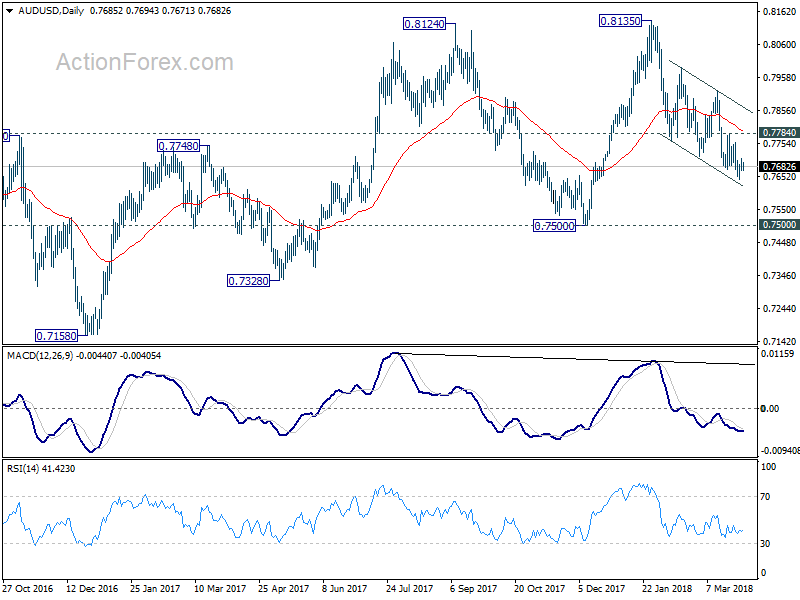
AUD/USD Daily Outlook
Daily Pivots: (S1) 0.7662; (P) 0.7684; (R1) 0.7698; More...
No change in AUD/USD's outlook. With 0.7784 minor resistance intact, further decline is expected. Current fall fro 0.8135 would target a test on 0.7500 key support level. At this point, we'll stay cautious on strong support from there to bring rebound. On the upside, however, break of 0.7784 will suggest near term reversal and turn bias to the upside for 0.7915 resistance first.
In the bigger picture, medium term rebound from 0.6826 is seen as a corrective move. It might still extend higher but we'd expect strong resistance from 38.2% retracement of 1.1079 to 0.6826 at 0.8451 to limit upside to bring long term down trend resumption. On the downside, break of 0.7500 support will now be an important signal that such corrective rebound is completed. In that case, AUD/USD would be heading back to 0.6826 low in medium term.
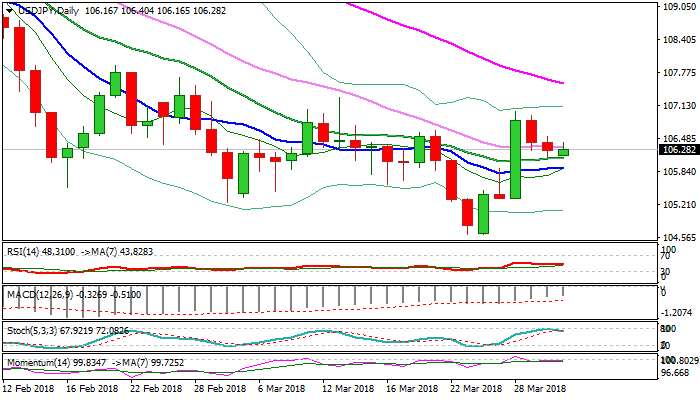
USDJPY – Recovery Attempts Struggle At 30SMA Barrier
The pair ticks higher on Monday after two-day pullback from 107.01 top found footstep at 106.10 (20SMA / Fibo 38.2% of 104.63/107.01 upleg).
Monday's range remains tight as recovery attempts were so far unable to clearly break above 30SMA (106.32) and generate firmer recovery signal.
Weak momentum studies and MA's in mixed setup keep the downside vulnerable.
Risk of renewed attack at 106.10 pivot and end extension towards next trigger at 105.92 (10SMA) would remain in play while 30SMA caps.
Bullish scenario needs close above 30SMA to re-expose pivotal 107 barrier and signal stronger recovery on break.
Res: 106.40, 106.64, 107.01, 107.29
Sup: 106.10, 105.92, 105.53, 105.32
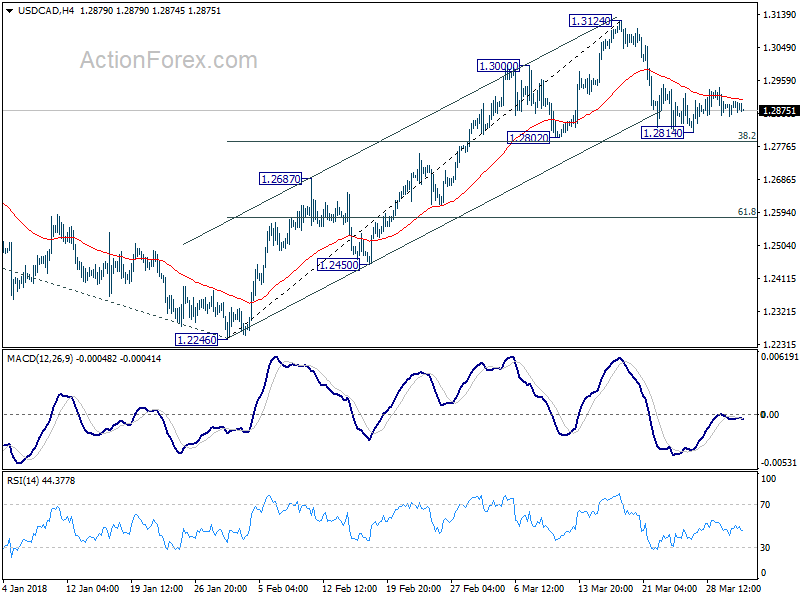
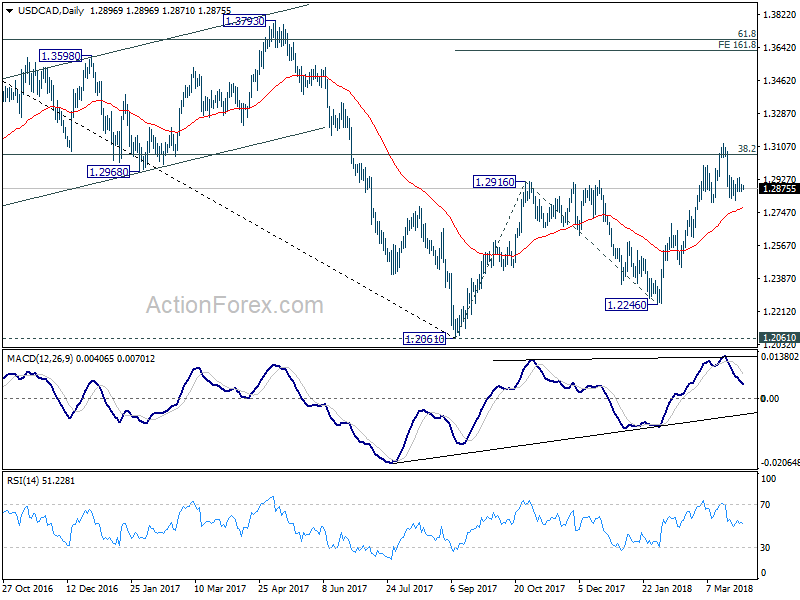
USD/CAD Daily Outlook
Daily Pivots: (S1) 1.2868; (P) 1.2884; (R1) 1.2908; More....
Intraday bias in USD/CAD remains neutral at this point. We'd still expect strong support from 1.2802 cluster support zone (38.2% retracement of 1.2246 to 1.3124 at 1.2789) to contain downside and bring rebound. Larger rise is expected to resume later. And break of of 1.3124 will target 161.8% projection of 1.2061 to 1.2916 from 1.2246 at 1.3629 next. However, on the downside firm break of 1.2789/2802 will raise the chance of rejection by 1.3065 medium term fibonacci level and bring deeper fall to 55 day EMA (now at 1.2773) and below.
In the bigger picture, we're favoring the medium term bullish case. That is, larger down trend from 1.4689 has completed at 1.2061 as a correction, drawing support from 50% retracement of 0.9406 (2011 low) to 1.4689 (2015 high) at 1.2048. Sustained break of 38.2% retracement of 1.4689 to 1.2061 at 1.3065 will pave the way to 61.8% retracement at 1.3685. This will be the preferred case now as long as 1.2802 support holds. However, rejection by 1.3065 will argue that price action from 1.2061 is merely a three wave corrective pattern. And 1.2061 will be put back into focus with medium term bearishness revived.
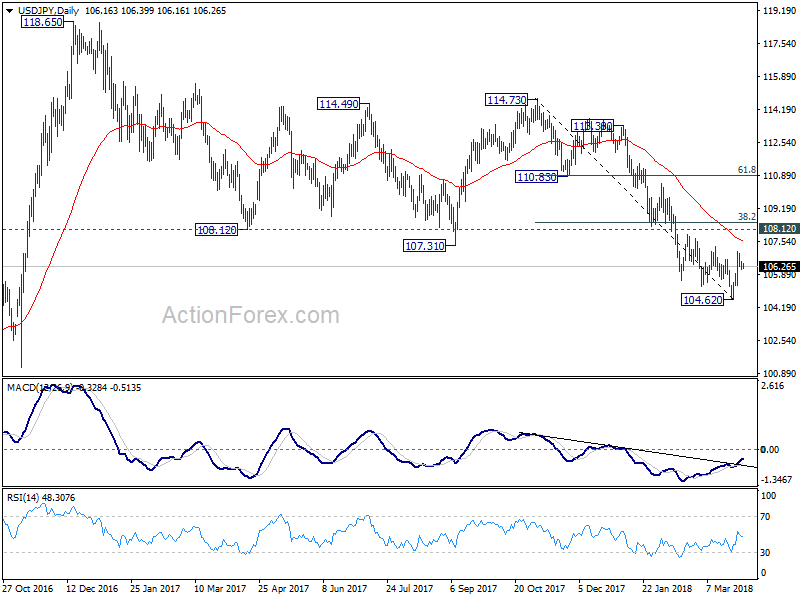
USD/JPY Daily Outlook
Daily Pivots: (S1) 106.07; (P) 106.30; (R1) 106.49; More...
No change in USD/JPY's outlook. With 105.31 minor support, further rebound is expected. Rise from 104.62 short term bottom would target 38.2% retracement of 114.73 to 104.62 at 108.48. At this point, there is no confirmation of trend reversal yet. Hence, we'll look at the reaction from 108.48 (which is close to 108.12 too) to assess the chance. On the downside, below 105.31 minor support will indicate that the rebound is completed and turn bias back to the downside for 104.62 and below.
In the bigger picture, medium term down trend from 118.65 (2016 high) is still in progress and extending. Build up in downside momentum argues that it might be extending the whole corrective pattern from 125.85 (2015 high). 100% projection of 118.65 to 108.12 from 114.73 at 104.20 will be a key level to watch as firm break there could bring downside acceleration. And in that case, 98.97 key support level (2016 low) would at least be breached. This bearish case will now be favored as long as 108.12 support turned resistance holds.
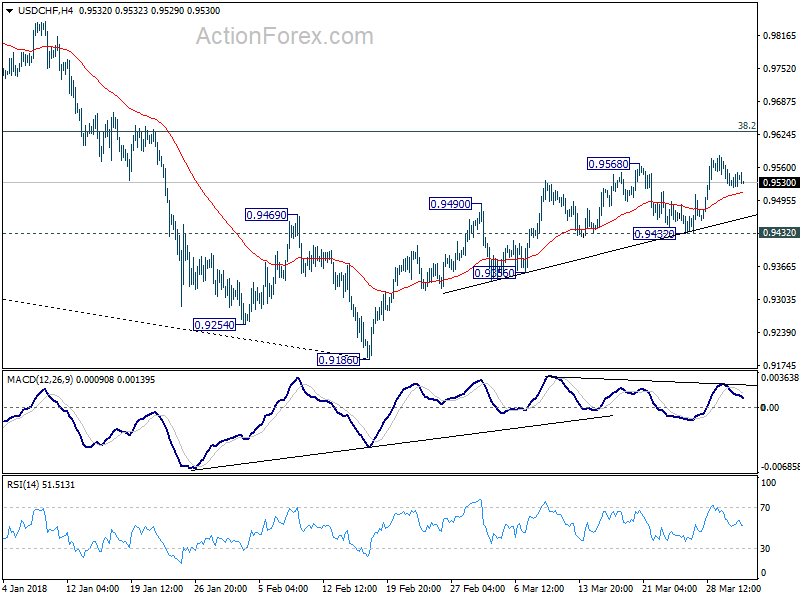
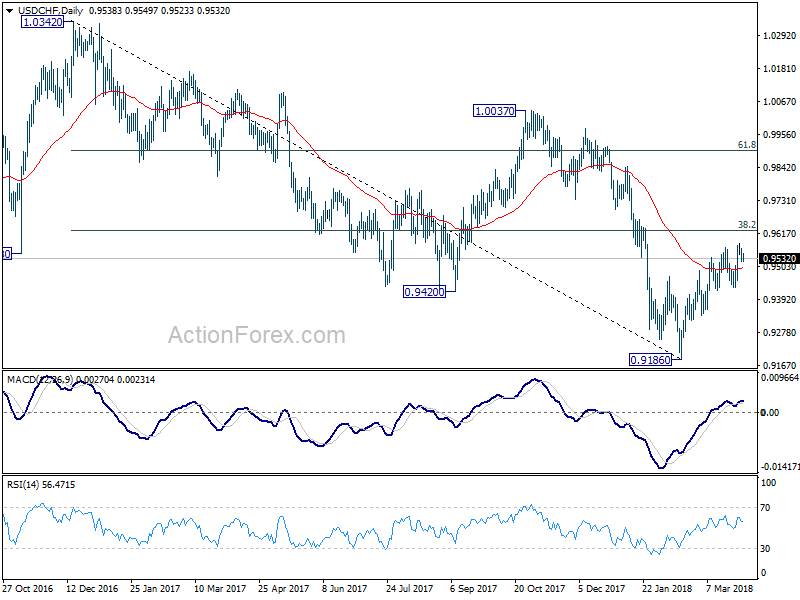
USD/CHF Daily Outlook
Daily Pivots: (S1) 0.9513; (P) 0.9538; (R1) 0.9558; More...
USD/CHF's corrective rise from 0.9186 could still extend higher. However, we'd expect strong resistance from 0.9626 key fibonacci level to limit upside. On the downside, break of 0.9432 support will indicate near term reversal and completion of rebound from 0.9186. In this case, intraday bias will be turned back to the downside for retesting 0.9186 low. However, sustained break of 0.9626 will be another evidence of larger reversal. In this case, further rise would be seen to next fibonacci level at 0.9900.
In the bigger picture, fall from 1.0342 is seen as a medium term down trend. Main focus is on 38.2% retracement of 1.0342 (2016 high) to 0.9186 (2018 low) at 0.9626. Sustained break there will add to the case of trend reversal and target 61.8% retracement at 0.9900 and above). However, rejection from 0.9626 will maintain medium term bearishness for another low below 0.9186.