Sample Category Title
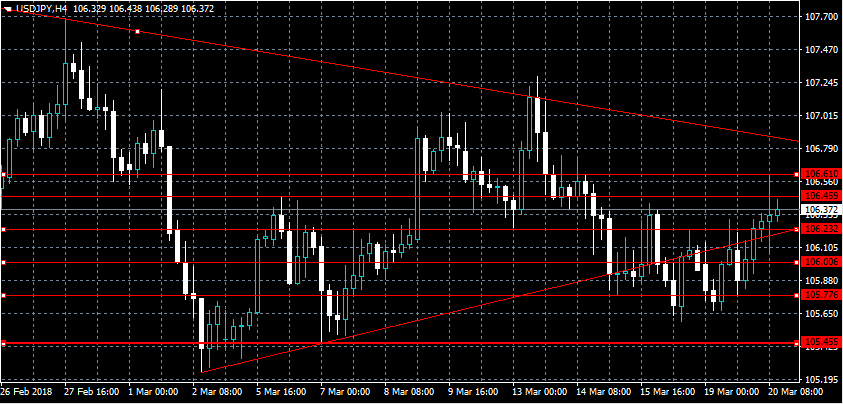
USDJPY Intraday Bullish Above 106.23 Level
The U.S dollar has moved higher against the Japanese Yen, reaching 106.61, after shorted date U.S bond-yields moved higher ahead of the Federal Reserve interest rate decision on Wednesday. The USDJPY pair currently trades around the 106.30 region, with expectations high that the FED will hike interest rate 0.25 basis points. USDJPY buyers will look for further advancement once clearly above the key 106.45 level, whilst key intraday technical support is now found at the 106.23 level.
The USDJPY pair is intraday bullish while trading above the 106.23 level, key upside resistance is now found at the 106.61 and 106.85 levels.
If the USDJPY pair declines below the 106.23 levels, further losses towards the 106.00 and 105.77 support levels cannot be ruled out.
GBPUSD Consolidating Ahead Of Next Move
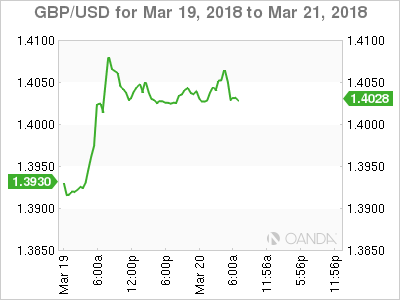
The British pound is consolidating price-action above the 1.4000 level against the U.S dollar, after the release of disappointing PPI inflation data from the UK economy. The GBPUSD pair pulled back from the 1.4060 level earlier, after UK PPI came in flat for the month of February. Moving into the U.S trading session, a clear break of the 1.4000 to 1.4060 price-range is needed for the next strong directional move in the GBPUSD pair.
The GBPUSD pair retains a bullish bias whilst trading above the 1.4000 level, intraday resistance is found at the 1.4060 and 1.4088 levels.
If GBPUSD price-action trades below the 1.4000 level for a sustained basis, a correction towards the 1.3960 and 1.3920 level cannot be ruled out.
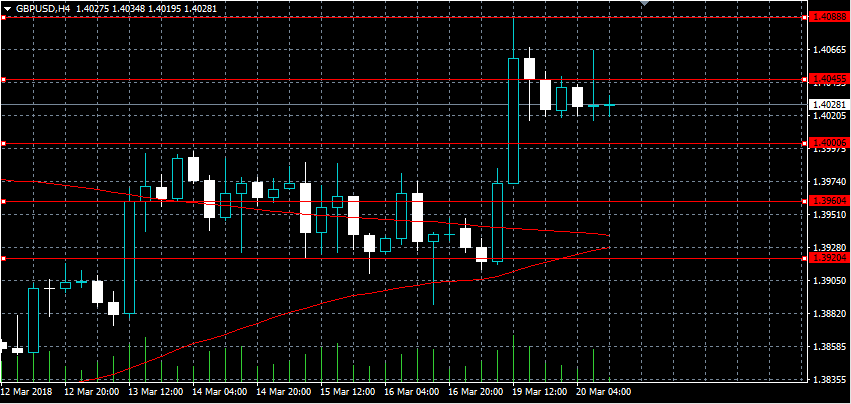
GBPUSD: Selling Pressure
Bullish momentum is fading after the Sterling reached the major resistance 1.4080.
On the 4H timeframe below for GBPUSD, the pair rebound from the resistance levels as shown. Most probable scenario a test for the support at 1.3950.

Sterling Strong Despite Weaker Inflation
European stocks trade mixed despite a U.S tech equity selloff fading and as the market turns its attention to this week’s Fed rate decision and potential new trade tariffs from President Trump targeting China. The U.S dollar is steady while sovereign bonds fall.
The market has priced in a +100% probability of a +25-bp rate hike at the conclusion of the FOMC’s two-day meeting tomorrow (02:00 pm). But, will there be a shift in the dot plot?
Recent U.S data and Fed speeches would suggest the median of FOMC participants’ assessment of the appropriate pace of policy firming (the dots) will unite around +2.125% or three-hikes for 2018, with an outside risk the median dot will move to +2.375%.
Also posing a risk to dollar and yield curve positions is the possibility the median dot for 2019 has moved up towards +3.125%, signifying a belief among FOMC participants that four additional rate hikes will be appropriate next year.
1. Asian equities mixed
In Japan, the Nikkei share average fell overnight as domestic tech stocks tracked their U.S counterparts’ declines, but declines were limited as the market refrained from taking large positions before tomorrow’s Fed’s rate decision. The Nikkei dropped -0.5%, while the broader Topix shed -0.2%.
Down-under, Aussie shares closed lower in light trade, with commodity stocks pressured by concerns President Trump could impose more protectionist trade measures. The S&P/ASX 200 index fell -0.4%. In S. Korea, the Kospi stock index erased early losses overnight as domestic institutions’ purchases gave support. The Kospi was up +0.42%.
In Hong Kong, stocks were little changed, as investors braced for Chairman Powell’s first policy meeting starting later today. At the close, the Hang Seng index rose +0.1%, while the China Enterprises Index lost -0.5%.
In China, stocks end higher as healthcare firms shine and as Beijing pledges further market opening as talk of trade war mounts. At the close, the Shanghai Composite index was up +0.3%, while the blue-chip CSI300 index was up +0.08%.
In Europe, regional indices drift into negative territory tracking U.S futures lower, with the Nasdaq continuing to underperform as tech stocks remain in focus following privacy backlash.
U.S stocks are set to open in the ‘red’ (-0.2%).
Indices: Stoxx600 -0.1% at 373.3, FTSE +0.1% at 7051, DAX -0.2% at 12198, CAC-40 -0.2% at 5211, IBEX-35 -0.5% at 9618, FTSE MIB -0.1% at 22608, SMI -0.4% at 8776, S&P 500 Futures -0.2%
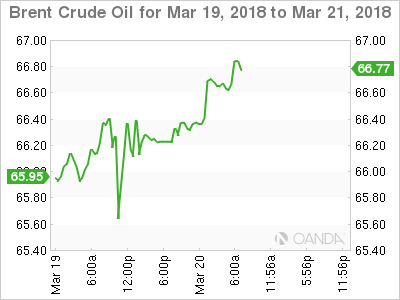
2. Oil prices rise on Middle East tension, gold lower
Oil prices are better bid, lifted by a mixed dollar, tensions in the Middle East and concerns of a further fall in Venezuelan output.
Brent crude futures are at +$66.53 per barrel, up +48c, or +0.7%, while U.S West Texas Intermediate (WTI) crude futures are at +$62.61 a barrel, up +55c or +0.9%, from Monday’s close.
The IEA said last week that Venezuela, where an economic crisis has cut oil production by almost -50% to well below +2m bpd was “clearly vulnerable to an accelerated decline”, and that such a disruption could tip global markets into deficit.
Capping prices somewhat is U.S crude oil production, which has risen by more than a fifth since mid-2016, to +10.38m bpd.
Note: U.S output is now higher than that of top exporter Saudi Arabia. Only Russia produces more, at around +11m bpd, although U.S output is expected to overtake Russia’s later this year.
Ahead of the U.S open, gold prices have inched lower on firmer dollar ahead of today’s two-day Fed meeting. Spot gold is down -0.1% to +$1,314.98 per ounce. In the previous session, it touched +$1,307.51 an ounce, its lowest since March 1.
3. Sovereign yields little changed
U.S Treasury yields traded flat yesterday as investors look to bonds for safety. The yield on the U.S 2-year note hit a high yield of +2.32%, its highest level since Sept. 9, 2008, when the 2-year yielded as high as +2.375%.
Note: Fed-funds futures are pricing in a +35% chance that the Fed will boost rates four times this year, up from +34% a week ago.
The Bank of Japan (BoJ) Summary of Opinions released Monday indicated that the +2% price target was still distant. Additional easing would be needed if there were a risk that achieving price target would be delayed. One board member said further yen appreciation (¥106.21) and stock declines could curb Capex and consumer spending, which could delay hitting inflation target.
Down-under, yesterday’s RBA march meeting minutes suggested that financial market pricing continued to imply that the cash rate was expected to remain unchanged during 2018, with a +25 bps increase expected in H1 of 2019
In Korea, concern amongst Bank of Korea board members over softer-than-expected inflation so far this year is growing. Minutes from the central bank’s Feb. 27 meeting showed board members expect inflation to probably miss the bank’s earlier-projected pace of +1.5% for H1 and likely lag far behind the bank’s +2% annual target. The subdued inflation reflects still-frail private consumption despite a solid recovery in exports. The bank has kept policy unchanged since its first rate increase in more than six-years.
The yield on U.S 10-year Treasuries has rallied +1 bps to +2.87%. In Germany, the 10-year Bund yield has backed up +2 bps to +0.58%, while in the U.K, the 10-year Gilt yield has climbed +2 bps to +1.445%
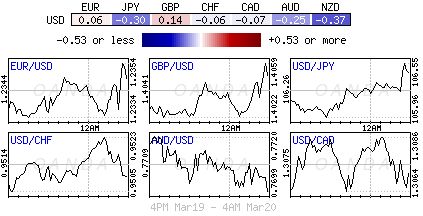
4. Dollars mixed results
Trade and tariffs remain to the fore. An escalation on trade issues is now seen entering its next stage with the U.S administration considering imposing a +$60B tariff on China’s +$510B of exports into the U.S by the end of the week.
USD/JPY (¥106.34) has moved higher after Japanese officials noted that the country would/could secure some exemptions from U.S tariffs on steel and aluminum on per-item basis. The overnight high print (¥106.60) came after the new BoJ Deputy Governor Amamiya peddled the standard BoJ rhetoric. He also noted that he saw no need to consider rate hikes at this time, but did not rule out adjusting rates before hitting inflation target.
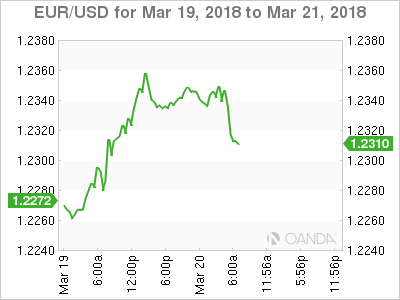
EUR/USD (€1.2309) has maintained some of yesterday’s stamina when ECB officials had begun to shift the debate towards the steepness of the rate path with even the most dovish members accepting that QE should end this year.
Sterling (£1.4025) fell after February’s U.K annual inflation print eased (see below). Weaker data may at the margins dampen expectations for future U.K. rate increases, but the market remains cautious before Thursday’s BoE policy announcement.
5. U.K inflation eased in February
Data this morning showed that annual inflation in the U.K. slowed last month, as the effects of a steep decline in the pound began to fade.
Consumer prices rose +2.7% on the year in February, compared with a rise of +3% a month earlier.
The decline reflected a fall in gas prices and weaker gains in prices of food and other goods than a year earlier.
Note: The fall in the pound following the Brexit vote pushed CPI above the BoE’s +2% target for most of 2017. The BoE is expected to hold rates steady on Thursday. The next move could come as soon as May.
Other data showed that wider inflationary pressures in the U.K economy eased in February, with the prices charged by companies at the factory gate (PPI) rising +2.6% on year, compared with a rise of +2.8% a month earlier. Firms’ raw material costs rose +3.4%, against a rise of +4.5% in January.
Euro Dips As Economic Confidence Slides
EUR/USD has edged lower in the Tuesday session. Currently, the pair is trading at 1.2309, down 0.20% on the day. On the release front, Germany PPI surprised the markets with a decline of 0.1%, shy of the estimate of +0.1%. This marked the first decline since May. German ZEW Economic Sentiment plunged to 5.1 points, down from 17.8 a month lower. This reading was well off the forecast of 13.1 points and marked the lowest reading since September 2016. Eurozone ZEW Economic Sentiment followed the same trend, dropping to 13.4, compared to a forecast of 28.1 points.
After months of wrangling between Britain and the EU, the two sides announced that there would be a transition period following the UK’s departure from the EU in March 2019. The transition deal will kick in at that time, lasting until December 2020. The deal covers the rights and status of EU citizens in the UK and British citizens in the EU, and allows the UK to pursue new trade agreements during that time. There are still issues to iron out, such as the Northern Ireland border. The transition period is a major, positive development, in that it will enable Britain to enjoy the benefits of the common market, albeit without a seat at the table.
Sterling Strong Despite Weaker Inflation
The Federal Reserve is poised to raise interest rates on Wednesday, which would mark the first hike of 2018. According to the CME Group, the odds of a quarter-point raise stand at an impressive 91 percent. What can we expect from the Fed during the year? The current Fed projection remains at three hikes, but a robust US economy has raised speculation that the Fed could accelerate the pace to four hikes, which would be good news for the US dollar. Investors will be keeping a close eye on key US data, especially upcoming inflation indicators. If these numbers improve, we’re likely to see four rate hikes in 2018.
Forex Analysis: Nasdaq And EURGBP
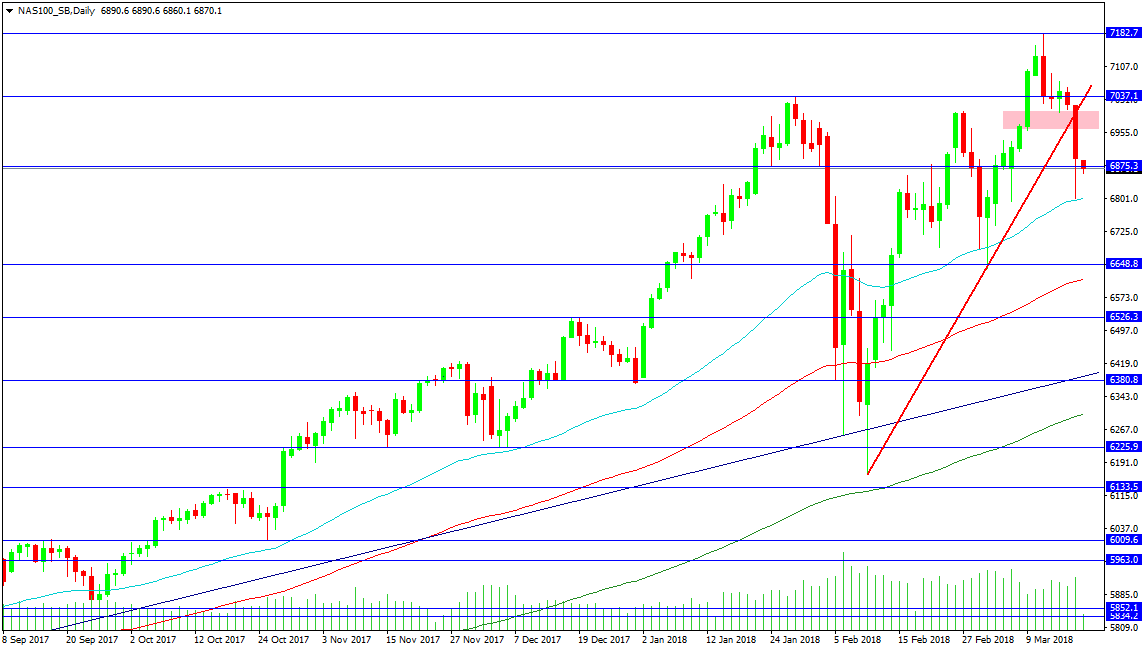
The US Tech Index took most of the hit yesterday, creating a gap down and forming an Island reversal pattern, shown as the pink shaded area on the chart. This is a bearish development and may signal a move down towards the February lows. However, there is hope for bulls, as the recovery from those lows was strong enough to reach new all-time highs. The index seems to have difficulty holding above 7000 and for bulls to take control they will need to achieve this. The trend line break sparked the initial move lower at that level. Resistance comes in at the January high of 7037.10 and the February high of 7182.70.
The 50-Day MA at 6800.00 stopped the fall yesterday but this is now route 1 for bears to drive the price lower. Support can be found at 6648.8, as the last lower high, followed by the 100 DMA at 6615.36. The 6526.30 level is found below, with trend line support at 6388.60, backed by the 6380.80 level. The 200 DMA is located at 6302.10, with recent lows at 6164.10.
EURGBP
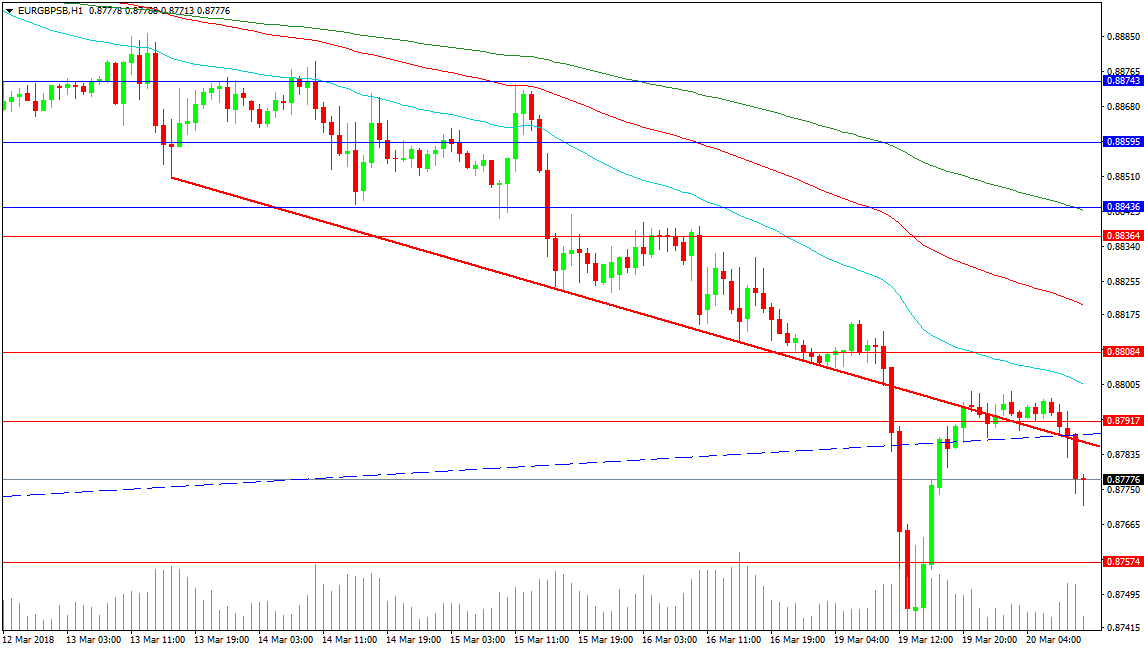
The EURGBP pair has fallen through the support of a descending trend line. This is unusual and indicates a push lower to find support. The pair was affected by headlines yesterday, as the EU and UK agreed on a transition document to maintain the status quo until 2020. This led to a recovery in price, from the low at 0.87447, back to test 0.88000 as the breakdown level. This morning price has fallen to 0.87799, which creates a higher low. The trend lines have been tested and are weak at present, as traders position themselves ahead of UK CPI data and Eurozone ZEW Survey results.
Resistance above can be found at 0.88084, with the 100-period MA at 0.88198. There is stronger resistance at the 0.88364 level, with the 200-period MA above at the 0.88436 level all combining to form a zone. The 0.88743 level is also a strong place to find orders. Support comes at the low from yesterday, followed by the 0.87162 level.
CRUDE OIL Strengthening
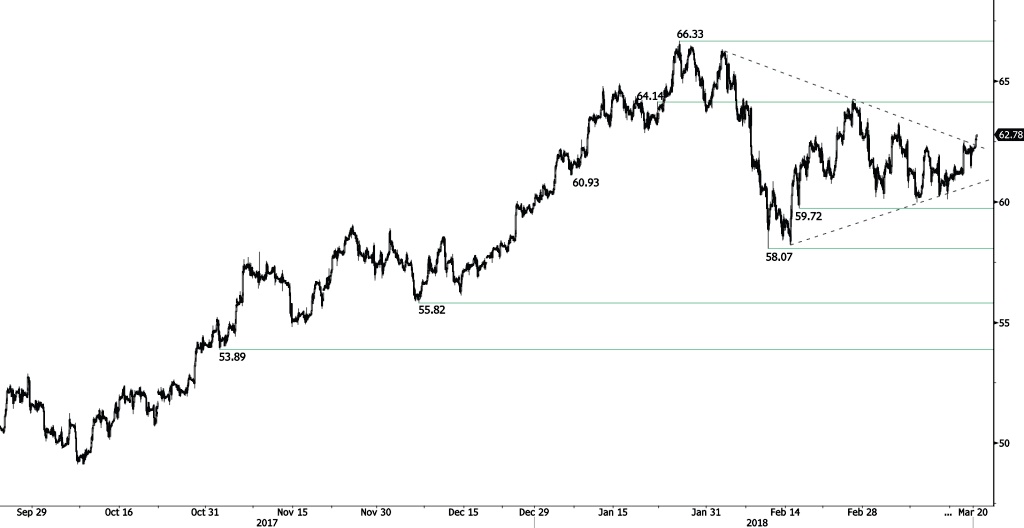
Crude oil is bouncing off from 61.36 low, approaching hourly resistance at 64.14 (22/01/2018 high). Hourly support at 59.72 (15/02/2018 low) is distanced. The technical structure suggests short-term increase.
In the long-term, crude oil has recovered after its sharp decline last year. However, we consider that further weakness is very likely. For the time being, the pair lies in an upside trend since June 2017. Support lies at 42.20 (16/11/2016) while resistance is located at 77.83 (20/11/2014). Crude oil is trading largely above its 200 DMA.
SILVER Bearish Consolidation
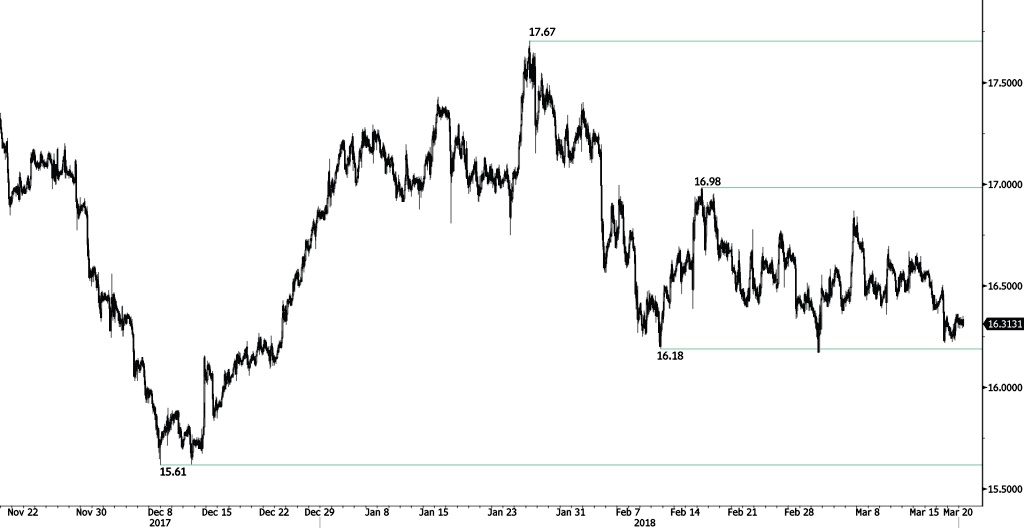
Silver is giving signs of further weakness following recent consolidation phase at the 16.30 range, approaching hourly support at 16.18 (09/02/2018 low). Hourly resistance at 16.98 (15/02/2018 high) is distanced. The short-term technical structure suggests further short-term decrease.
In the long-term, the trend remains negative/ sideways. Further downside is very likely. The pair is trading below its 200 DMA. Resistance is located at 21.58 (10/07/2014 high). Strong support can be found at 11.75 (20/04/2009).
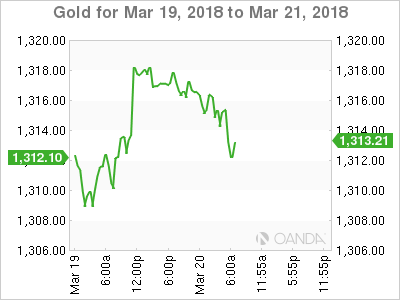
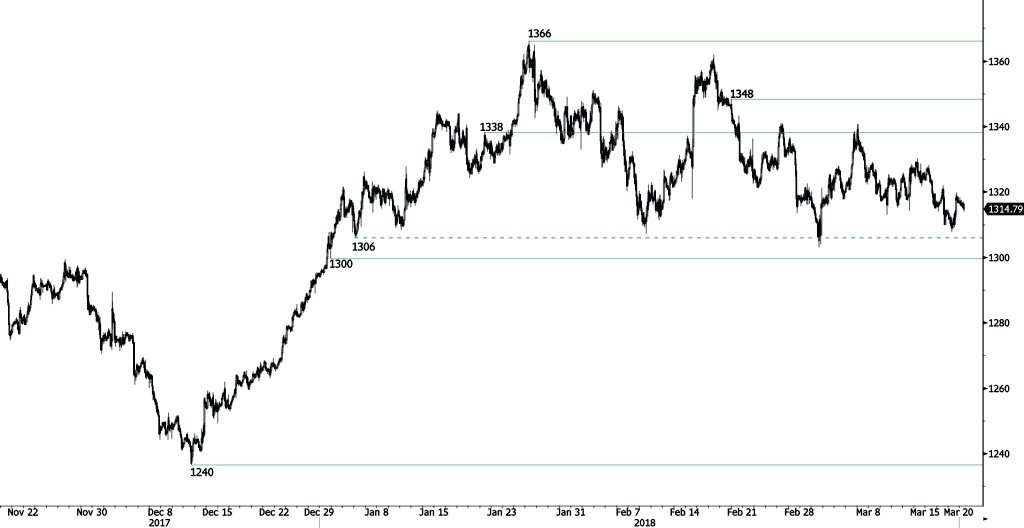
GOLD Decreasing
Gold is decreasing following recent sideways trading phase, trading below 1315 and expected to decline along the 1308 range. The pair is contained between hourly support and resistance given at 1300 (29/12/2017 low) and 1338 (19/02/2018 high). The technical structure suggests further short-term decrease.
In the long-term, the technical structure suggests that there is a growing upside momentum. A break of 1'392 (17/03/2014) is required to confirm it. A major support can be found at 1'045 (05/02/2010 low).
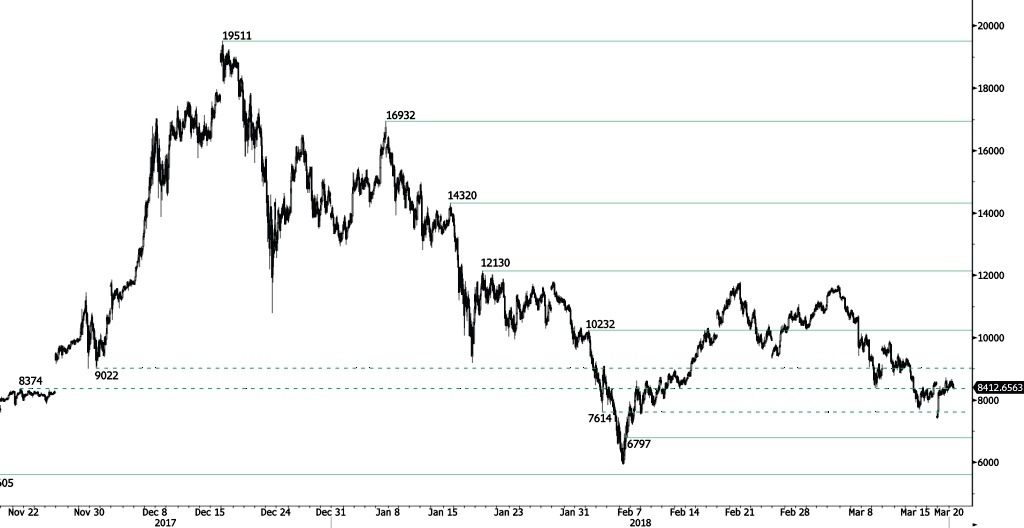
BITCOIN Slight Increase
Bitcoin is slightly increasing following recent consolidation phase at the 8200 range. Expected to rise along 8500. Hourly support and resistance at 6797 (06/02/2018 low) and 12130 (18/01/2018 high) remain.
In the long-term, the digital currency has had an exponential growth but also presented important downturns. There is decent likelihood that the currency could stabilize between 7'000 - 12'000 in 2018. Bitcoin is approaching its 200 DMA (7000 range).