Sample Category Title
Pound Shrugs as CPI Dips
The British pound has edged lower in the Tuesday session. In North American trade, GBP/USD is trading at 1.4012, down 0.22% on the day. On the release front, British CPI dropped to 2.7%, down from 3.0% a month earlier. The reading fell shy of the estimate of 2.8%, and marked a 7-month low. There are no US events on the schedule. On Wednesday, the US releases Current Account and Existing Home Sales. As well, the Federal Reserve is expected to raise interest rates for the first time in 2018.
British inflation remains high, but CPI, the primary gauge of consumer inflation, dropped in February. This is good news for consumers, who have seen their purchasing power steadily deteriorate, with inflation levels of around 3% in recent months. Still, the Bank of England is expected to raise rates at the May meeting, even with the drop in inflation.
After months of rough rhetoric between Britain and the EU, the two sides announced that there would be a transition period following the UK’s departure from the EU in March 2019. The transition deal will kick in at that time, lasting until December 2020. The deal covers the rights and status of EU citizens in the UK and British citizens in the EU, and allows the UK to pursue new trade agreements during that time. There are still some issues to iron out, such as the Northern Ireland border. The transition period is a major, positive development, in that it will enable Britain to enjoy the benefits of the common market, albeit without a seat at the table.
AUD Still under Pressure
The AUD is again going down against the US dollar after taking a short break. The Aussie was unable to get stabilized even after the RBA meeting minutes were released today. The EUR/USD bounce did not make any substantial difference either. It looks like the sentiment towards the Aussie is hitting its lows, which may well send the currency to the bottom it reached before in March.
The RBA minutes say the Australian economy is doing good, with the growth likely to exceed the average expectations. The inflation, meanwhile, may surpass 2%, although low interest rates act as a slowing-down effect for the CPI. The minutes also state that too strong Aussie is negatively influencing both the GDP and the inflation. This is not the first time the RBA points that out, and while the Aussie had previously been resistant to that, this time it did show some negative reaction.
Another thing the RBA minutes say is that the job market is on its positive way, and this may act as a good support for the economy. Average wages are growing, and in far more sectors and industries than before.
The weak point of the Australian economy is still the household spending; this is an old and known issue, and it can be resolved only by drastically raising the level of wellbeing in the country, so that large one-time spending may no longer be a problem for people. Currently, this is not the case, and the household spending remains a slowing-down factor for Australia.
As a rule, the Aussie shows little reaction to RBA minutes and hawkish tone, but this time there were no other important info or stats on the table, and the AUD had to respond to the minutes, which put it under heavy pressure.
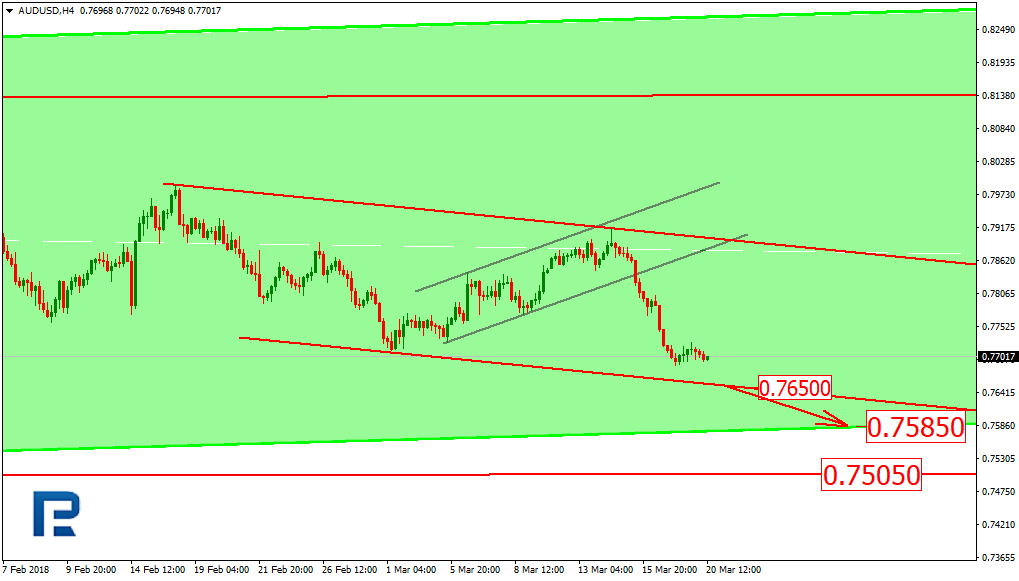
To understand what is going on with AUD/USD, technically, one has to determine multiple trend tiers here. The first tier covers the movement occurring over the last year; here, the trend is overall ascending, while the last high was just 10 or 12 pips bigger than the previous one, which may signal that the momentum is fading out. Meanwhile, both mid term and short term trends are descending, with the latter approaching the channel support at 0.7650. In case this one gets broken out, the price may head even further down, i.e. to the major ascending channel support at 0.7585. Again, if this one is broken out, the price may start testing the range within 0.7500 and 0.7505. This is actually the area where most demand is concentrated, so the way the market will react to the price moving towards this are will determine the further AUD movement for the following one or two years.
RBNZ Meeting: Will the Song Remain the Same?
The Reserve Bank of New Zealand (RBNZ) will announce its rate decision on Wednesday at 2000 GMT, and policymakers are widely anticipated to stand pat. Given the lack of major developments recently, the Bank seems unlikely to alter its neutral tone, and the financial community appears to view this meeting as a “non-event”. With very few expecting the RBNZ to say anything new though, the Kiwi may be at risk as even small language changes could have a market impact, especially if the Bank flags increasing trade tensions as a key downside risk.
Developments since the RBNZ last met in February have been broadly mixed. On the positive side, business confidence rebounded off its recent lows, while the terms of trade were surprisingly strong in Q4, painting a rosier picture for exports. Meanwhile, gains in housing prices remained moderate, which is important as the Bank was previously worried that rapidly rising house prices posed risks to financial stability. On the downside, GDP for Q4 came in at 0.6% quarter-on-quarter, a touch softer than the RBNZ’s estimate of 0.7%. Moreover, the recent escalation in protectionist rhetoric from the US and the rising probability of a “trade war” will no doubt worry the Bank, as New Zealand is an export-focused economy.
While none of the above is significant enough at the moment to warrant a shift in the RBNZ’s neutral stance, there are two additional reasons for the Bank not to change tone: upcoming leadership and mandate changes. This will be the last gathering under current Governor Grant Spencer, before the new Governor Adrian Orr takes over later this month. As for the mandate, the RBNZ’s directive will soon be expanded to promote full employment in addition to price stability. Importantly though, the specific wording of the new mandate has not been revealed yet. Thus, policymakers are currently faced with a great deal of uncertainty, as the exact phrasing and details of the mandate could be crucial to their future decisions, implying they are unlikely to want to pre-commit to anything at this stage.
Therefore, everything points to a “steady as she goes” policy message from the RBNZ, not tipping the scale in either direction and maintaining a highly data-dependent approach regarding the timing of any rate hike in New Zealand. Still, there are risks in terms of market action. In a complacent environment where very few investors expect the RBNZ to say anything new, even minor changes to the policy statement can have a notable impact in the foreign exchange market, as they could come as surprises. For example, although it’s still early for the RBNZ to appear particularly worried about trade, given that there are so many unknowns, the Bank could still issue a preliminary warning that an intensification in these risks would likely have implications for policy.
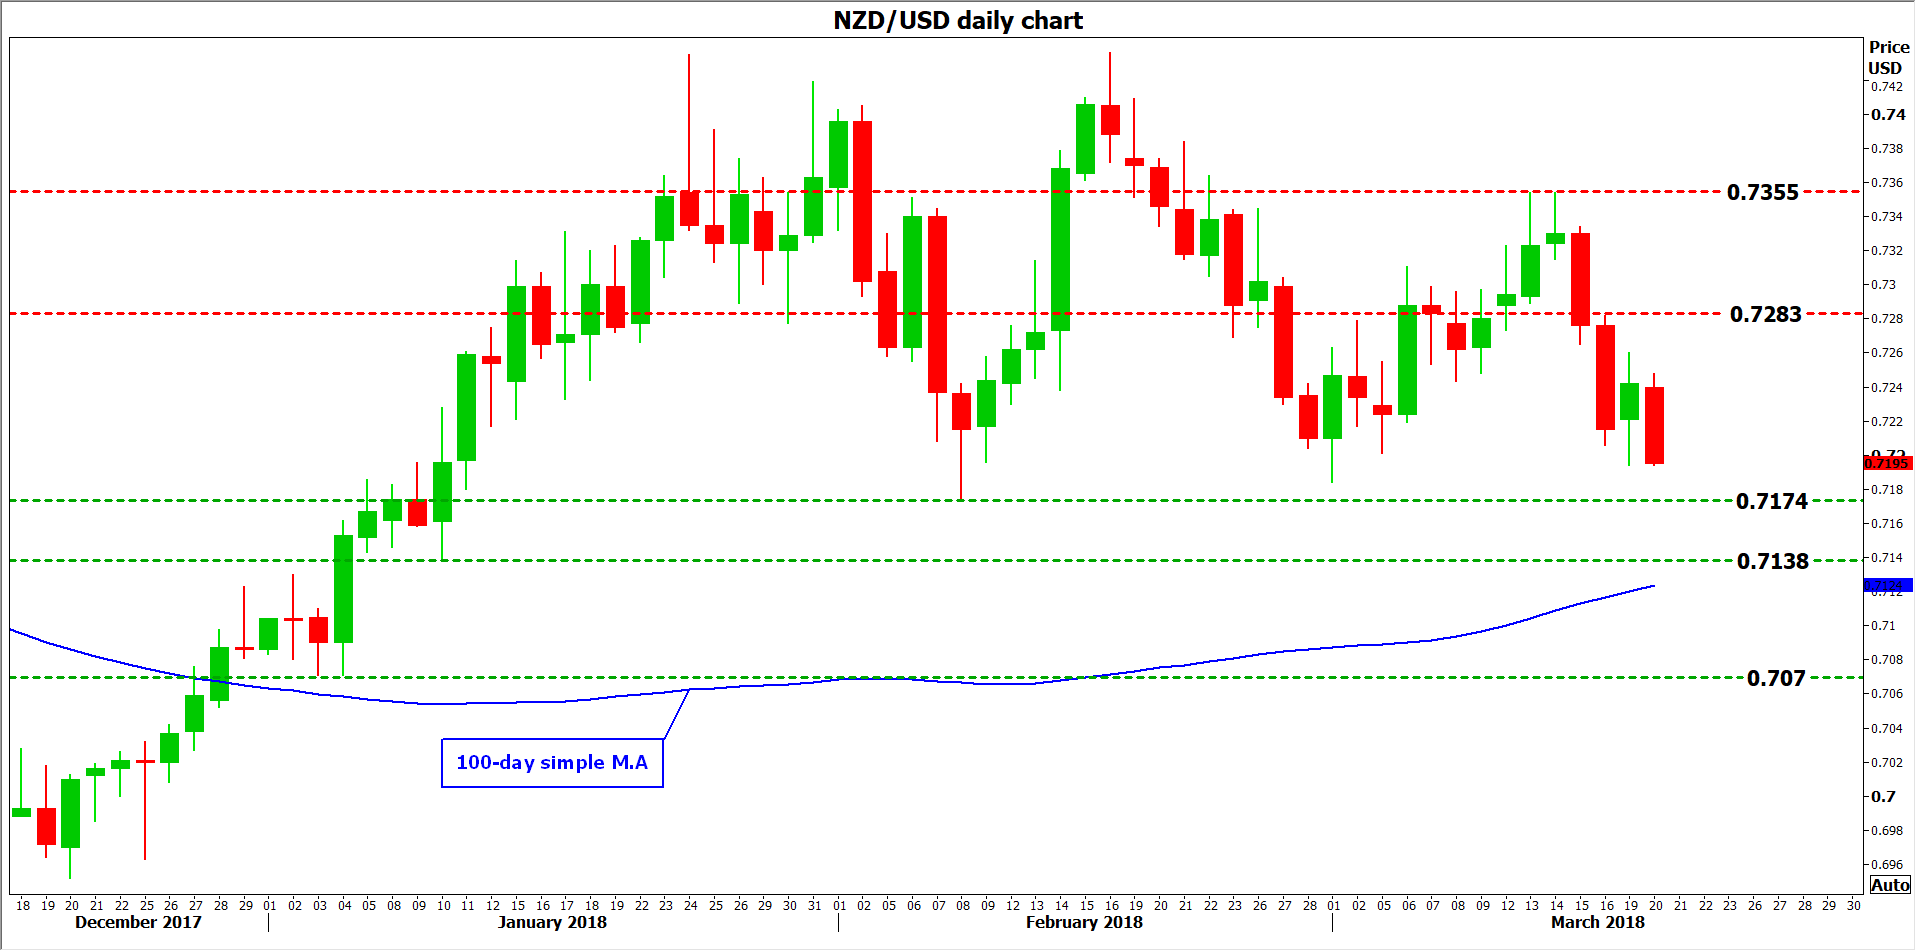
At the time of writing, markets see a 25% probability for the RBNZ to hike rates this year. A worried message by the Bank – one that conveys anxiety about increased protectionism for instance – could push that probability lower, and the Kiwi down with it. Kiwi/dollar may break back below the February low of 0.7174, and aim for a test of the 0.7138 zone, marked by the January 10 troughs. Even steeper declines after that could encounter support around the 0.7070 barrier, marked by the January 4 lows.
Conversely, a more upbeat policy message that is interpreted as making a rate hike this year more likely, could spell good news for New Zealand’s currency. In this case, kiwi/dollar may edge higher and test the 0.7283 barrier, identified by the highs of March 2 and the inside swing low on March 12. An upside break of that area could set the stage for further advances towards the peak of March 14, at 0.7355.
March FOMC Meeting Will Be Epic, But Will Jerome Powell Revive The US Stock Market?
The FOMC gradual rate hiking clearly sustained the stock markets and indices along with stocks which enjoyed a sustained bullish rally. This has been going on since the 2008 Recession.
Volatility hit record lows in the 4th quarter of 2017 and this was obviously caused by investors’ complacency and buying euphoria.
The buying euphoria was suddenly interrupted on the 21st of Jan 2018, when Dow Jones, SNP500 and Nasdaq have shown huge drops in price action, causing investors to wake up on the edge of the cliff.
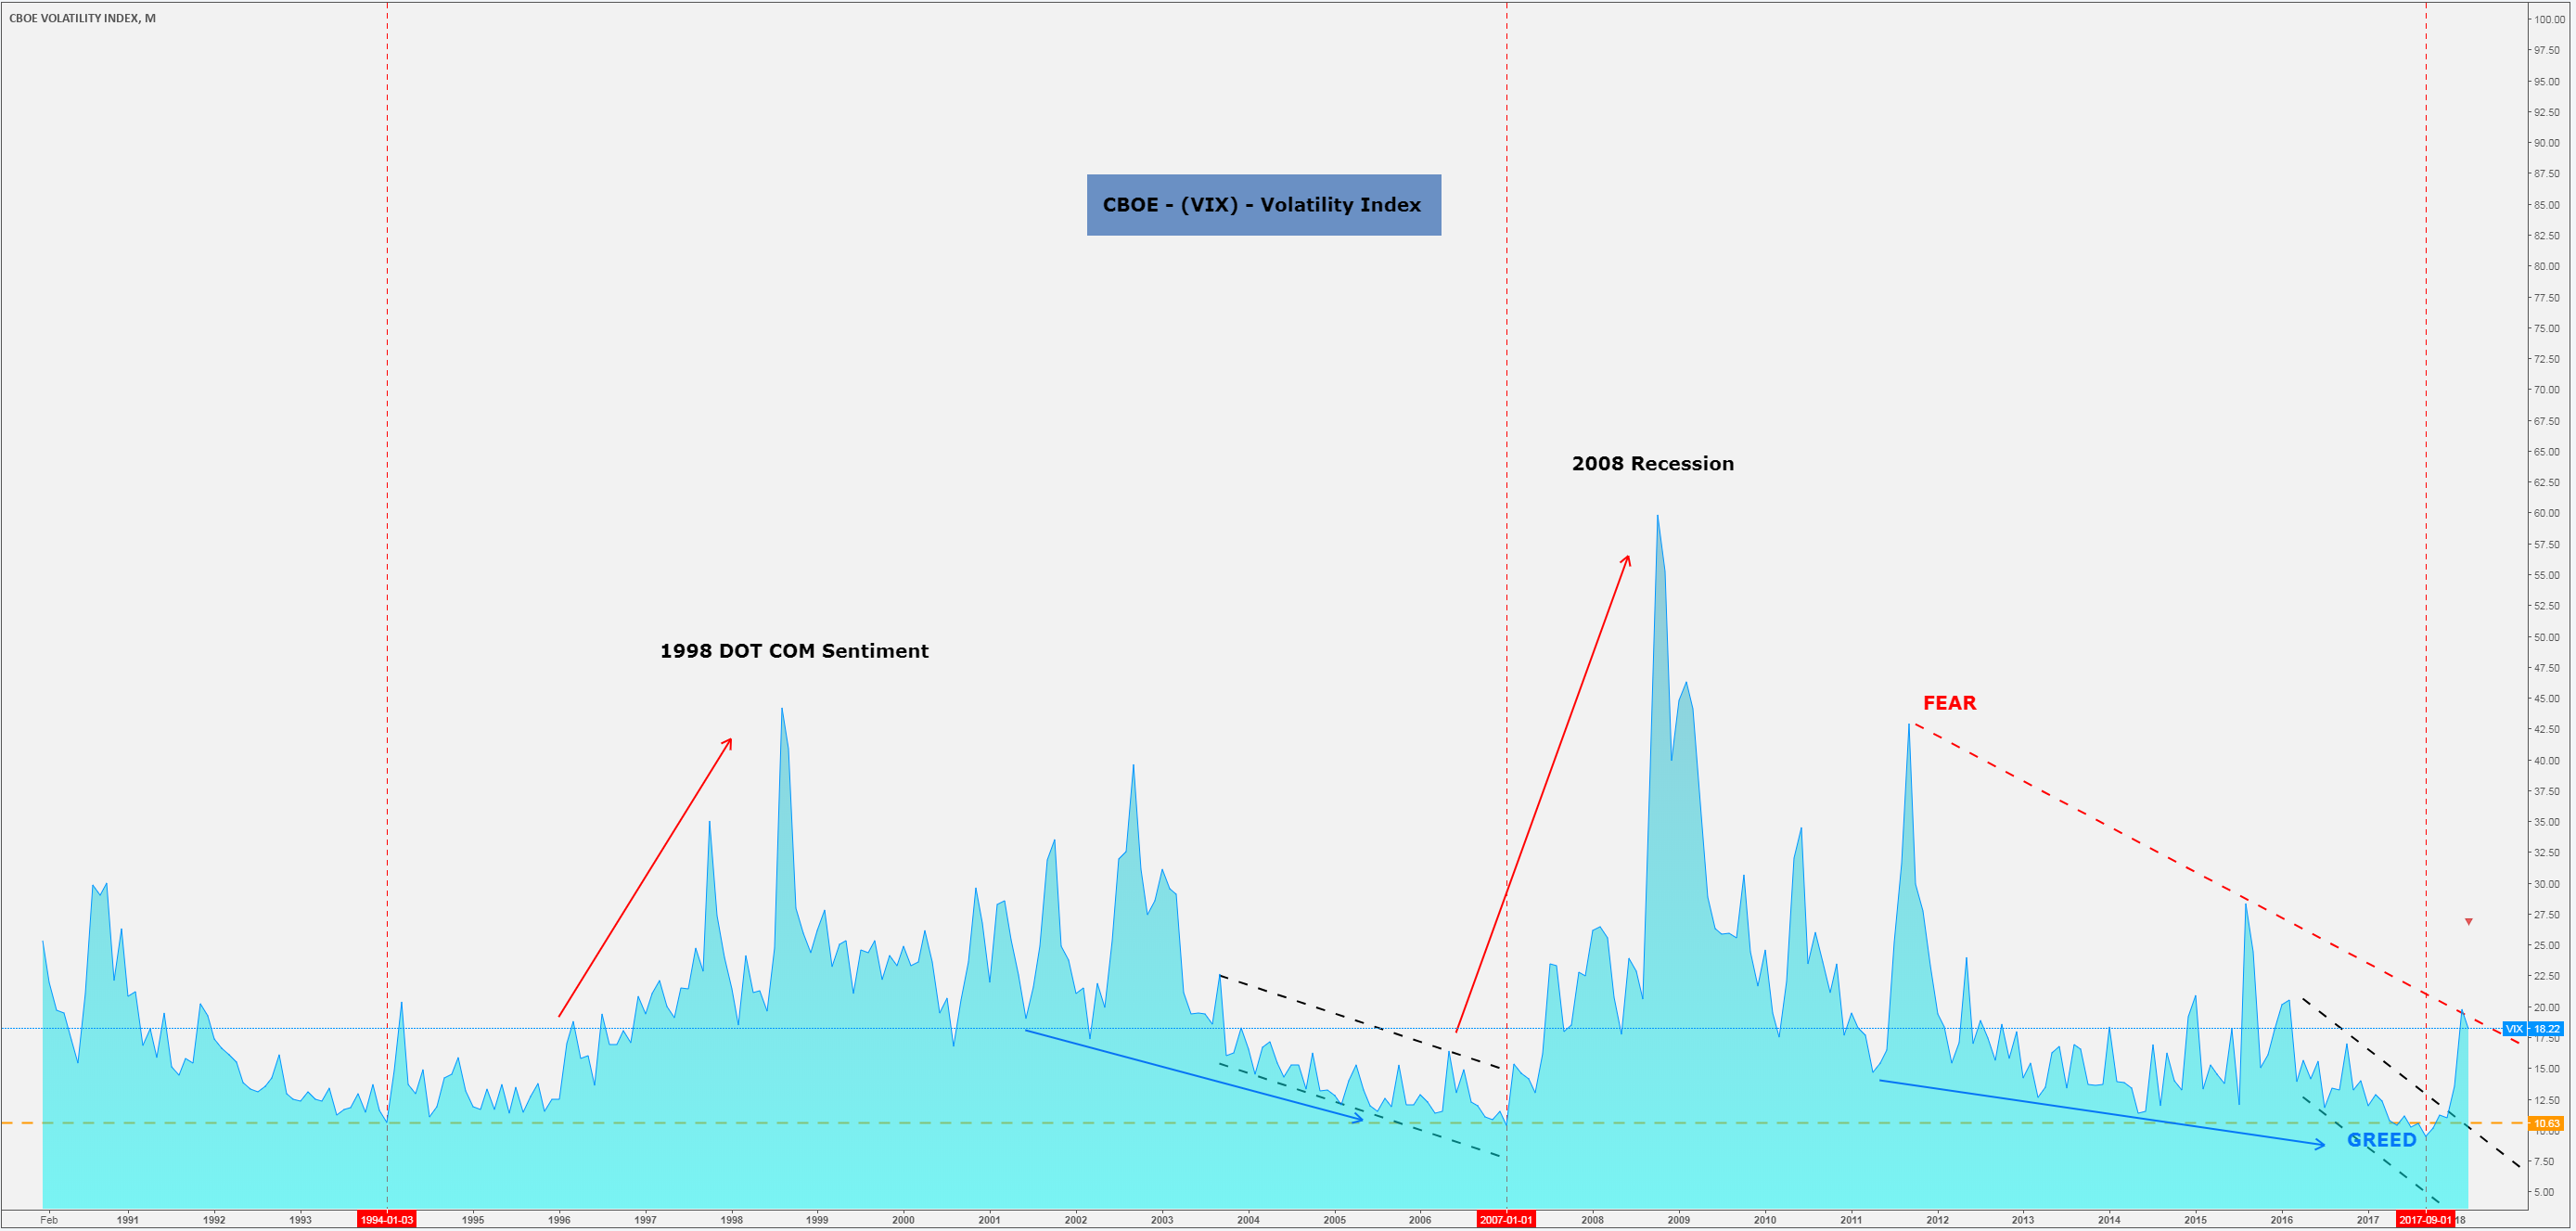
CBOE (VIX) is a Volatility Index and is also known as the Fear & Green indicator. It is used by traders as measurement tool in order to determine when the next significant swing would occur. When VIX is rising, the market keeps going bearish, making the fear effect possible.
From the VIX chart below, it can be clearly seen that volatility is back, and with it comes the fear effect.
VIX – Monthly Chart:
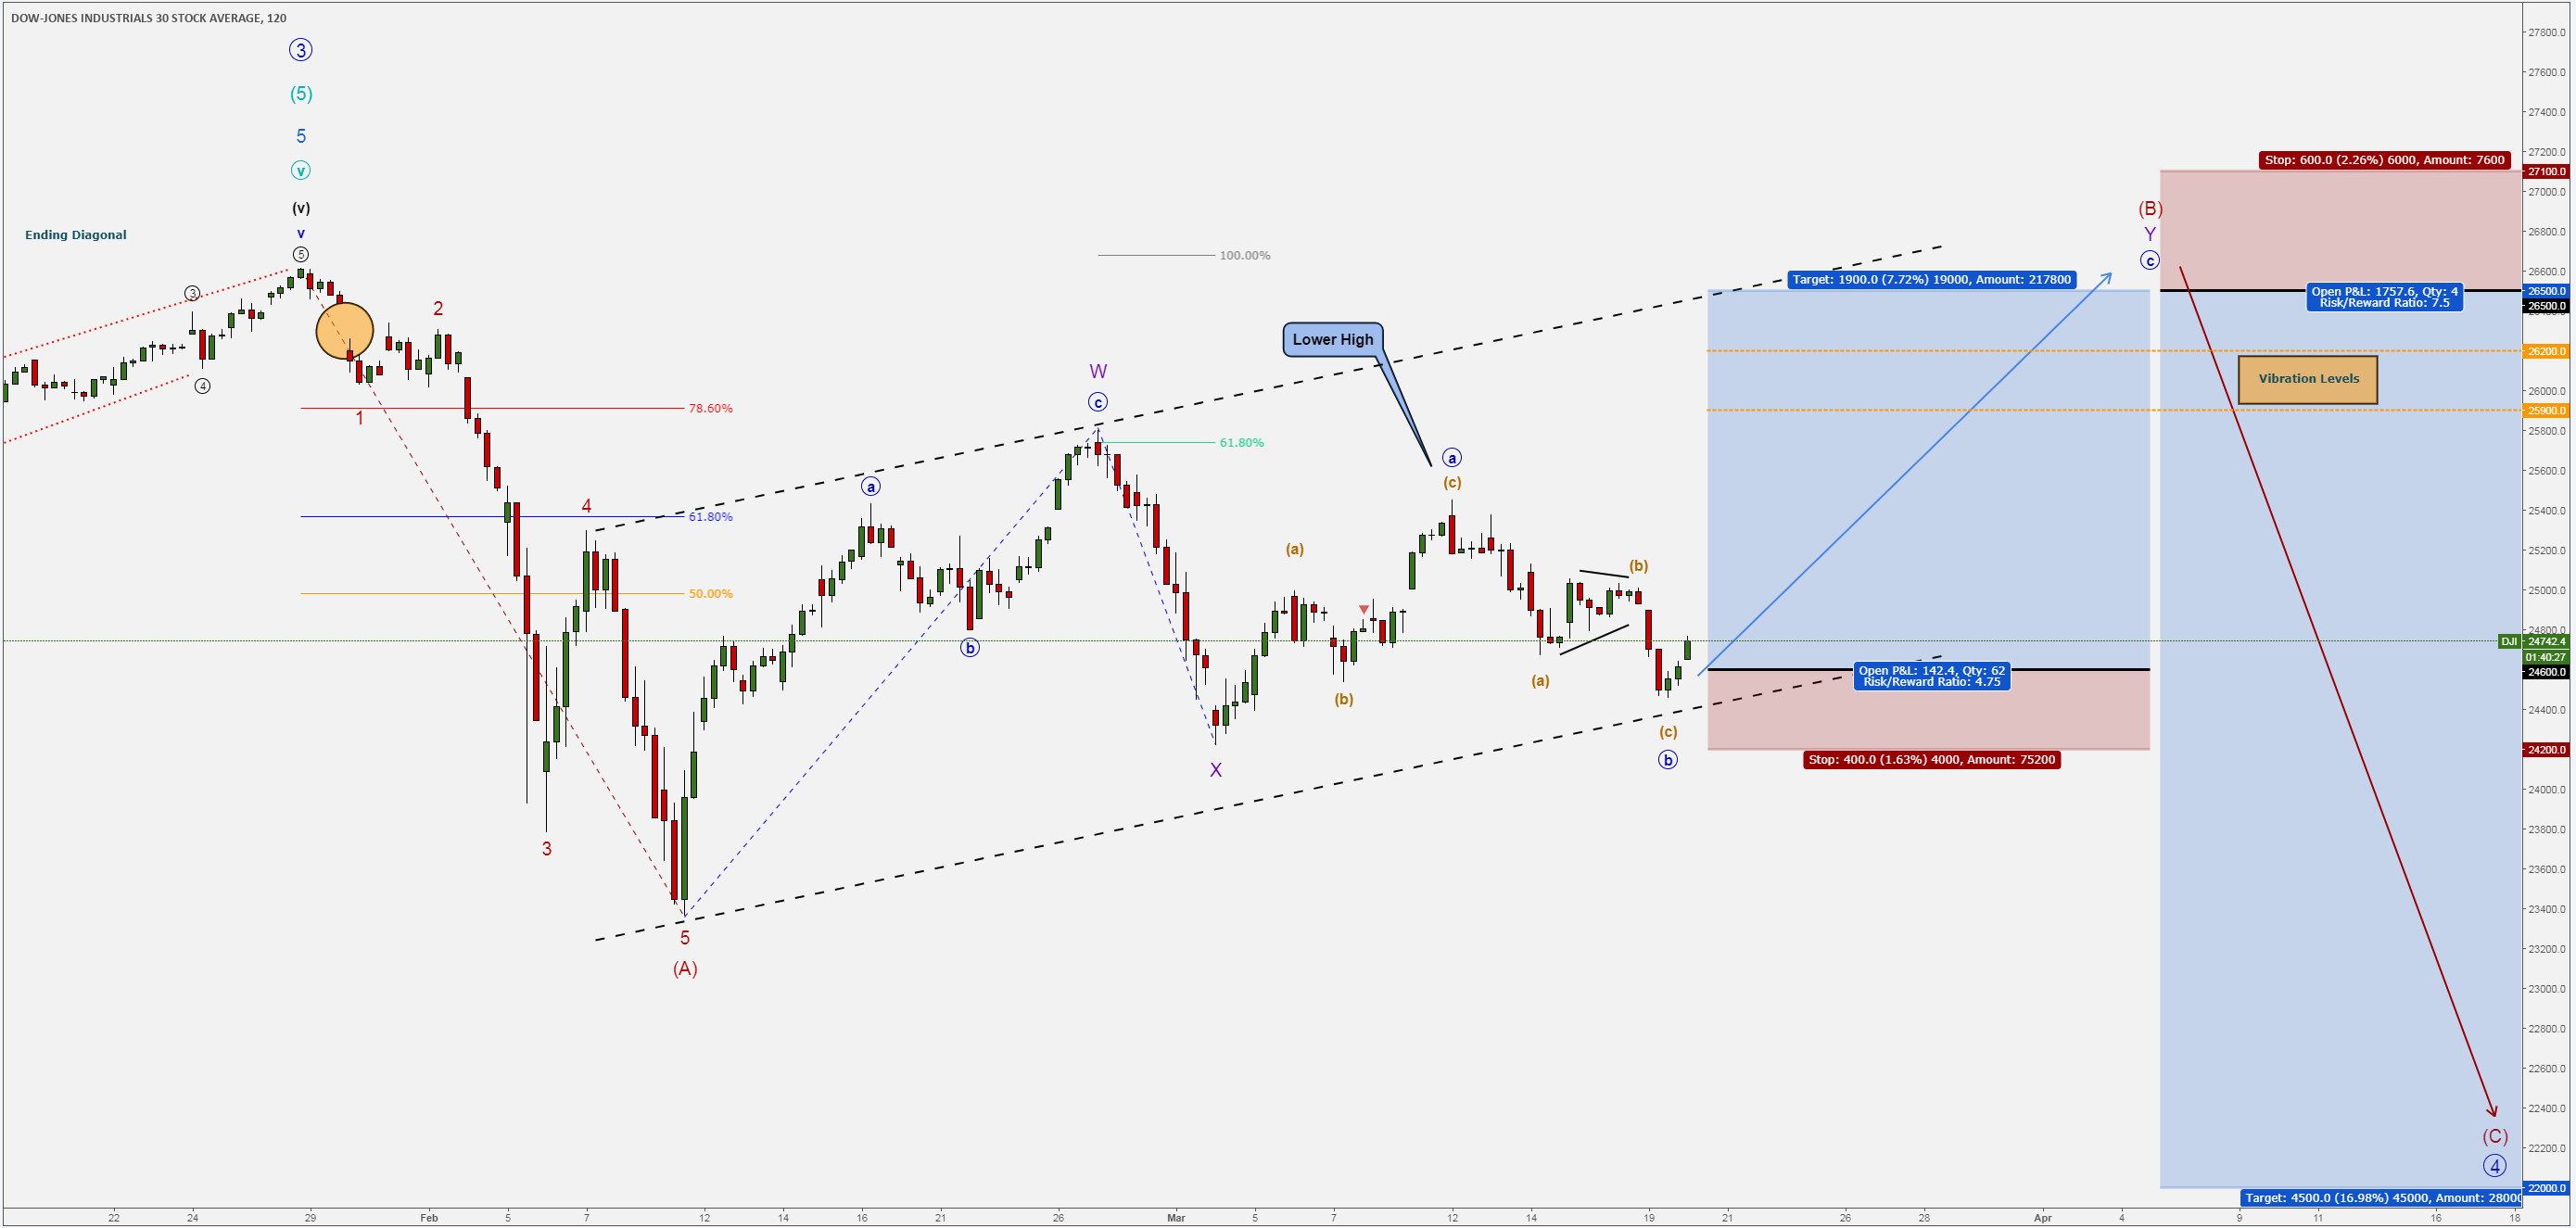
The Indices sell-off mentioned above would be considered, from a technical point of view, the first leg of the bigger Corrective Structure.
Sell-off paused on the 9th Feb 2018, and ever since then, Indices have been slowly grinding upwards, showing limitations and mostly sideways movements.
By looking at the VIX chart, one would notice that since Sep 2017, VIX broke on the up-side and caused uncertainty. Currently, it looks as if VIX could be preparing for another spike.
 FOMC Fundamentals & Speculation
Looking towards tomorrow’s FOMC press conference and rate decision, headlines and the overall feeling is that the FED will most likely increase interest rates, from 1.50% towards 1.75% benchmark points.
The key point which investors will be closely monitoring will be whether or not the FED will accelerate the pace of rate hikes this year. Three rate hikes are already priced in and at this stage, the FED may only surprise the market if more than three will be in play in 2018. This can only come from Jerome Powell’s comments during the Press Conference.
More aggressive rate increases would likely slow the economy and make stocks less appealing.
Technically, the charts are stating that the FED would remain on path with their projected and gradual interest rates rises.
Indices & Elliott Wave Analysis
Dow Jones 2H Chart:
 SNP500 2H Chart:
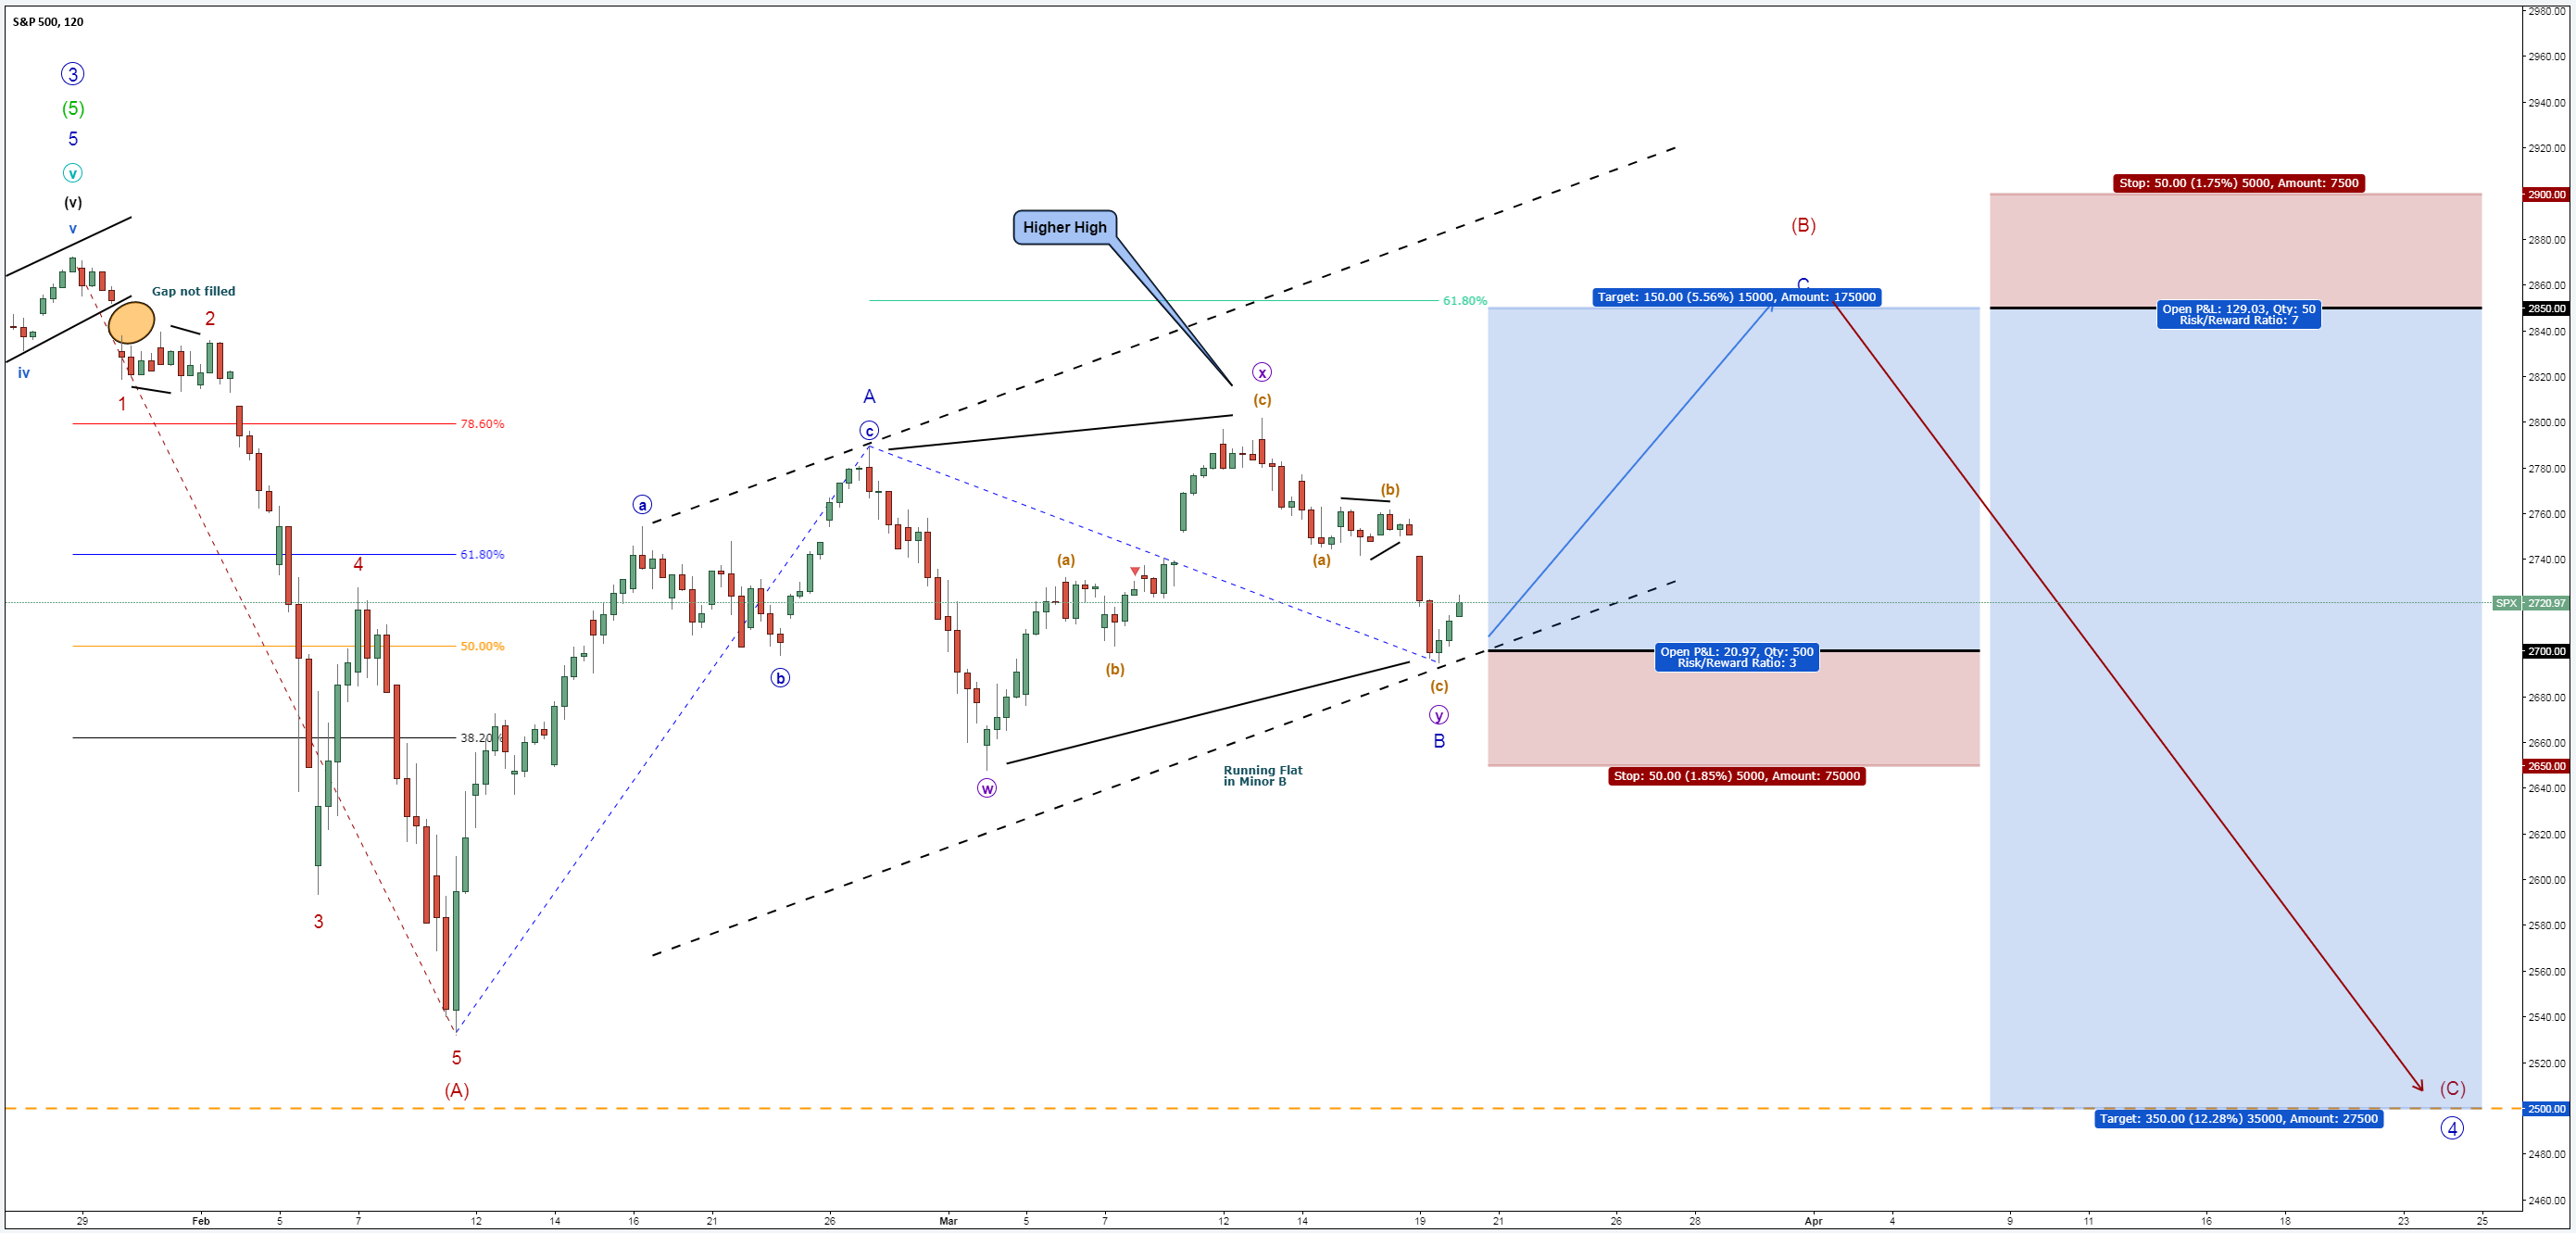
Nasdaq100 Daily Chart: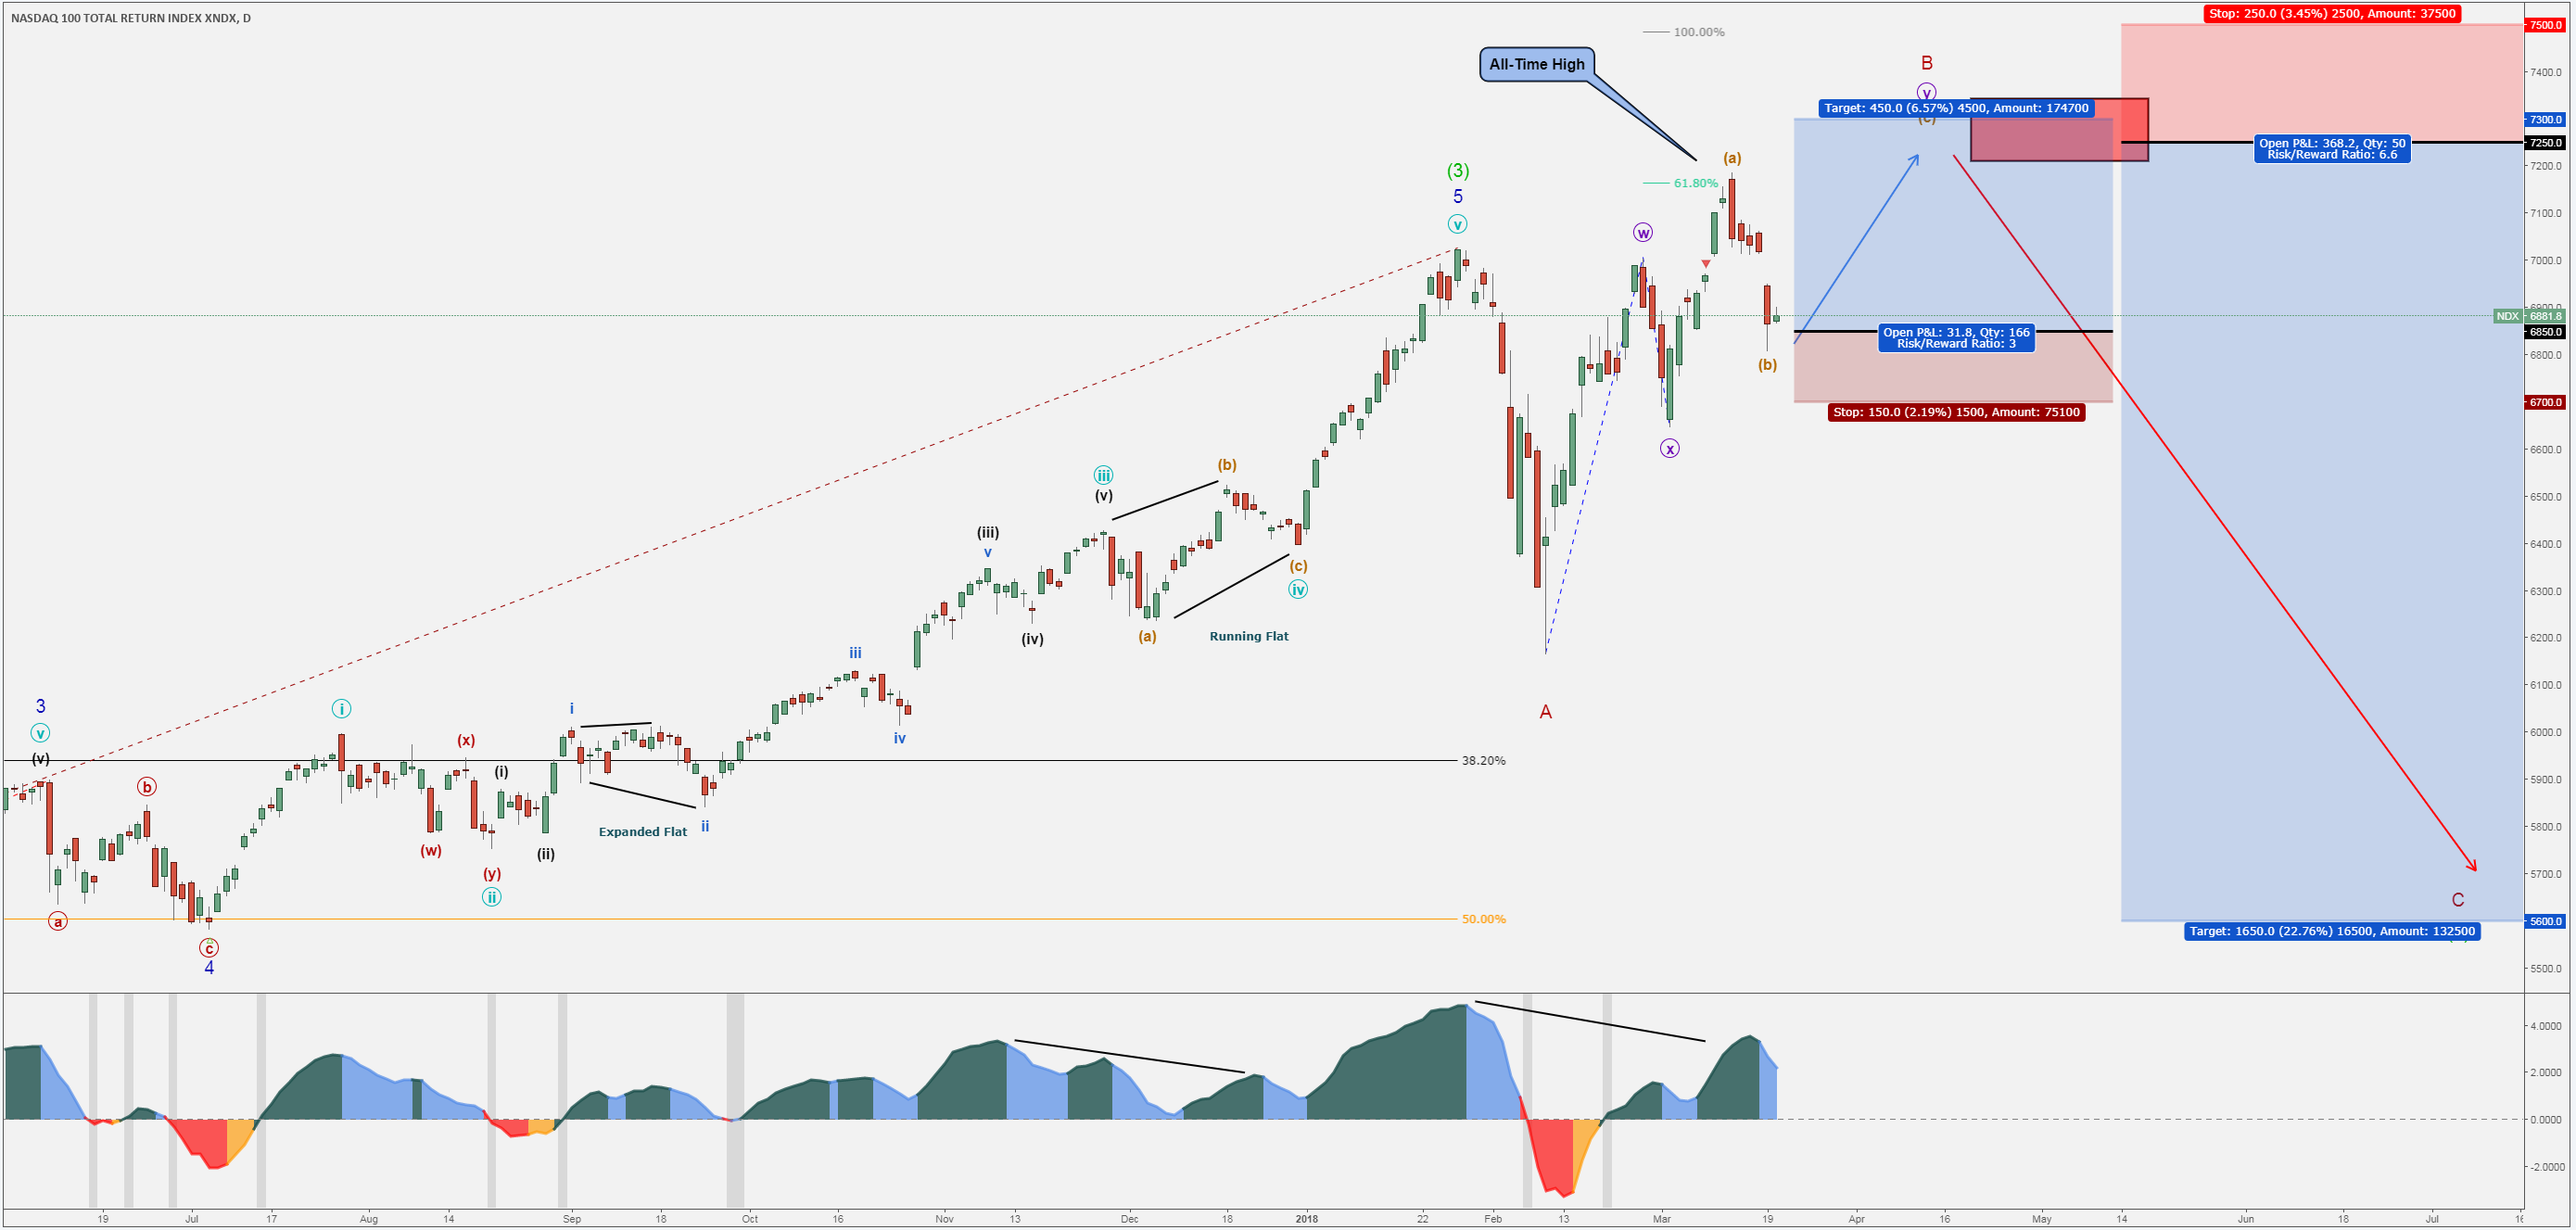
DAX30 2H Chart:
CAC40 4H Chart: Indices are pointing towards a possible bullish wave before the primary corrective structure would complete with another set of volatility fears.
*The present analysis is to be treated as simple market commentary and not as an investment advice or as a solicitation to trade. Please be aware of the real risk involved by trading financial instruments.
Many pips ahead.
Sunset Market Commentary
Markets
Core bonds lost some ground today with US Treasuries again underperforming German Bunds ahead of tomorrow's FOMC meeting. Last minute positioning suggests that (US) investors don't want to be wrong-footed by a potentially more hawkish Fed. Rising oil prices weighed as well. Stock markets stabilize after yesterday's heavy sell-off, but we don't find the rebound convincing. Disappointing German ZEW investor confidence also helps explain the Bund's resilience compared to the US Note future. The US yield curve shifts 1.5 bps to 2 bps higher across the curve with the US 2-yr yield reaching a new cycle high (highest level since 2008). Changes on the German yield curve range between +0.7 bps (2-yr) and +1.4 bps (10-yr). Peripheral yield spreads vs Germany narrow 3 to 6 bps (Italy).
Global FX markets faced plenty of (potentially conflicting) event risk (eg: the tech correction, rumours that US president Trump will announce import tariffs on Chinese goods). Markets also had to digest the avalanche of recent ECB comments/rumours while at the same time looking forward to tomorrow's Fed decision. The trade war issue is potentially USD negative, but doesn't affect the US currency too much for now. The euro rebounded yesterday as ECB officials downplayed recent dovish comments. The focus of FX traders turned again to the Fed today. Interest rate differentials widened again in favour of the dollar. The market remains divided whether Fed governors will signal four rather than three rate hikes in 2018, but currency investors apparently don't want to be positioned short USD going into tomorrow's Fed meeting which includes the first press conference of Fed chairman Powell. Fear for a hawkish Fed prevails. EUR/USD reversed yesterday's ECB-inspired rise and trades again in the 1.2275 area. The price pattern of USD/JPY is less unequivocal, but the pair also trades well off the recent lows, near 106.50. For now, the dollar has the benefit of the doubt.
Sterling profited modestly from the EU/UK agreement on a transition period yesterday. The focus turned to UK price data today. Headline CPI declined slightly more than expected to 2.7% Y/Y from 3.0% Y/Y. The reaction of sterling was modest and even a bit inconclusive. Cable declined back to the 1.40 handle. EUR/GBP held a negative bias (due to EUR/USD weakness) and trades near 0.8770. We have the impression that the market concluded that the BoE will raise rates in May anyway, unless data sharply deteriorate. This is slightly GBP supportive. The 0.8690 support comes again on the radar. We assume that the BoE will have to be really hawkish to break that level.
News Headlines
British inflation was weaker than expected in February (2.7% Y/Y from 3.0% Y/Y vs 2.8% Y/Y expected) as the impact of the 2016 Brexit vote faded, easing some of the squeeze on households' spending power but doing little to change bets on a BoE rate rise in May. The figures also suggested less pressure in the pipeline for consumer prices. Manufacturers increased the prices they charged by the least since November 2016 as the cost of their raw materials -- many of them imported -- rose by 3.4%, way down from a peak annual increase of nearly 20% in January last year.
German ZEW investor sentiment slumped to its lowest level since September 2016 as concern intensified that Europe's largest economy could be hurt by a global trade war and a strengthening euro. The forward looking expectations indicator dropped from 17.8 to 5.1 while consensus only expected a setback to 13.0. The current situation index declined from 92.3 to 90.7 (vs 90.0 expected).
The latest discussions of the Joint Technical Committee of OPEC and non-OPEC nations in Vienna concluded that the oil market will re-balance between 2Q and 3Q as global inventories shrank further in February, people familiar with the matter say. Brent crude rose from $66/barrel to $67.30/barrel.
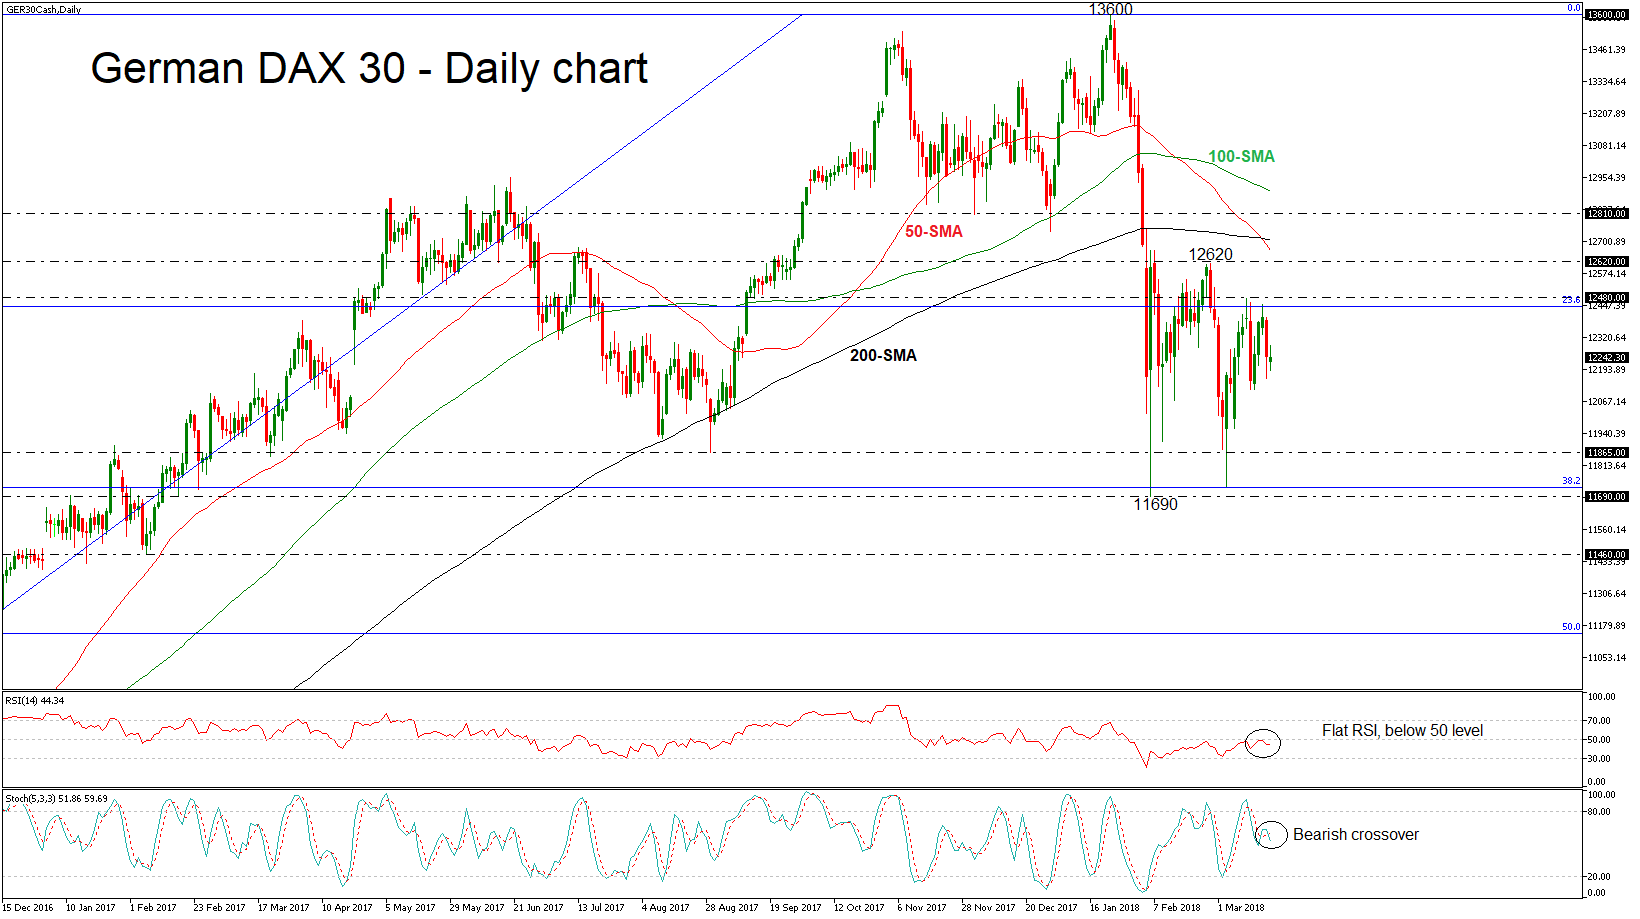
German DAX 30 Struggles Below 12480; Death Cross Within 50 and 200 SMAs Created
German DAX 30 has been moving below the 12480 strong resistance level after the strong sell-off at the end of the previous month. The critical death cross between the 50 and 200 medium-term simple moving averages (SMAs) indicating significant selling interest.
Looking at the daily timeframe, the RSI indicator holds below the 50 level and is flattening. However, the stochastic oscillator posted a downward crossover within the %K and %D while is approaching the 20 level.
Further losses should see the August low of 11865 acting as a major support before hitting the 38.2% Fibonacci retracement level slightly above 11690 of the upleg from 8695.50 to 13600.
In the event of an upside reversal, the 23.6% Fibonacci mark just below the 12480 resistance level could act as a barrier before being able to re-challenge the 12620 barrier. If there is a break above this level, the price could meet the death cross near 12716 at the time of writing. Further gains could lead the way towards the 12810 price level.
Japanese Yen Dips as US Dollar Posts Broad Gains
The Japanese yen is lower in Monday trade. In the North American session, USD/JPY is trading at 106.44, up 0.32% on the day. It’s very quiet on the release front, with no US events. In Japan, banks and stock markets are closed for Vernal Equinox Day. On Wednesday, the US releases Current Account and Existing Home Sales. All eyes will be on the Federal Reserve, which is expected to raise interest rates for the first time in 2018.
There were no surprises from the Bank of Japan, which published its summary of opinions from the March meeting on Monday. Members voted 8-1 to maintain its aggressive monetary easing program. Given that inflation is around 1%, well below the target of just below 2%, there are no plans for normalization in the near future. The summary was decidedly dovish, with members stating that if there was an increased risk of a delay in reaching the inflation target, additional easing would be needed. There have been concerns that the current framework is unsustainable, but until inflation levels move higher, it’s a safe bet that any changes to monetary policy will be mere tweaks, which are unlikely to shake up the markets.
The Federal Reserve is poised to raise interest rates on Wednesday, which would mark the first hike of 2018. According to the CME Group, the odds of a quarter-point raise stand at an impressive 94 percent. What can we expect from the Fed during the year? The current Fed projection remains at three hikes, but a robust US economy has raised speculation that the Fed could accelerate the pace to four hikes, which would be good news for the US dollar. Investors will be keeping a close eye on key US data, especially upcoming inflation indicators. If these numbers improve, we’re likely to see four rate hikes in 2018.
GBP/USD Mid-Day Outlook
Daily Pivots: (S1) 1.3927; (P) 1.4008; (R1) 1.4103; More....
GBP/USD's retreat suggests temporary topping at 1.4087. Intraday bias is turned neutral first. Another rise is expected as long as 1.3888 minor support holds. Correction from 1.4345 could have completed at 1.3711 already. Above 1.4087 will target 1.4144 resistance first. Firm break there should confirm this bullish view and target 1.4345 and above. On the downside, however, break of 1.3888 minor support will dampen this bullish view. Intraday bias would be turned back to the downside to extend the decline from 1.4345 through 1.3711 instead.
In the bigger picture, as long as 1.3038 support holds, medium term outlook in GBP/USD will remains bullish. Rise from 1.1946 is at least correcting the long term down from 2007 high at 2.1161. Further rally would be seen back to 38.2% retracement of 2.1161 (2007 high) to 1.1946 (2016 low) at 1.5466. However, GBP/USD fails to sustain above 55 month EMA (now at 1.4259) so far. Break of 1.3038 support, will suggest that rise from 1.1946 has completed and will turn outlook bearish for retesting this low.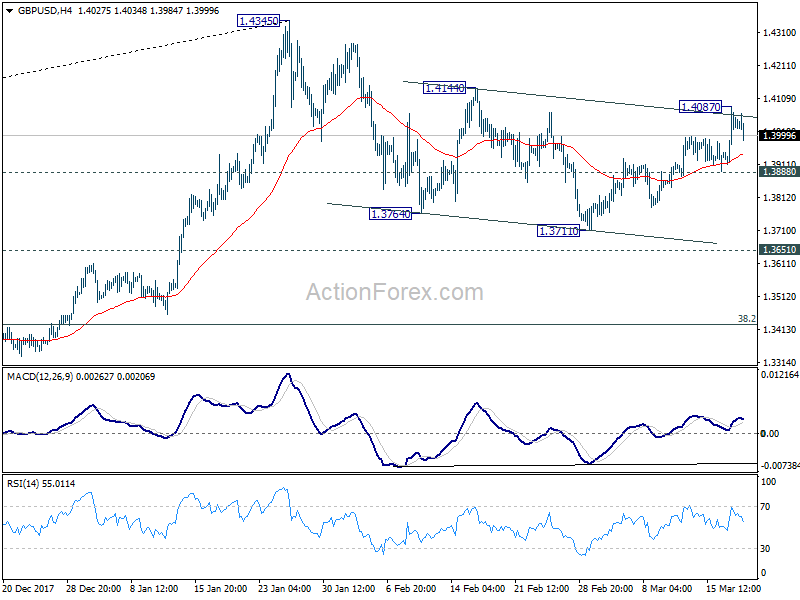
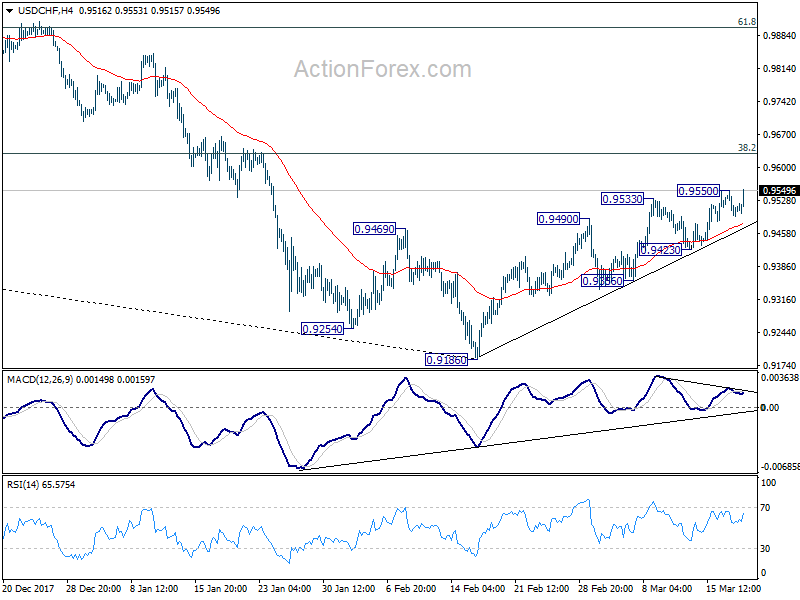
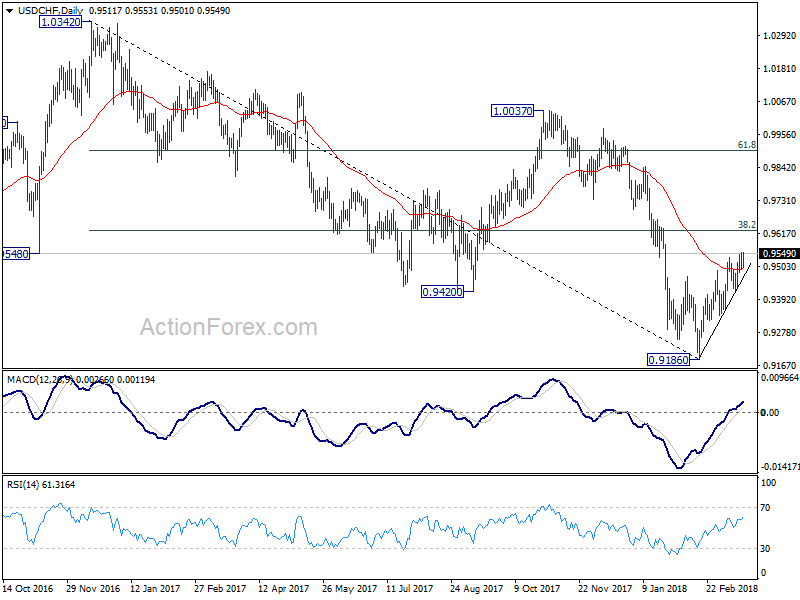
USD/CHF Mid-Day Outlook
Daily Pivots: (S1) 0.9486; (P) 0.9518; (R1) 0.9543; More...
USD/CHF's rise resumed after brief retreat. Intraday bias is back on the upside. Rebound from 0.9186 is targeting 0.9626 fibonacci level. Considering bearish divergence condition in 4 hour MACD, we'd be cautious on strong resistance from 0.9626 to limit upside. Nonetheless, sustained break of 0.9626 will carry larger bullish implications. On the downside, break of 0.9423 will indicate completion of the rebound from 0.9186. And intraday bias would then be turned back to the downside for 0.9356 support and below.
In the bigger picture, fall from 1.0342 is seen as a medium term down trend. Current development is raising the chance that it is completed. But there is no confirmation yet. Focus will now be back on 38.2% retracement of 1.0342 (2016 high) to 0.9186 (2018 low) at 0.9626. Sustained break there will add much credence to the case of trend reversal and target 61.8% retracement at 0.9900 and above. However, rejection from 0.9626 will maintain medium term bearishness for another low below 0.9186.
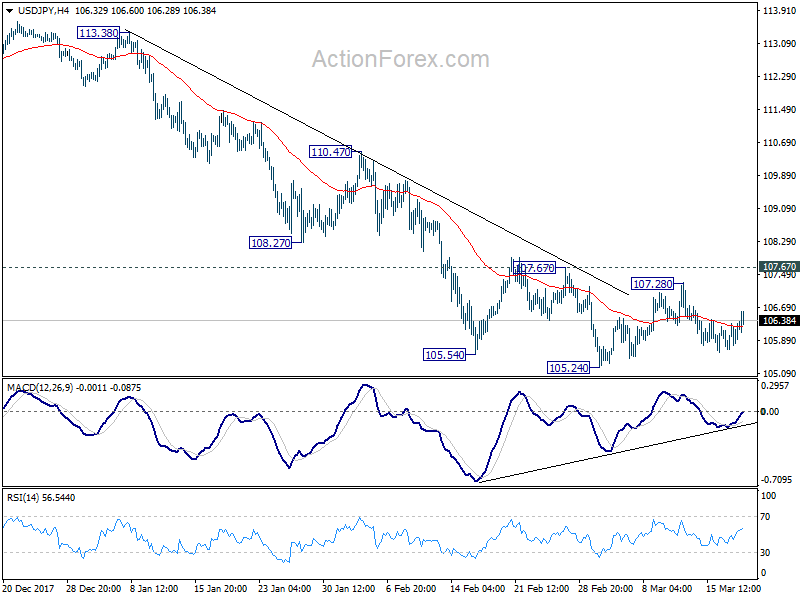
USD/JPY Mid-Day Outlook
Daily Pivots: (S1) 105.74; (P) 106.02; (R1) 106.37; More...
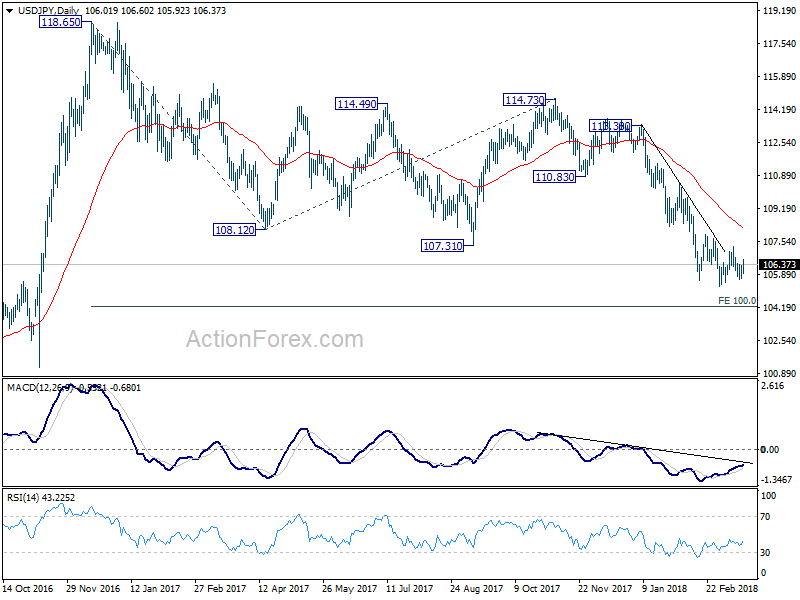
Consolidation from 105.24 is still extending between 105.24 and 107.67. Intraday bias in USD/JPY remains neutral. Near term outlook stays mildly bearish with 107.67 resistance intact. On the downside, break of 105.24 will resume larger decline from 118.65 and target 100% projection of 118.65 to 108.12 from 114.73 at 104.20 next. On the upside, firm break of 107.67 resistance will indicate near term reversal, on bullish convergence condition in 4 hour MACD. In such case, outlook will be turned bullish for 110.47 resistance next.
In the bigger picture, current development argues that the corrective pattern from 118.65 is extending. The solid break of 61.8% retracement of 98.97 to 118.65 at 106.48 now suggests that the pattern from 125.85 high is possibly extending. Deeper fall could be seen through 98.97 key support (2016 low). This bearish case will now be favored as long as 110.47 resistance holds.