
Sample Category Title
EUR/CHF Stabilizing
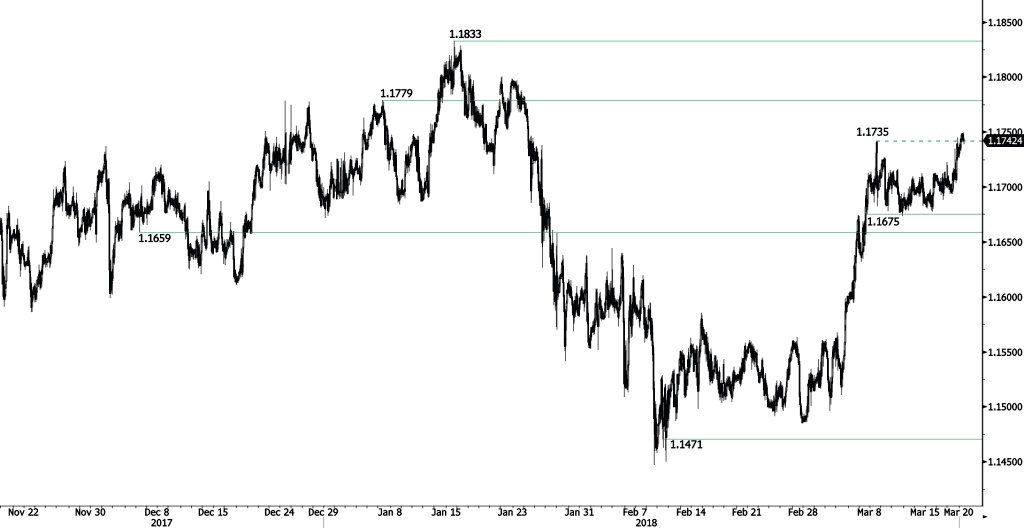
EUR/CHF is starting a consolidation phase following recent rise above hourly resistance at 1.1735 (08/03/2018 high). Hourly support and resistance are now given at 1.1675 (07/03/2018 low) and 1.1779 (05/01/2018 high). The shortterm technical structure suggests short-term sideways trading moves.
In the longer term, the technical structure has reversed. Strong resistance is given at 1.20 (level before the unpeg). Yet, the ECB's slowing QE program is likely to cause buying pressures on the euro, which should weigh in favour of the EUR/CHF. Support can be found at 1.0234 (20/04/2015 low)
EUR/GBP Slight Increase
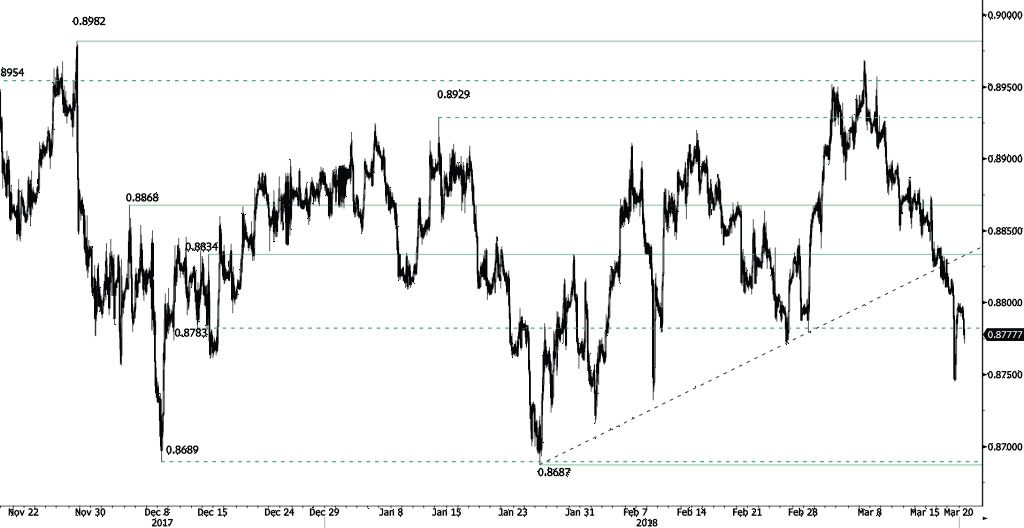
EUR/GBP bearish consolidation phase pauses following recent collapse at 0.8745. The pair is starting a recovery phase at the 0.8770 range and is expected to head along 0.8790. Hourly support and resistance are given at 0.8687 (25/01/2018 low) and 0.8834 (14/12/2017 high). The technical structure suggests short-term increase.
In the long-term, the pair has largely recovered from 2015 lows. The technical structure suggests further upside pressure. Strong resistance can be found at 0.9500 (psychological level) while support remains at 0.8304 (05/12/2016 low). The pair is trading above its 200 DMA.
AUD/USD Renewed Bearish Pressures
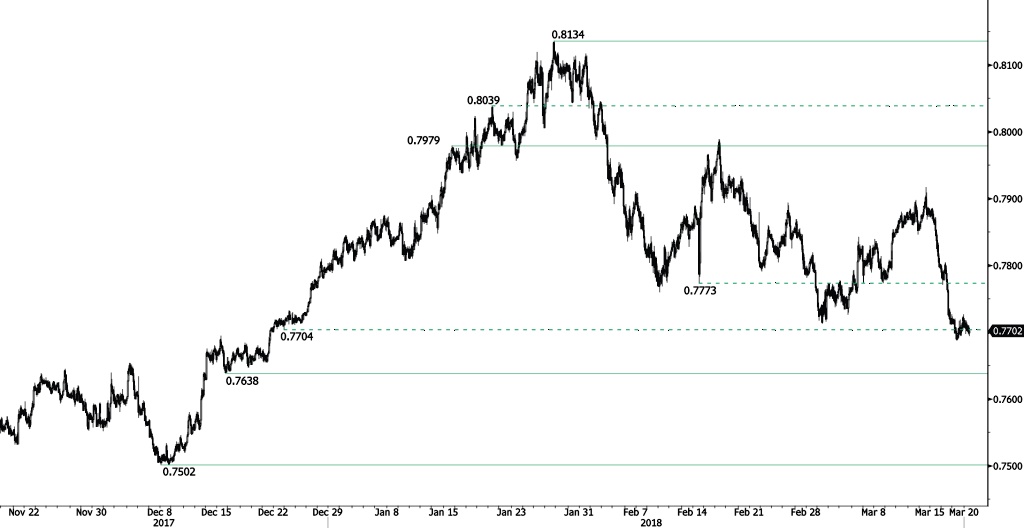
AUD/USD continues its decline following its slight increase at 0.7726. The pair is approaching hourly support at 0.7638 (15/12/2017 low). Hourly resistance at 0.7979 (15/01/2018 high) is distanced. The technical structure suggests continued short-term downward moves.
In the long-term, the upward trend slows down after failing to reach key resistance at 0.8164 (14/05/2015 low). Key support stands at 0.6009 (31/10/2008 low). A break of the key resistance at 0.8164 (14/05/2015 high) is needed to invalidate our long-term bearish view.
USD/CAD Slight Increase
USD/CAD is slightly increasing following recent rise at 1.3125, heading along the 1.31 range. Hourly support and resistance are given at 1.2805 (12/03/2018 low) and 1.3308 (23/06/2017 high). The short-term technical structure suggests short-term increase.
In the longer term, the pair is trading between resistance point at 1.3805 (05/05/2017 high) and support at 1.2128 (18/06/2015 low). Strong resistance is given at 1.4690 (22/01/2016 high). The pair is likely to head lower. The pairs is trading above its 200 DMA.
USD/CHF Trading Sideways
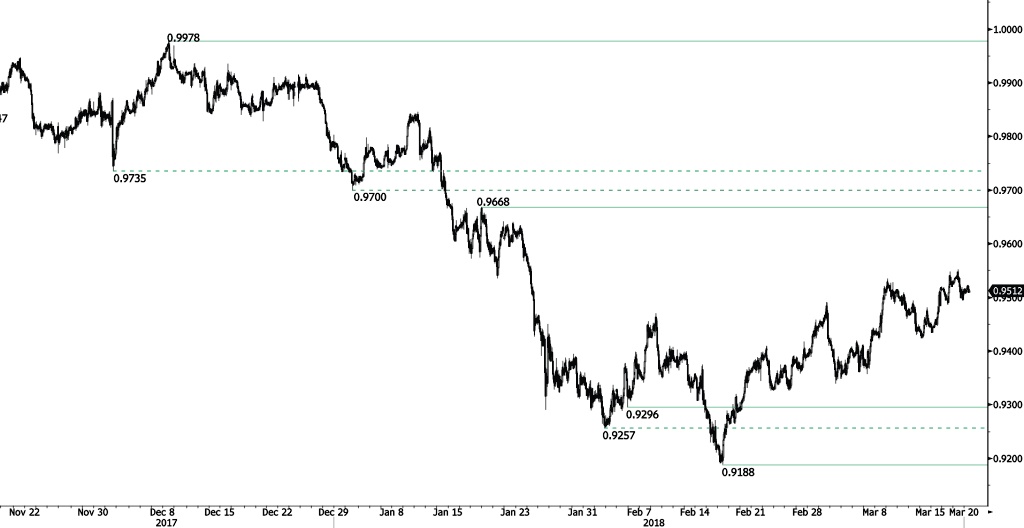
USD/CHF is starting a consolidation phase along the 0.95 range following recent rise at 0.9552. The pair is currently contained between hourly support and resistance at 0.9296 (05/02/2018 low) and 0.9668 (17/01/2018 high). The technical structure suggests short-term sideway moves.
In the long-term, the pair is still trading in range since 2011 despite some turmoil when the SNB unpegged the CHF. Key support lies at 0.9072 (07/05/2015 low) while resistance at 1.0344 (15/12/2016 high) is distanced. The technical structure favours a long term bullish bias since the unpeg in January 2015.

Euro dips as German ZEW indicates “Economic Outlook Worsens Considerably”
Euro dips after much weaker than expected sentiment data. German ZEW economic sentiment dropped to 5.1 in March, down from 17.8, below expectation of 13.0. Current situation gauge dropped to 90.7, down from 92.3, above expectation of 90.0. Eurozone ZEW economic sentiment also dropped sharply to 13.4, down from 29.3, missed expectation of 28.1.
ZEW titled the release as "Economic Outlook Worsens Considerably" which is an indication of how bad things turned. ZEW President Professor Achim Wambach noted that "concerns over a US-led global trade conflict have made the experts more cautious in their prognoses. The strong euro is also hampering the economic outlook for Germany, a nation reliant on exports." But he added that "combined with the experts' continued positive assessment of the current situation, however, the outlook is still largely positive."
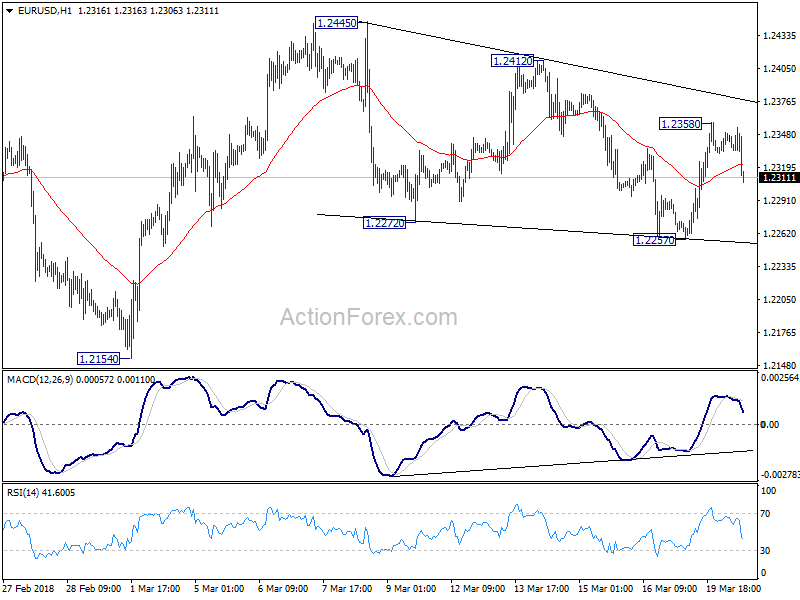
While EUR/USD drops notable after the release, there is no change in it's mildly bullish outlook. That is, price actions from 1.2445 are viewed as a corrective pattern. It should have completed with three waves down to 1.2257 already. Or in a worse scenario, it's extending as a five wave triangle pattern. In either case, further rise is expected soon through 1.2445 to real key resistance at 1.2555.
USD/JPY Heading Lower
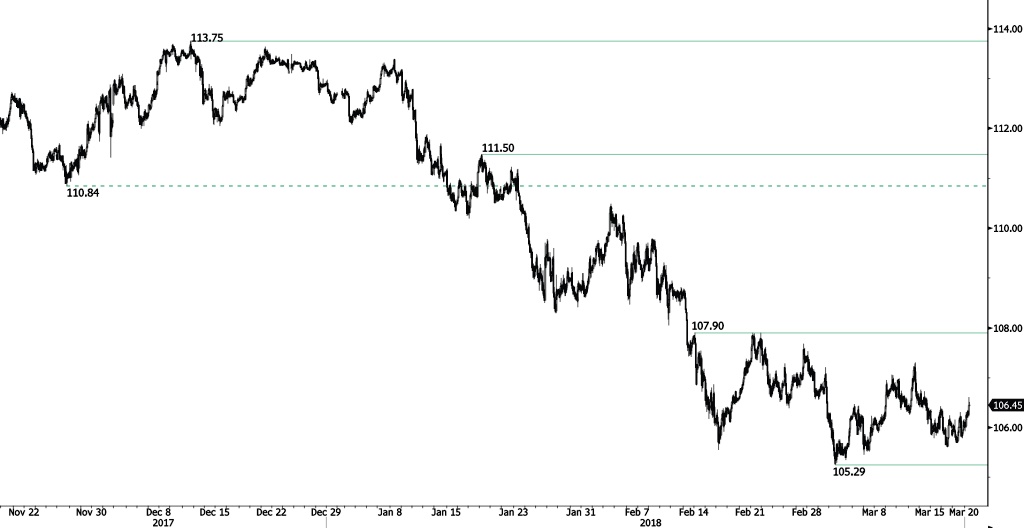
USD/JPY is giving signs of weakness, currently trading at the 106.40 range and expected to decline at 105.90. Hourly support and resistance are given at 105.29 (02/03/2018 low) and 107.90 (14/02/2018 high). The bearish pattern started in January 2018 is maintained. The short-term technical structure suggests short-term downward moves.
We favor a long-term bearish bias. Support remains at 101.20 (09/11/2016 low). A gradual rise toward the major resistance at 125.86 (05/06/2015 high) seems unlikely. Expected to decline further support at 101.20 (09/11/2016 low). The pair trades largely below its 200 DMA.
GBP/USD Approaching Resistance At 1.4151
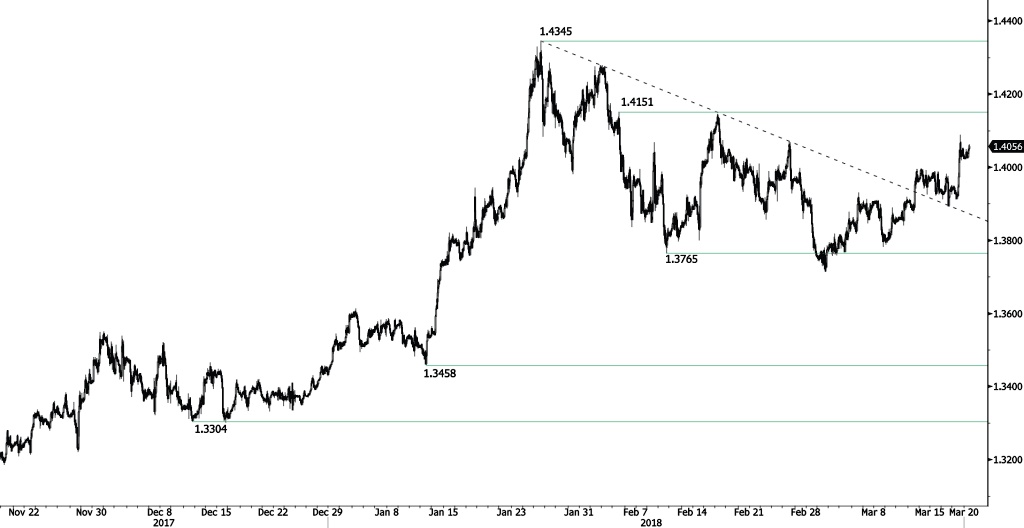
GBP/USD is trading higher, nearing hourly resistance at 1.4151 (05/02/2018 high) and reinforcing current bullish pattern. Hourly support remains at 1.3765 (09/02/2018 low). The technical structure suggests short-term increase.
The long-term technical pattern is reversing. The Brexit vote had paved the way for further decline but the pair is moving to 2016 highs. Long-term support and resistance are given at 1.1841 (07/10/2017 low) and 1.5018 (24/06/2016 high).
EUR/USD Consolidating At 1.23
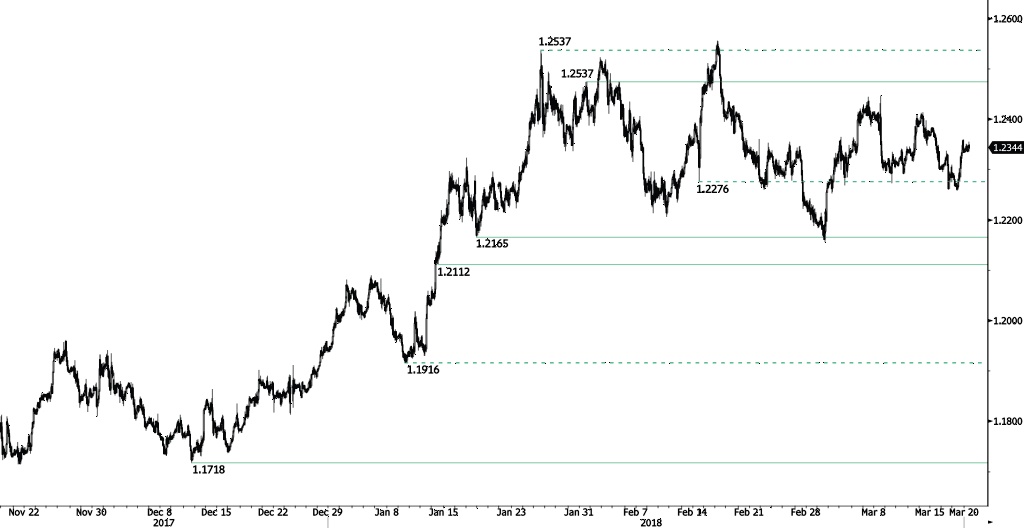
EUR/USD is stabilizing at the 1.2340 range following recent rise at 1.2359. Hourly support and resistance are given at 1.2165 (17/01/2018 low) and 1.2537 (31/01/2018 high). The technical structure suggests short-term sideways trading moves.
In the longer term, the momentum is turning largely positive. We favor a continued bullish bias. Key resistance is holding at 1.2886 (15/10/2014 high) while strong support lies at 1.1554 (08/11/2017 low).
Fed Widely Expected To Hike Rates, Forward Guidance To Move The Dollar
The Federal Reserve will be completing its two-day meeting on monetary policy on Wednesday, with an interest rate decision being made public at 1800 GMT. The world's most powerful central bank is widely anticipated to deliver a quarter percentage point interest rate hike, with market focus falling on the Bank's forward guidance. Moreover, this will be the first meeting that new Fed chief Jerome Powell will preside, something which perhaps renders his press conference following the decision all the more interesting, with market moving comments by Powell not to be ruled out.
The US central bank is expected to increase the Fed funds rate by 25 bps for the target rate to enter a band between 1.50-1.75%. Interest rate futures have fully priced in the move, with FOMC policymakers highly unlikely to take markets by surprise by deviating from this expectation.
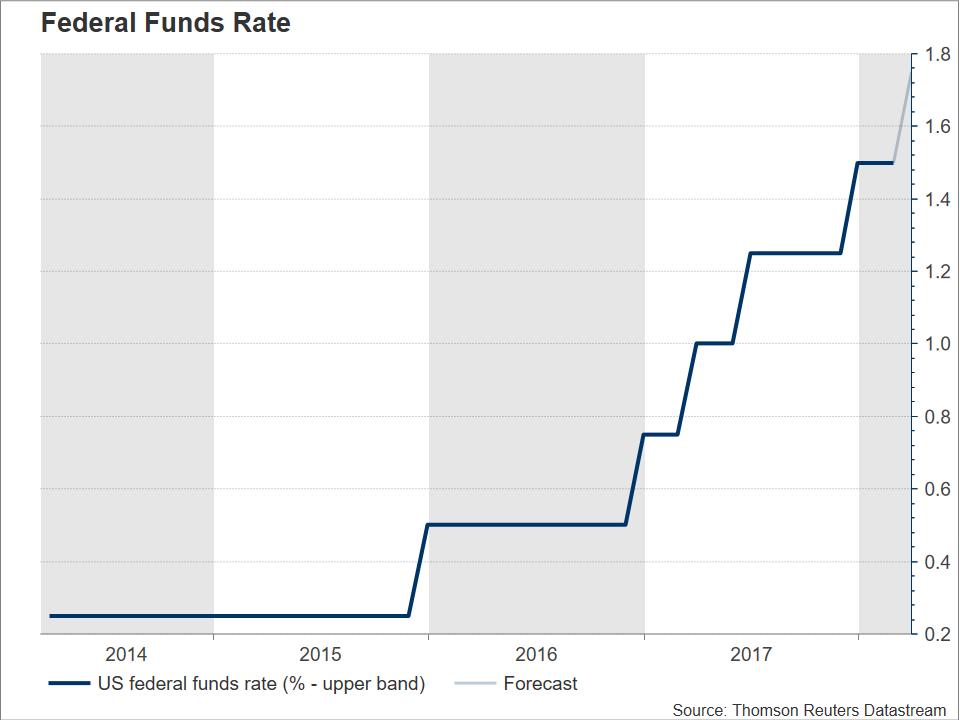
Given that an interest rate increase is pretty much seen as a done deal, all eyes will be on the Fed's forward guidance, perhaps most notably its dot plot which will reveal how FOMC members see interest rates evolving moving forward. The plot's previous release showed policymaker consensus for three quarter percentage point increases in 2018. Currently there's speculation in the markets that the FOMC will move towards four, including the one that is to be delivered on Wednesday that is. Is this justified though?
Some arguments against such signaling are the following: if the data throughout the rest of the year do not support a fourth hike and the Fed eventually ends up scaling back its expectations – that is in case Wednesday's dot plot indeed signals four 25 bps rate hikes in 2018 – the unintended market reaction is likely to be much more profound than if the Fed sticks to its current guidance and proceeds accordingly depending on economic releases. In other words, there seems to be much more to lose if the Fed signals four hikes and then reverts to three, than if it sticks to three and eventually ends up delivering four. Also, signaling four hikes and eventually delivering three will lend credence to those saying that the Fed tends to overpromise and in the end underdelivers. Such an outcome will constitute somewhat of a blow to the central bank's credibility, something which the new Fed chief will likely try to avoid.
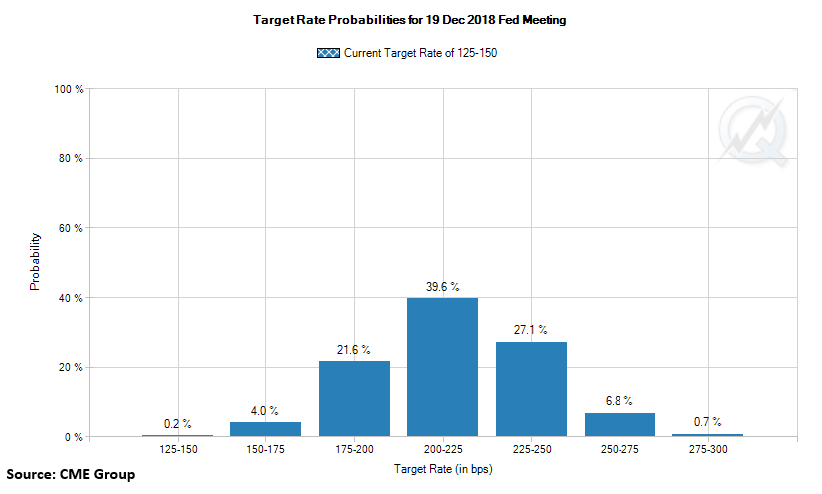
Still it is worthy of mention that several investment banks, including Goldman Sachs, expect the median projection to rise to four hikes in total for 2018 on Wednesday. Markets though have at the moment far from priced in a fourth interest rate increase during 2018 according to the CME Group's FedWatch Tool.
Elsewhere, the wording in the FOMC statement has its significance as well and can spur positioning on the dollar, as it is expected to reveal whether policymakers are worried about the recent misses in data such as retail sales which have led to downward revisions in Q1 GDP projections. Assuming the confidence Powell expressed in his testimony before Congress around three weeks ago is echoed by the majority of FOMC members – this was the catalyst behind the markets upgrading their projections in terms of Fed tightening and thus fully pricing in three interest rate hikes in 2018 – then the statement should also sound optimistic. Still, any concerns on the outlook for growth can exert downward pressure on the greenback; the opposite holds true as well.
Also of importance is Powell's press conference which is set to take place at 1830 GMT. His recent comments before Congress were dollar-positive. It remains to be seen whether he will provide another lift to the US currency on Wednesday. Overall it is highly likely that the dollar will be volatile around the time of the announcement and press conference as Fed meetings with press conferences, revised forecasts and a new dot plot occur only once a quarter and as such, are closely scrutinized by market participants searching for insights into the Fed's policy intentions.
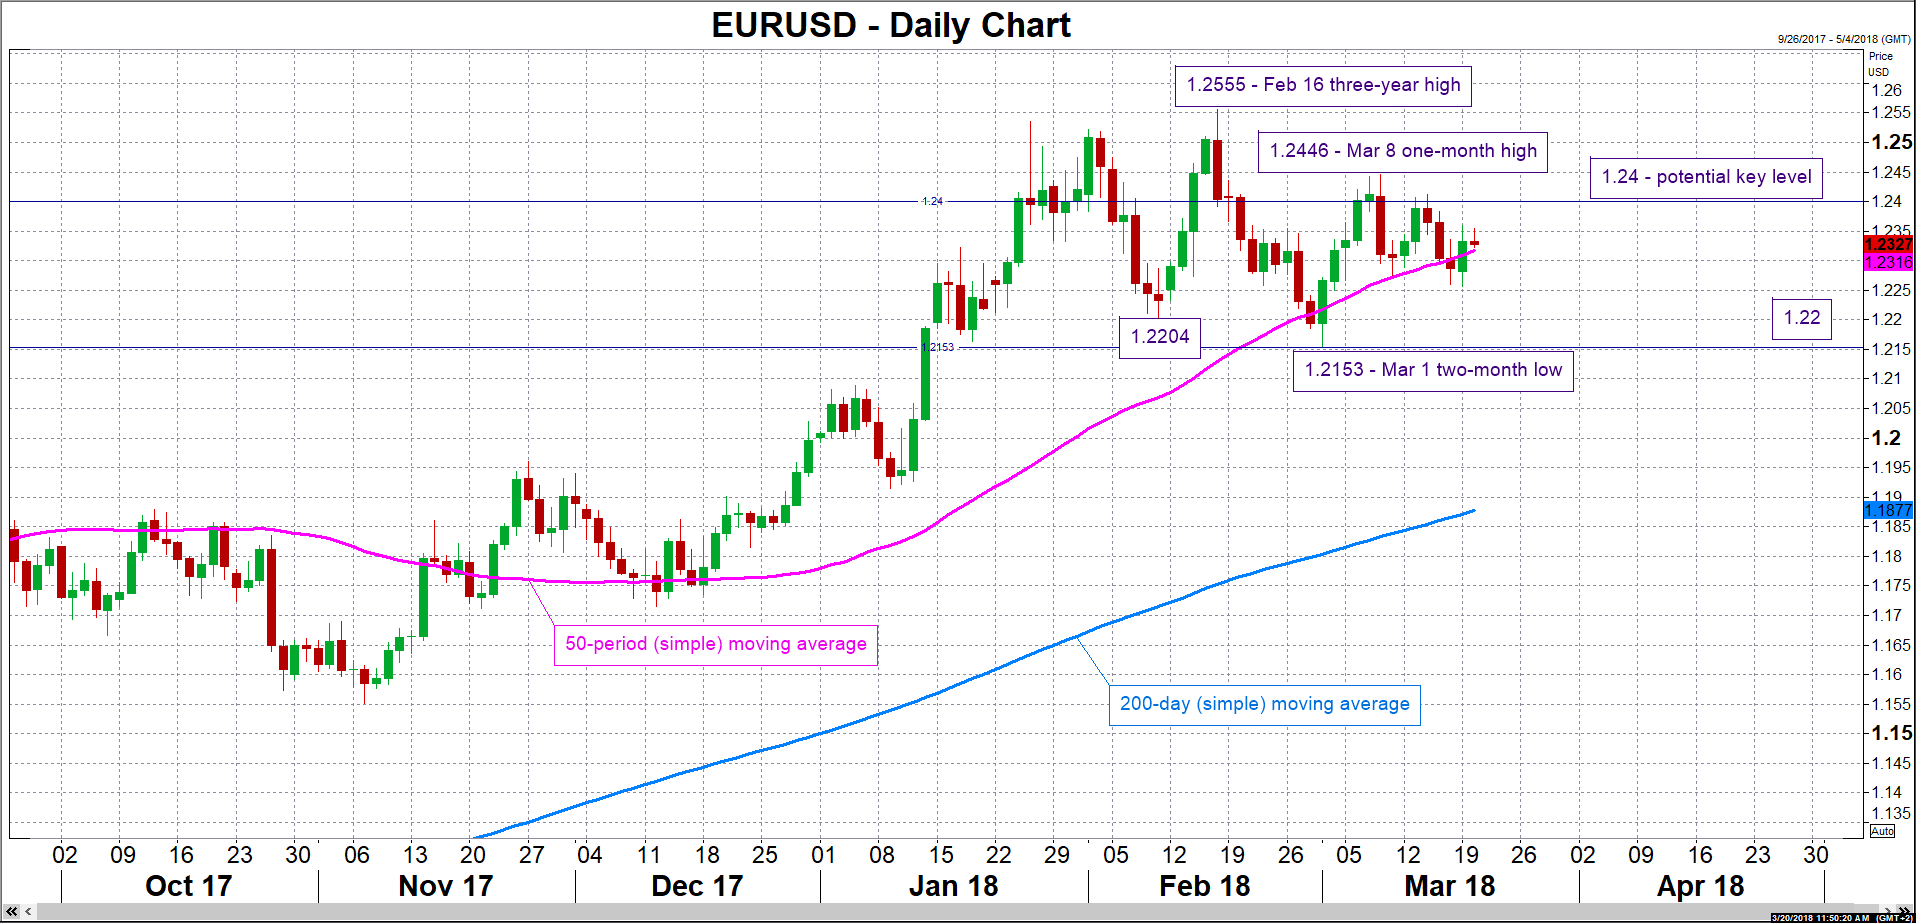
Upbeat views by Powell and Fed policymakers on the state of the US economy, in conjunction with a reiteration of the Bank's commitment to firmly remain on a path of policy normalization, are likely to lend some support to the dollar. Focusing on euro/dollar, the pair seems to be currently meeting a barrier to downside movements around the 50-day moving average line at 1.2316. A downside violation would turn the focus to the area around the 1.22 handle which was somewhat congested recently and also encapsulates a bottom from the recent past at 1.2204. Further below, additional support could come around 1.2153, this being a two-month low that was recorded on March 1.
Potential concerns about the economy or a mention of the lack of progress in the core PCE index – the Fed's preferred measure of inflation – on the other hand, could weaken the greenback. Resistance to upside moves in euro/dollar might come around the 1.24 level which, since late January, was often congested. Further above, the one-month high of 1.2446 from March 8 would be eyed before market attention starts to increasingly shift towards February 16's three-year high of 1.2555.
Finally, and moving back to the “fourth hike debate”, it is interesting that despite prospects of more Fed rate increases being theoretically dollar-supportive, at the moment there are other currency drivers at play that might act to the detriment of the dollar should such signaling take place, and forex market participants seem to be increasingly wary of these factors. For example, hawkish guidance could trigger a sustained selloff in US equity markets, which might be bearish for the dollar and the US economy and boost other currencies such as the safe-haven perceived yen. Reaction of certain dollar pairs in this case might deviate from what “conventional wisdom” dictates.