Sample Category Title
USD/CAD – Struggling Canadian Dollar Approaches 1.31, Soft Manufacturing Sales Expected
The Canadian dollar has posted slight losses in the Friday session. Currently, USD/CAD is trading at 1.3091, up 0.29% on the day. On the release front, there are key indicators on both sides of the border. Canada releases Manufacturing Sales, with the markets braced for a sharp decline of 0.8%. In the US, major indicators are also expected to miss expectations. Building Permits and Housing Starts are forecast to drop to 1.32 million and 1.29 million respectively. The markets are also bracing for a drop in UoM Consumer Sentiment, which is expected to slow to 99.2 points. Traders should be prepared for some movement from USD/CAD during the North American session.
It continues to be a rough week for the Canadian dollar, which has lost 2.0% against its US counterpart. USD/CAD is headed towards the 1.31 level, as the Canadian currency is at its lowest level since late June. If Canadian Manufacturing Sales misses expectations, the slide could continue. As a minor currency, the Canadian dollar is under strong pressure, as risk appetite has waned due to two major geo-political hotspots. First, relations between the UK and Russia have nosedived after a toxic attack in London aimed against a former Russian intelligence officer was poisoned, and the UK has laid the blame on the Kremlin. The May government has ordered the expulsion of 23 Russian diplomats, and Russia is sure to retaliate. As well, President Trump has slapped tariffs on steel, and this could trigger a response from the EU and China. Although Canada was exempted from the tariffs, this could prove temporary, and the threat of a global trade war is not good news for Canada. Added to this mix is rising uncertainty over the NAFTA agreement. The US is demanding far-reaching concessions from Canada and Mexico, and the protectionist Trump administration could decide to exit NAFTA, which has been a key driver of economic growth for Canada. With the Federal Reserve poised to raise interest rates next week for the first time this year, the fragile Canadian dollar is looking at more headwinds.
Technical Outlook: USDJPY Falls On Increasing Risk Aversion, May Violate 105 Support Before FOMC
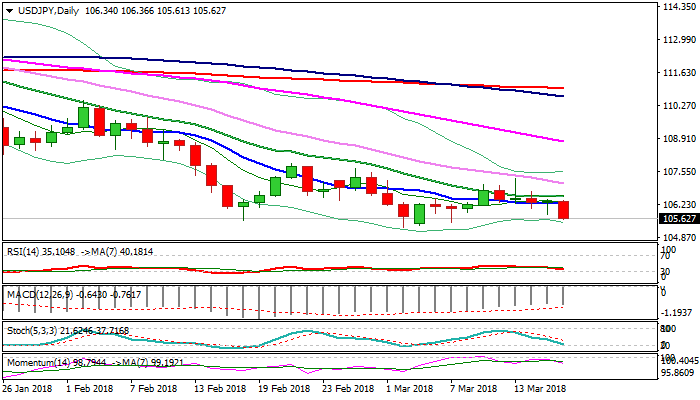
The pair fell sharply on Friday and hit new over one week low at 105.61, driven by risk aversion on the newest White House shake-up, as President Trump decided to replace his national security advisor.
Fresh weakness comes after yesterday's short-lived dip to 105.78, as renewed probe below 106 Fibo support triggered stops parked below Thursday's low.
Firm bearish setup of daily studies and growing negative sentiment around the greenback which increased safe-haven demand, keep the pair under strong pressure.
Bears eye key supports at 105.24/00 (02 Mar low/round-figure support) which might be violated before next week FOMC meeting.
A number of stops below 105 handle could be triggered on break and spark fresh acceleration lower. Fresh bears below 105 would look for Fibo projections at 104.48 and 102.73 and could extend towards psychological 100 support if Fed disappoints next week.
Falling thick hourly cloud (106.09/106.53) weighs and should limit corrective upticks.
Res: 105.78, 106.09, 106.37, 106.53
Sup:105.45, 105.24, 105.00, 104.48
USDJPY Strongly Bearish Below 105.20 Level
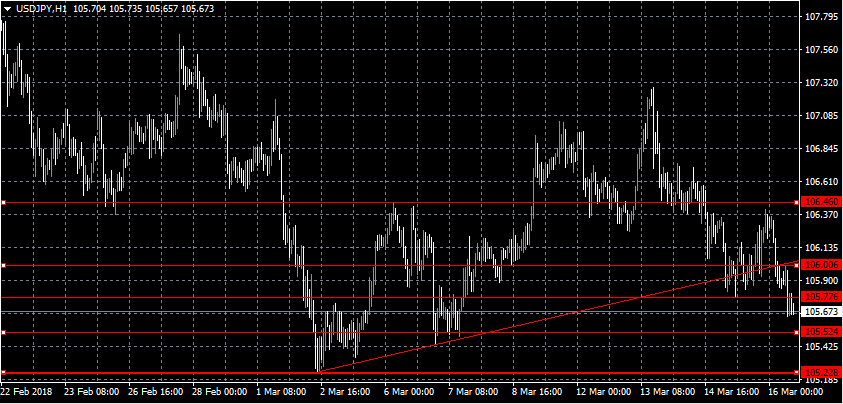
The U.S dollar has continued to slide against the Japanese yen during the European trading session, with price-action falling to a new weekly trading-low around the 105.60 level. Selling momentum is building around the pair, with medium-term USDJPY bears eyeing further intraday losses below the 105.50 level. Traders now look to the release of the Jolts job opening report, which remains a key measure of United States employment the U.S Federal Reserve monitor closely.
The USDJPY pair is likely to experience further losses below the 105.50 level, with key support then found at the 105.22 and 104.60 levels.
If the USDJPY pair moves back above the 105.77 resistance level, buyers may move price-action back towards the pivotal 106.00 level.
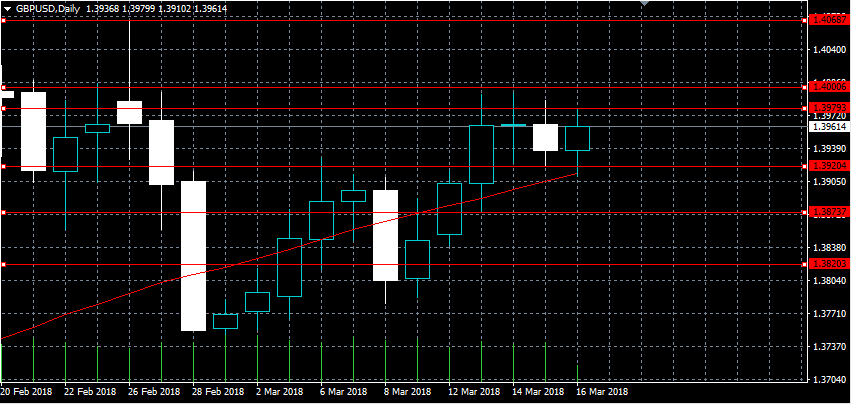
GBPUSD Still Bullish Above 1.3920
The British pound has recovered bullish trading momentum against the U.S dollar after sellers again failed to take charge of the pair below the key 1.3920 level. The GBPUSD pair currently trades around the 1.3960 level, after meeting firm intraday resistance from the 1.3979 technical level. Moving into the U.S session, buyers will look for gains above the 1.4000 level, while sellers will look for a confirmed break below the pairs fifty-day moving average.
The GBPUSD pair remains intraday bullish above the 1.3920 level, key intraday resistance is located at the 1.3979 and 1.4000 level.
A sustained move below the 1.3920 level may lead the GBPUSD pair to weaken towards the 1.3900 and 1.3873 support levels.
GBP/USD Bullish Confluence Targeting 1.4010 Zone
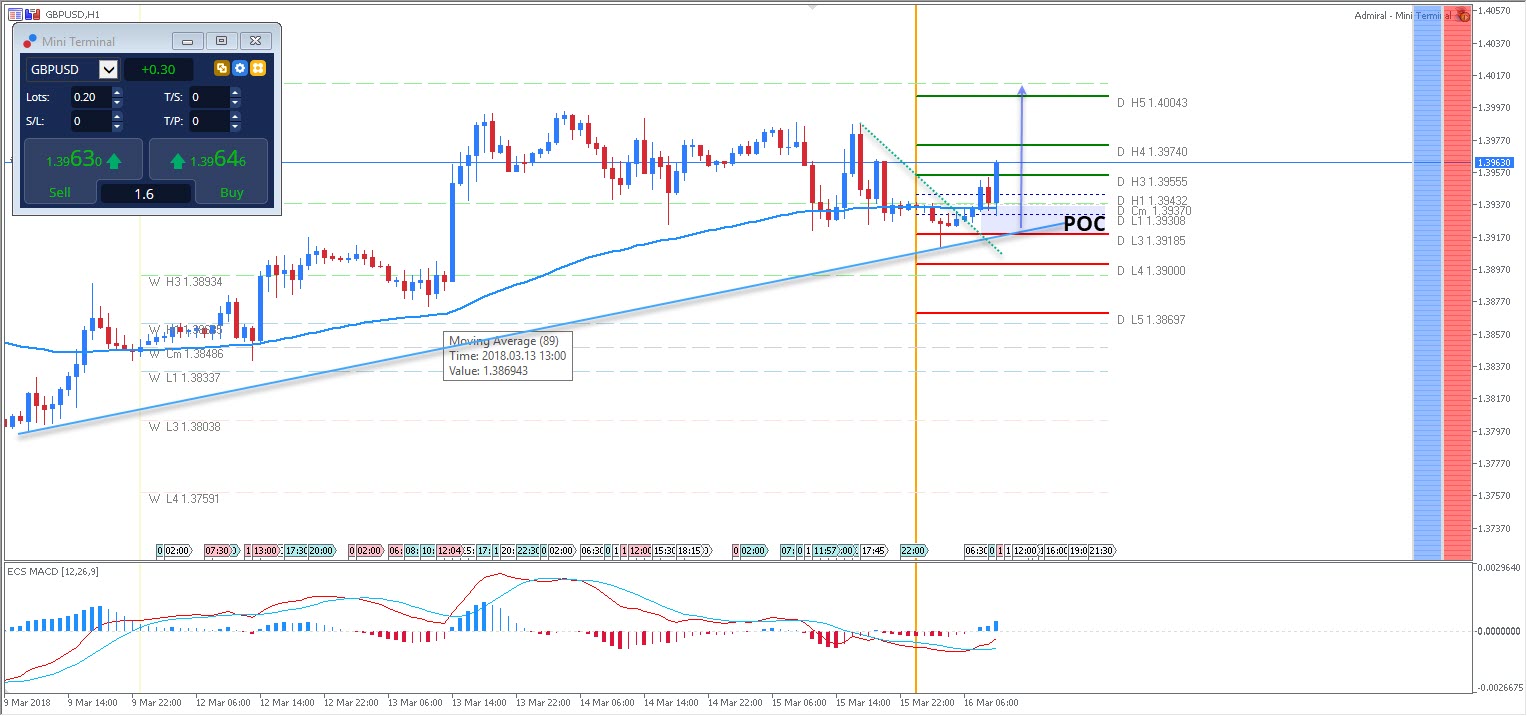
The GBP/USD is bouncing from the POC zone that has been formed within 1.3920-30 price range. If it manages to stay above the EMA89 1.3940 it should be strongly bullish. First target is 1.3974. Above, we might see 1.4004-1.4010 W H5 resistance.
As long as the price holds above today's POC zone, bulls should be safe. However, today is Friday and we might see profit taking later in the day, leading to a possible 2-way price action movement.
W H3 -Weekly Camarilla Pivot (Weekly Interim Resistance)
W L3 - Weekly Camarilla Pivot (Weekly Interim Support)
W H3 - Weekly Camarilla Pivot (Weekly Interim Resistance)
W H4 - Weekly Camarilla Pivot (Strong Weekly Resistance)
D H4 - Daily Camarilla Pivot (Very Strong Daily Resistance)
D L3 – Daily Camarilla Pivot (Daily Support)
D L4 – Daily H4 Camarilla (Very Strong Daily Support)
POC - Point Of Confluence (The zone where we expect price to react aka entry zone)
Trump-Quakes Roil The Dollar
USD takes a hit as Trump fires another of his adviser
Financial markets are encountering turbulence on the last trading day of the week amid allegation that Trump has fired his national security adviser H.R. McMaster. After gaining ground against most of its peers, the US dollar took a nosedive during the Asian session, as investors rushed into safe-haven assets ahead of the weekend.
The Japanese yen outperformed its G10 peers as it rose 0.56% against the buck, while the Swiss franc appreciated 0.25% with USD/CHF sliding to 0.9490. However, the latter is still trading within its weekly range in between 0.94 and 0.9535. On the medium-term, the bias remains on the upside for the pair, with the 0.96-0.97 area as closest resistance area.
US Treasury yields have stabilised since mid-February with the 2-year yield trading around 2.28% and the 10-year one treading water around 2.82%. Investors are now waiting to get further clarity regarding the Fed’s plan for the rest of the year. However, the constant increase in short-term interest rates suggests that Powell’s message has been heard loud and clear. The 3m Libor hit 1.78%, while the 3m OIS swap rate has been increasing continuously for the past seven months and currently stands at 1.68%, suggesting that market participants are increasingly confident that the Fed will follow up with another rate hike in June.
We think that the buck is bias to the upside, as investors will re-focus on the Fed’s policy tightening and put the political mess aside. However, we maintains our bullish view on EUR/USD as the ECB is also moving, slowly though, towards tightening.
Swiss National Bank interest rate maintained amid global trade war risks
Facing a strong depreciation against the single currency (EUR/CHF at 1.17; +9.04% in 1 year) and anticipating the risk of a potential trade war escalation, the Swiss National Bank finally took the decision to maintain its deposit rate stable at -0.75%. The last rate change occurred in January 15th 2015.
The SNB made it clear that the CHF is still overvalued and confirmed its concern about the forex market, which remains choppy, a situation that could completely change the story for the CHF in the event of volatility escalation. Considered as a safe haven asset, the CHF (incl. Gold) remains very sensitive to its macro environment, thus the reason of maintaining CHF-nominated investment attractiveness as low as possible.
As the Swiss economy continues its expansion (4Q 2017 GDP: 1.90%), inflation expectations are decreasing on the other side. SNB projections view the inflation rate at 0.60% (previously: 0.70%) for 2018, 0.90% in 2019 and 1.90% in 2020 with current interest rates unchanged.
Gaining strong momentum since the beginning of March 2018, EUR/CHF is trading sideways since March 7th 2018. The pair is currently contained between hourly support and resistance given at 1.1677 (07.03.2018 low) and 1.1735 (08/03/2018 high) and expected to remain so in the short-term.
DAX Higher Despite Soft Inflation Reports
The DAX index has posted gains in the Friday session. Currently, the DAX is trading at 12,417, up 0.58% on the day. On the release front, the focus was on inflation indicators. German Wholesale Price Index declined 0.3%, missing the estimate of +0.2%. Eurozone Final CPI also disappointing, as the reading of 1.1% was shy of the forecast of 1.3%
Eurozone economic conditions continue to improve, but inflation indicators have failed to keep up. Inflation remains well below the ECB target of just under 2 percent despite the stronger eurozone economy, led by a robust German economy. In fact, Eurozone Final CPI has been dropping in recent months, and this worrisome trend continued in February, when the indicator dropped to 1.1%, down from 1.3% a month earlier. This marked the weakest gain since December 2016. On Wednesday, inflation was on the mind of ECB President Mario Draghi, who expressed caution about inflation. Draghi said that the ECB still needed to see evidence that inflation was gaining strength before there could be any talk about a change in monetary policy. In the meantime, the ECB would remain “patient, persistent and prudent”. Stronger economic conditions have led to growing speculation that the ECB will wind up its stimulus program in September. However, there is still plenty of slack in the economy, and coupled with low inflation, Draghi can afford to remain cautious and maintain current monetary policy for some time.
After months of negotiations, Germany has a government in place. However, the news failed to elicit much of a response from German stock markets. Angela Merkel may have been all smiles as she was crowned to a fourth term this week, but this time she stumbled across the finish line, as opposed to previous wins, when she cruised to victory. Merkel’s stature has diminished after a poor showing in the election back in September, and she will preside over a fractured coalition. Merkel was forced to give the socialist SDP the powerful finance and foreign ministry portfolios, so we can expect the new government to be more supportive of eurozone integration, including more assistance for weaker eurozone members and less rigidity over spending and budgets.
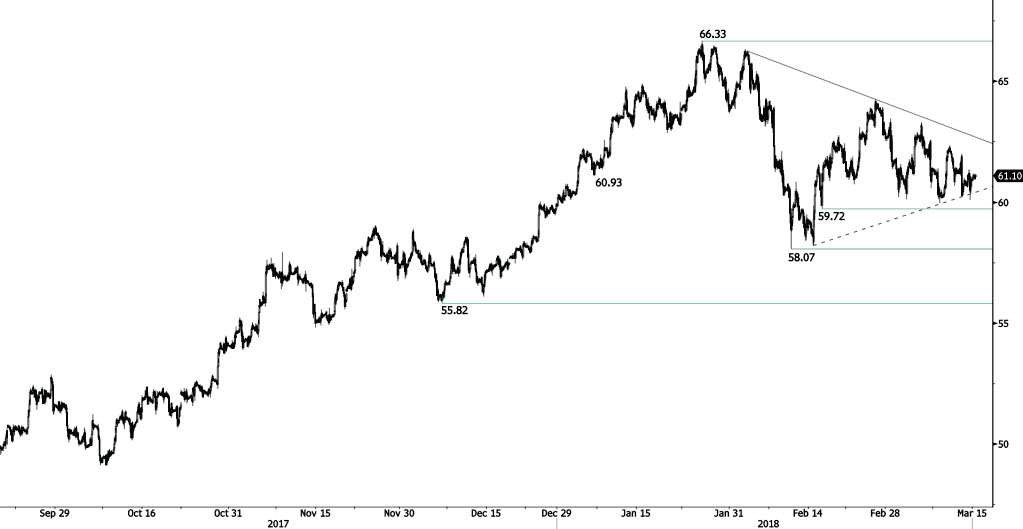
CRUDE OIL Heading Higher
Crude oil is pushing back following recent consolidation phase. Hourly support and resistance remain at 59.72 (15/02/2018 low) and 66.33 (25/01/2018 high). The technical structure suggests further short-term increase.
In the long-term, crude oil has recovered after its sharp decline last year. However, we consider that further weakness is very likely. For the time being, the pair lies in an upside trend since June 2017. Support lies at 42.20 (16/11/2016) while resistance is located at 77.83 (20/11/2014). Crude oil is trading largely above its 200 DMA.
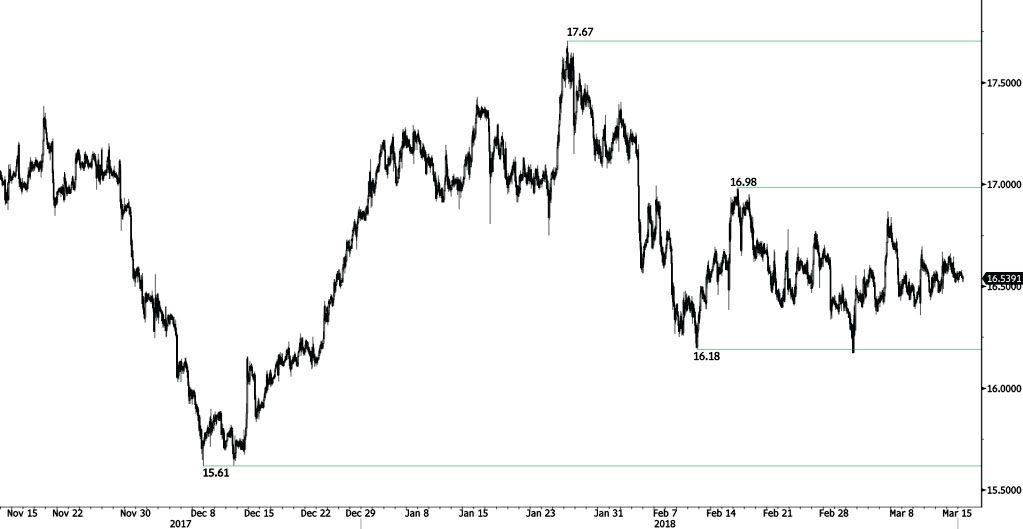
SILVER Buying Pressures
Silver is having a recovery phase following recent decline at 16.36, currently trading at the 16.50 range and expected to increase along the 16.65 range. Silver is contained between hourly support and resistance given at 16.18 (09/02/2018 low) and 16.98 (15/02/2018 high). The short-term technical structure suggests further short-term increase.
In the long-term, the trend remains negative/ sideways. Further downside is very likely. The pair is trading below its 200 DMA. Resistance is located at 21.58 (10/07/2014 high). Strong support can be found at 11.75 (20/04/2009).
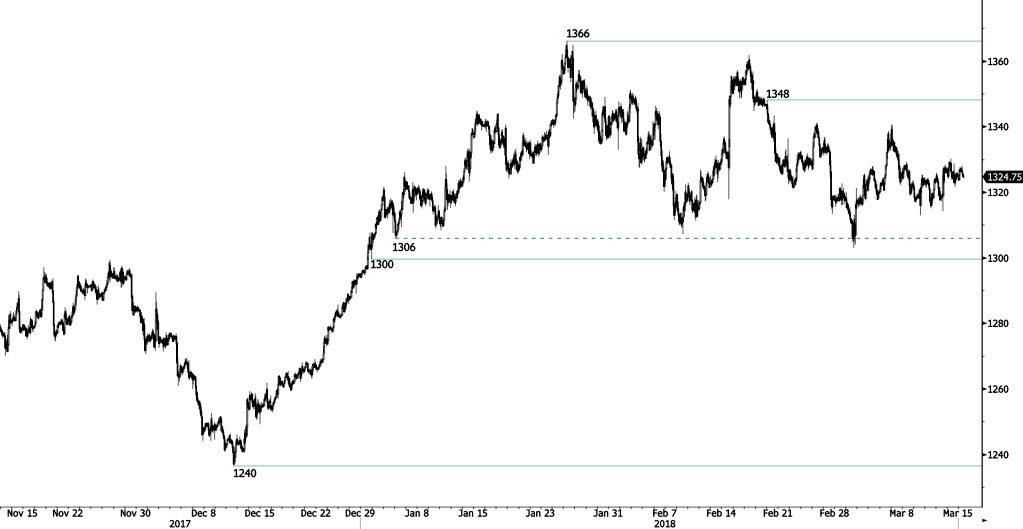
GOLD Trying To Bounce
Gold is slightly increasing following recent decline at 1313, heading for the 1325 range. The pair currently trades between hourly support and resistance at 1300 (29/12/2017 low) and 1338 (19/01/2018 high). The technical structure suggests further short-term increase.
In the long-term, the technical structure suggests that there is a growing upside momentum. A break of 1'392 (17/03/2014) is required to confirm it. A major support can be found at 1'045 (05/02/2010 low).