Sample Category Title
DOW approaching breakout point
DOW opens mildly higher today. It's staying in converging triangle pattern. And should be approaching a breakout point. Levels to watch are 24668.83 and 25449.15.
U of Michigan Sentiment 102 vs exp 99.3; Industrial production 1.1% vs exp 0.3%; Housing starts 1.24m vs exp...
US session data wrap up:-
- US U of Michigan sentiment Mar P: 102 vs exp 99.3 vs prior 99.7
- US industrial production Feb: 1.1% mom vs exp 0.3% mom vs prior -0.3% mom
- US capacity utilization Feb: 78.1% vs exp 77.7% vs prior 77.4%
- US housing starts Feb: 1.24m vs exp 1.30m vs prior 1.33m
- US building permits Feb: 1.30m vs exp 1.33m vs prior 1.38m
- Canada manufacturing sales Jan: -1.0% mom vs exp -0.9% vs prior -0.1% mom
- Canada international securities transactions (CAD) Jan: 5.68b vs prior exp 9.11b vs prior -1.54b
Canadian Manufacturing Sales Dropped in January
Highlights:
- Manufacturing sales dropped 1.0% in January to build on a 0.1% dip the prior month.
- The bulk of the weakness came from a big 6.1% drop in sales of motor vehicles and parts — due to 'atypical' assembly plant shutdowns - and a 9.5% drop in the volatile aerospace component.
- Ex-transportation products, sales edged up 0.2%
- Overall sale volumes declined by 1.1%
Our Take:
The 1.0% drop in manufacturing sales overall was somewhat larger than we expected though the details make the headline decline look less worrying. Most of the weakness was accounted for by a big 6.1% drop in motor vehicle and parts sales, reportedly due to 'atypical' assembly plant shutdowns that should reverse going forward. The often-volatile aerospace component also dropped almost 10%. Excluding transportation products, sales inched up 0.2% — albeit in large part because of a price-led increase in petroleum & coal sales. Sale volumes declined 1.1% overall but were little changed excluding the transportation component.
Manufacturing production was also stronger than sales in January with inventories rising 0.9%. That, of course, could just be borrowing production from future months if sales don't bounce back. In the near-term, though, it means the manufacturing sector may have actually added positively to GDP growth in January despite the headline sales drop. Canadian economic data has certainly been more mixed recently than a year-ago when the economy was growing at a (unsustainably-strong) 4% clip per quarter. Reports on retail and wholesale trade sales next week will provide further clarification on the pace of early-2018 growth but for now we think the data is still consistent with further, albeit more modest, improvement at a close to 2% rate in Q1 2018.
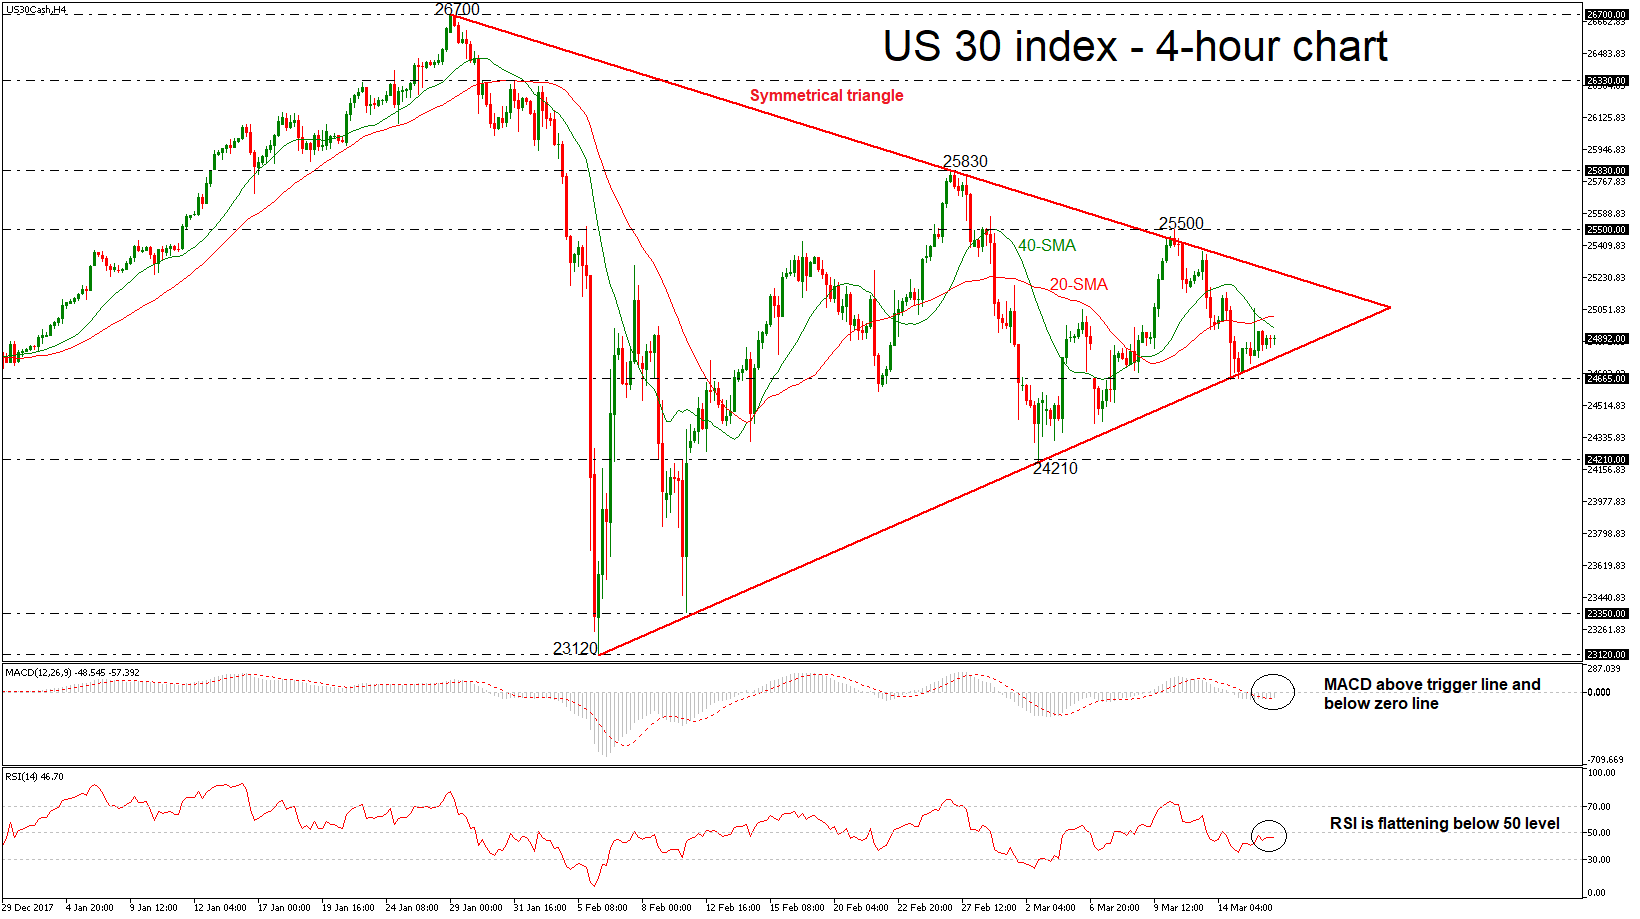
US 30 Index Trades in Symmetrical Triangle; Weak Bias in Near Term
The US 30 index has been developing within a symmetrical triangle since January 29 in the 4-hour chart as it failed several times to create higher highs and lower lows. The prices completed numerous days with weak momentum and are trading slightly above the lower boundary of the triangle.
Support was met around the 24665 region, forcing the index to turn to the upside. The neutral bias in the near term is supported by the deterioration in the momentum indicators. The MACD oscillator climbed above its trigger line, however, it is still moving below the zero line. Also, the RSI indicator holds below the 50 level and is flattening, signaling weak momentum in the market.
In case of a downward penetration of the symmetrical pattern, this would indicate a bearish bias. A drop below the 24665 level would reinforce the short-term negative view and open the way towards the 24210 level.
An alternative scenario is a continuation of the previous strong bullish trend if the index successfully surpasses the upper boundary of the triangle. A jump above 25200 could drive the price towards the 25500 significant resistance level, which has been a major resistance area in the past. A break above it could open the door for 25830.
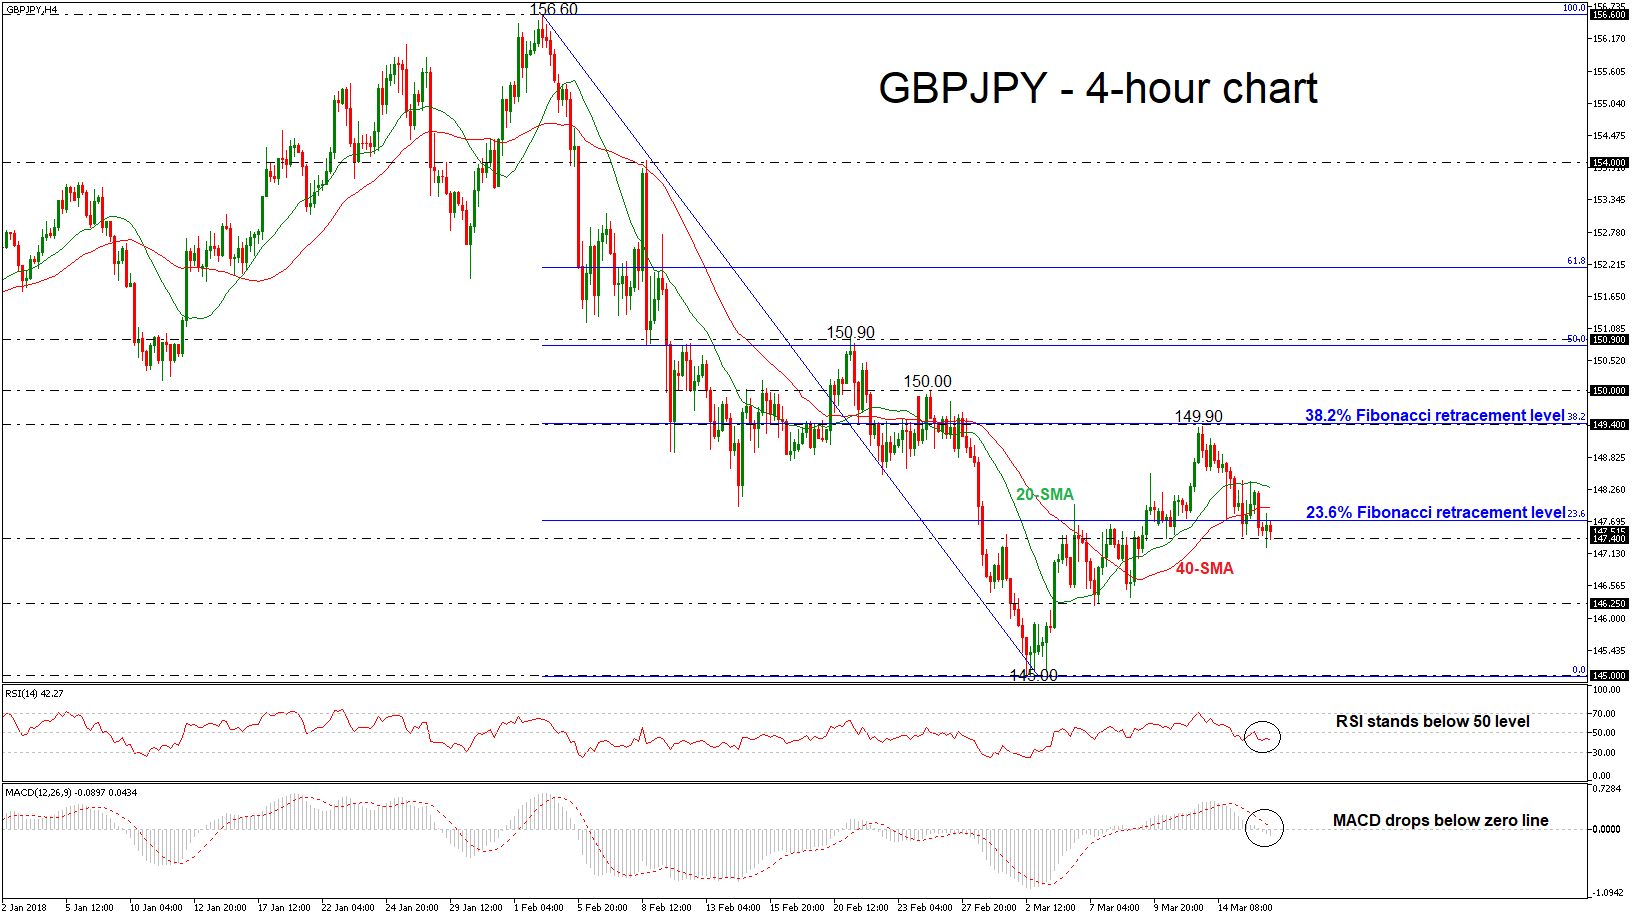
GBPJPY Further Losses in Focus; Stands Below 20 and 40 SMAs
GBPJPY has reversed back down again after finding resistance at the two-week high of 149.37 achieved this week. This top is just below the 38.2% Fibonacci retracement level of the downleg from February’s high of 156.60 to March’s low of 145.00.
Momentum indicators are pointing to a bearish bias in the short term with the RSI indicator holds just below the 50 level and the MACD oscillator fell below the zero line with weak momentum. It is worth mentioning that the price is trading below the 20 and 40 simple moving averages in the 4-hour chart acting as strong resistance level at 147.95 and 148.28 respectively, while the 23.6% Fibonacci could be a key resistance level near 147.70.
If price action remains negative and falls below the 147.40 strong support obstacle, the next major level to watch is the 146.25 barrier. Further losses could push GBPJPY towards the 145.00 psychological level.
Conversely, if the price creates a bullish movement again, then the focus could shift to the upside until the 149.40 resistance barrier. If this level is breached, it could increase bullish pressure until the price hits the 150.00 critical level.
Canadian Manufacturing Starts Year on Softer Note, But Outlook Remains Robust
Canadian manufacturing sales fell 1.0% in January, or a touch worse than the 0.9% decline expected by the markets. However, the decline came atop of positive revisions to the previous month, with the December decline toned down from 0.3% to 0.1%. After accounting for price changes the volume of sales was down by slightly more, or 1.1%. But again, the upward revision helped offset some of the decline.
Durables, and more specifically transport equipment, accounted for the entirety of the decline, and excluding this broad category left shipments flat on the month (-0.1% m/m). Transport products fell by a whopping 6.3%, as motor vehicles (-8.0%), auto parts (-3.8%), aerospace (-9.5%), and rolling stock (-14.4%) were down sharply. Most other durable categories experienced less pronounced declines, with fabricated metals (1.6%), furniture (1.9%), and miscellaneous products (3.4%) increasing on the month. Nondurables fared better, up 1.7%, led by chemicals (+6.1%) and petroleum (+6.5%).
Regionally, manufacturing sales were down in half of all provinces, led by P.E.I. (-13.0%), Manitoba (-3.1%), and Ontario (-2.3%). Saskatchewan saw the biggest gain, at 5.7% on the month.
Inventories were up 0.9% on the month, with the inventory-to-sales ratio up slightly to 1.39 on the weakness in shipments. Forward looking indicators were relatively constuctive, with unfilled orders up 0.6% and new orders ticking up 0.1%.
Key Implications
Canadian manufacturing started the year off on a weak note with both value and volumes of shipments down on the month. However, much of the decline was anticipated, owing to a longer shut-in by GM as well as a one-day strike across auto marts manufacturers. Taken together with the positive revision to December's numbers, this morning's report keeps our view of manufacturing output and exports in the first-quarter largely unchanged, with real GDP growth around the mid-1% mark.
The dissipation of the transitory factors which held back January shipments bodes well for the February figure, which we expect will indicate a sharp rebound. Moreover, the uptick in new and unfilled orders, should also provide some support. However, this needs to be taken in context with an elevated inventory-to-sales ratio in the sector.
The Canadian manufacturing sector should benefit from the improving U.S. economy over the near- to medium-term. Manufacturing industrial production surged 1.2% in February, to a new cyclical record, while fiscal stimulus in the form of tax cuts and a budget deal offer further boost to demand. Demand should be particularly strong in the primary and fabricated metal industries, with Canada getting an exemption to the U.S. tariffs on imports of aluminum and steel. However, the exemption is conditional on a successful renegotiation of NAFTA, with the pact's survival a crucial element of the manufacturing outlook.
US: Homebuilding Slows in February But Single-Family Segment Advances
U.S. housing starts weakened in February, as homebuilders broke ground on 1,236k new homes. Consensus expected a more limited decline to 1,290k from the 1,329k (revised) recorded in January. Permits also disappointed, coming in at 1,298k, contracting 6% on the month.
Despite the unfavorable headline print, single-family homebuilding gained ground (+25k) to 902k, while the volatile multi-family segment accounted for the decline (-118k to 334k). Some pullback was expected in the multi-family segment due to the previous month's outsized gain, while single-family starts gained momentum from the previous month's +30k increase.
Building permits fell by 79k to 1,298k, after reaching a post-recession high in January. Both the single-family (-5k to 872k) and multi-family (-74k to 426k) segments saw permits fall. However, the single-family segment benefitted from a period of strength following hurricanes at the end of last year and remain elevated. The South (-87k) and the West (-13k) were the two regions accounting for the decline, after each hit a post-recession high in January.
All regions except for the Midwest (+11k) saw activity fall in February. Starts in both the South and the West fell by 50k, while the Northeast saw a 4k drop. That being said, starts in the South and West likely remain on an upward trajectory, in contrast to the Northeast and the Midwest.
Key Implications
After the previous month's strong print which led starts to reach a post-recession high, a slowdown was anticipated in February. That being said, single-family starts posted another gain and permits remain elevated relative to 2017, indicating that activity should continue at a brisk pace this year.
Barriers to activity remain, however, including a continued labor shortage in the construction industry and a lack of buildable lots. Additionally, tax reforms that cap the state and local tax deduction and lower the mortgage interest deduction will work to shift demand to lower priced segments of the market. That won't alter the number of housing starts, however, the value per unit under construction is expected to decrease as a result. While this uncertainty may have dampened builder optimism a hair in March, the NAHB builder's index remains within reach of the near two-decade high achieved at the end of last year.
Positive fundamentals including a tightening labor market and accelerating wages should support demand over 2018, offsetting the burden of higher mortgage rates. At the same time, tight inventories and rising prices will continue to support homebuilding, with an improvement in the homeownership rate supporting activity in the single-family segment in particular. As such, we expect residential investment to edge higher this year, bolstered by strength in the single-family segment.
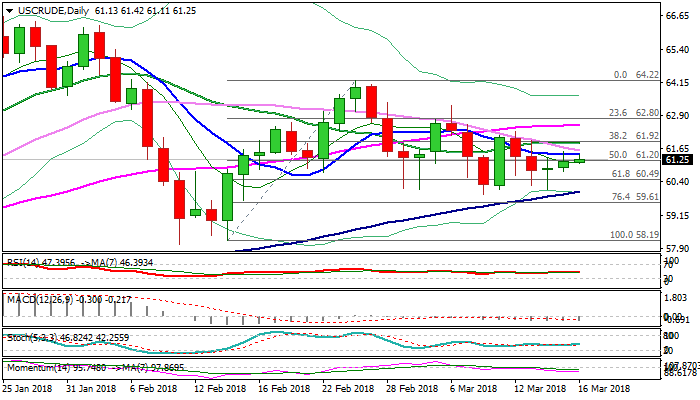
WTI Oil Attempts Again into Daily Cloud But Negative Techs Warn of Stall
WTI oil holds steady on Friday and remains in green for the third straight day, driven higher by weaker dollar. Fresh attempts into daily cloud come after Thursday's probe through cloud base ($61.23) and spike to $61.53 proved to be false break. The action was so far capped by 10SMA ($61.42) which limited upticks in previous two sessions and guards a cluster of barriers above, provided by daily MA's (30/20/55SMA) within $61.57 and $62.56. Fresh extension higher is unlikely to sustain break through cloud top and extend higher as daily MA's are in bearish configuration and negative momentum studies continues to weigh. Negative signal could be expected on repeated failure to close above cloud base, which would turn near-term bias bearish and re-expose strong $60.00 support zone (recent multiple downside rejections / rising 100SMA). Bullish scenario sees close above cloud base as minimum requirement, which would be boosted by break above 10SMA, to open way for stronger recovery and test of barriers at $61.57 (30SMA); $61.84 (20SMA) with possible extension towards $62.55 (55SMA) on stronger bullish acceleration.
Res: 61.42; 61.57; 61.84; 62.55
Sup: 61.11; 60.80; 60.49; 60.11
EUR/USD Mid-Day Outlook
Daily Pivots: (S1) 1.2274; (P) 1.2329 (R1) 1.2358; More....
Intraday bias in EUR/USD remains neutral as range trading continues. On the upside, break of 1.2445 will target a test on 1.2555 high. Decisive break there will resume medium term rally and carry larger bullish implication. But again, break of 1.2268 will argue that fall from 1.2555 is resuming. And intraday bias will be turned back to the downside for 1.2154 support and below.
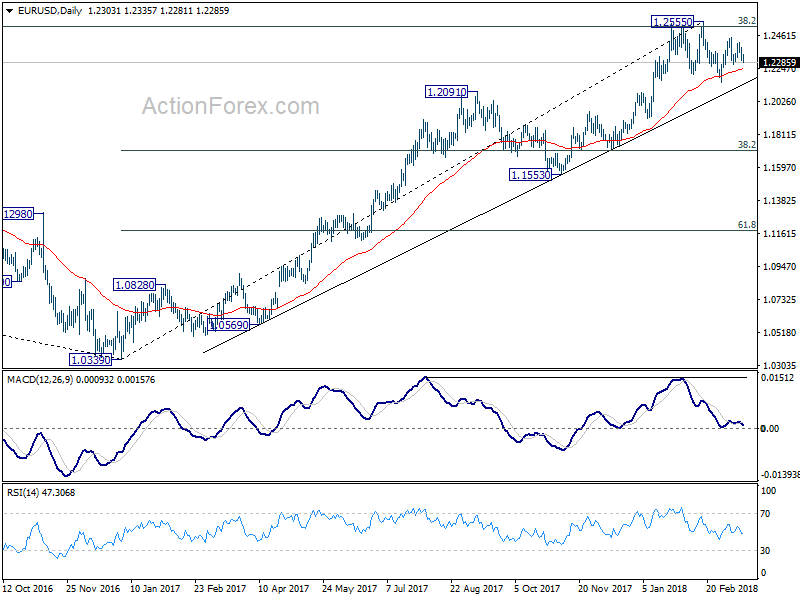
In the bigger picture, key fibonacci level at 38.2% retracement of 1.6039 (2008 high) to 1.0339 (2017 low) at 1.2516 remains intact despite attempts to break. Hence, rise from 1.0339 medium term bottom is still seen as a corrective move for the moment. Rejection from 1.2516 will maintain long term bearish outlook and keep the case for retesting 1.0039 alive. Firm break of 1.1553 support will add more medium term bearishness. However, sustained break of 1.2516 will carry larger bullish implication and target 61.8% retracement of 1.6039 to 1.0339 at 1.3862.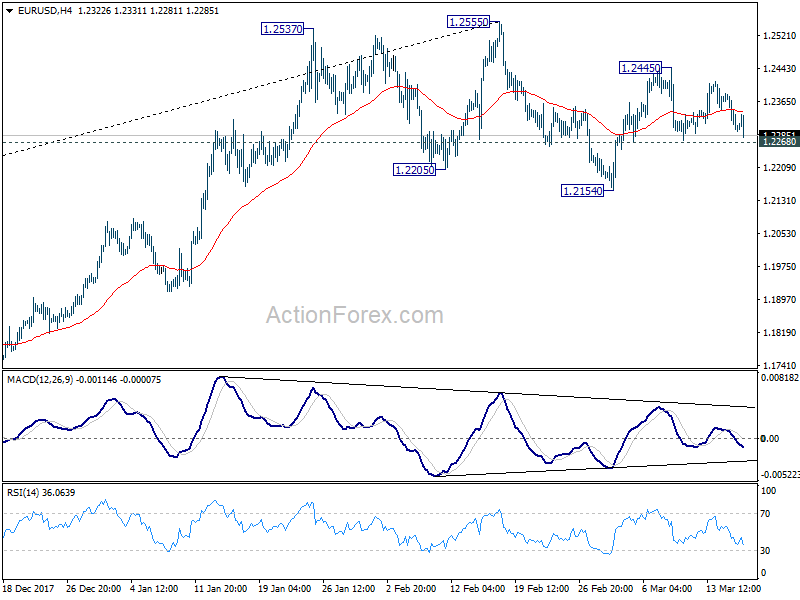
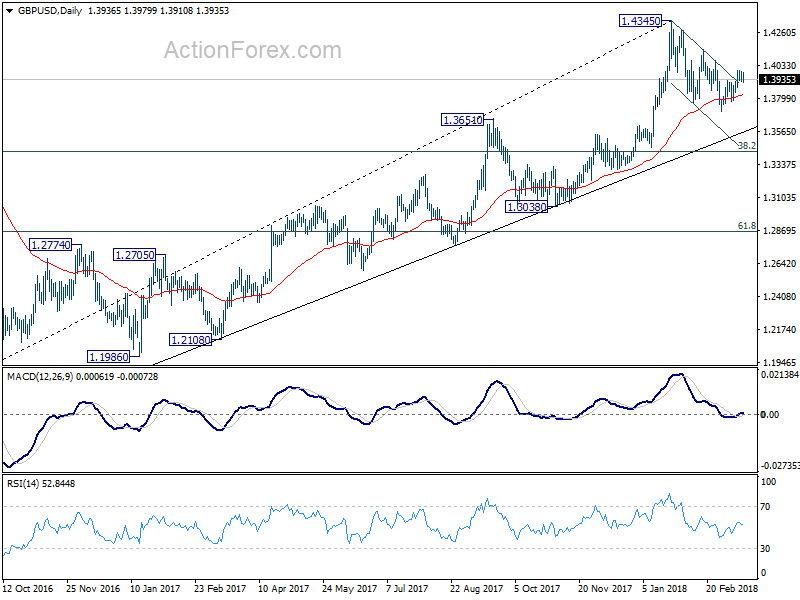
GBP/USD Mid-Day Outlook
Daily Pivots: (S1) 1.3907; (P) 1.3948; (R1) 1.3975; More....
No change in GBP/USD's outlook. With 1.3873 minor support intact, further rise is still in favor for 1.4144 resistance. Break there will confirm completion of correction from 1.4345 and target retest of this high. On the downside, below 1.3873 minor support will turn bias to the downside to extend the corrective fall from 1.4345 instead.
In the bigger picture, as long as 1.3038 support holds, medium term outlook in GBP/USD will remains bullish. Rise from 1.1946 is at least correcting the long term down from 2007 high at 2.1161. Further rally would be seen back to 38.2% retracement of 2.1161 (2007 high) to 1.1946 (2016 low) at 1.5466. However, GBP/USD fails to sustain above 55 month EMA (now at 1.4259) so far. Break of 1.3038 support, will suggest that rise from 1.1946 has completed and will turn outlook bearish for retesting this low.