Sample Category Title
EUR/AUD Weekly Outlook
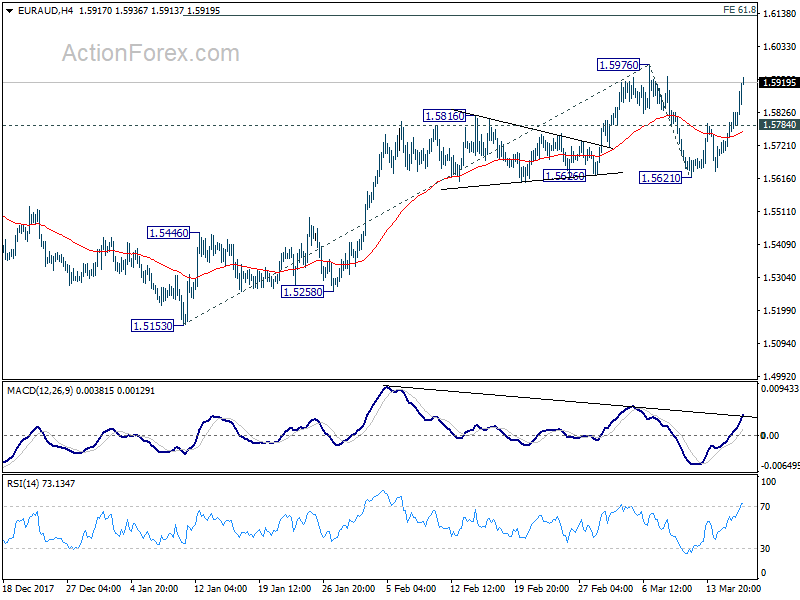
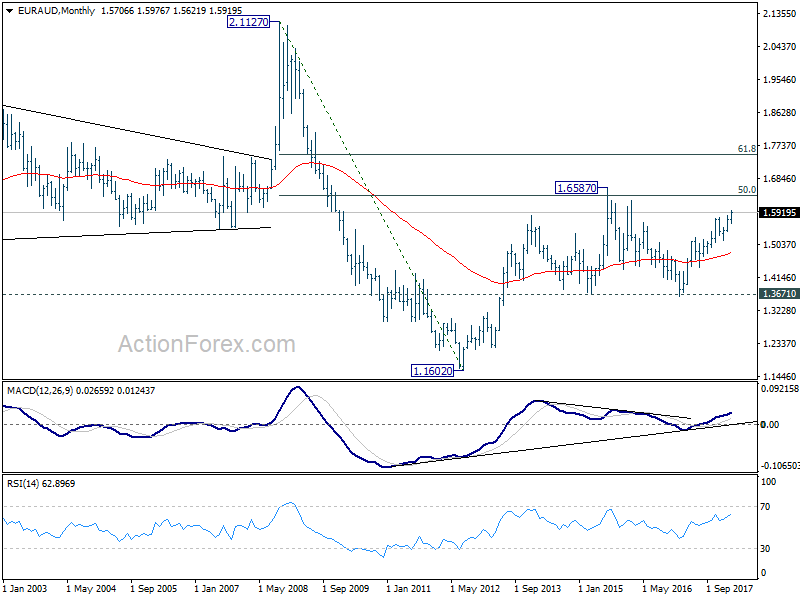
EUR/AUD drew supported from 1.5626 and bottomed at 1.5621, then rebounded strongly. The development suggests that larger up t rend from 1.3624 is not finished yet. Initial bias remains on the upside this week for retesting 1.5976 high first. Break will resume the upside for 61.8% projection of 1.5130 to 1.5976 from 1.5621 at 1.6130 first. On the downside, below 1.5784 minor support will delay the bullish case and turn intraday bias neutral first.
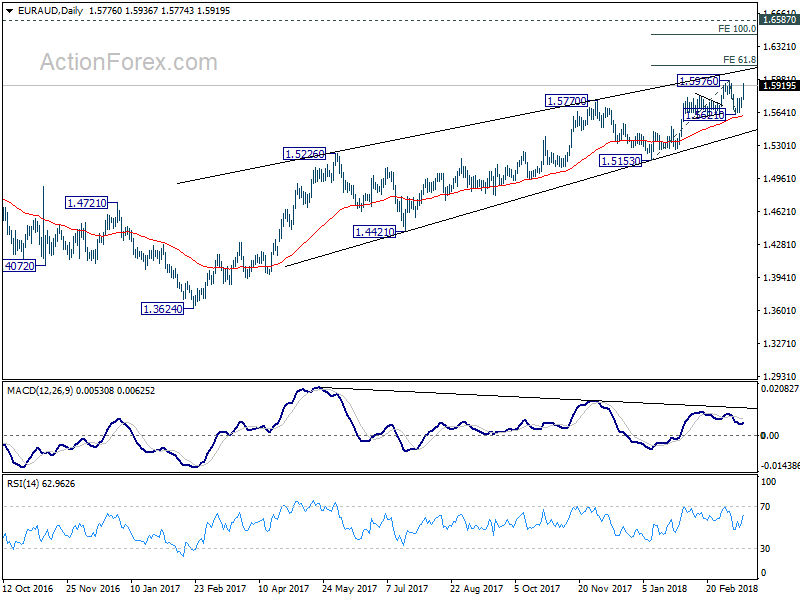
In the bigger picture, current development suggests that rise from 1.3624 is not completed yet. And it's still in progress for 1.6587 key resistance level. We'd be cautious on strong resistance from there to limit upside, on bearish divergence condition in daily MACD. But for now, break of 1.5153 support is needed to indicate medium term reversal. Otherwise, outlook will stays bullish even in case of deep pull back.
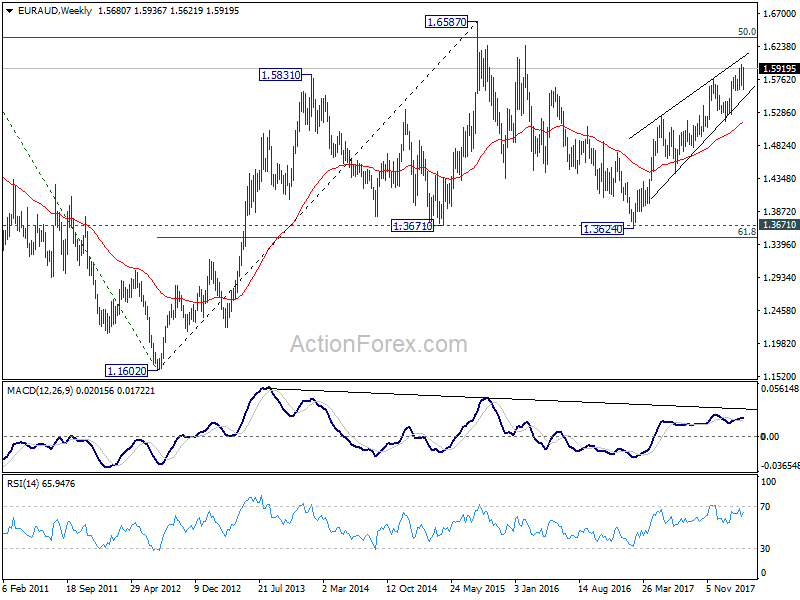
In the longer term picture, the rise from 1.1602 long term bottom (2012 low) isn't over yet. We'll keep monitoring the development but there is prospect of extending the rise to 61.8% retracement of 2.1127 to 1.1602 at 1.7488 and above. However, sustained trading below 1.3671 should indicate long term reversal and target 1.1602 long term bottom again.

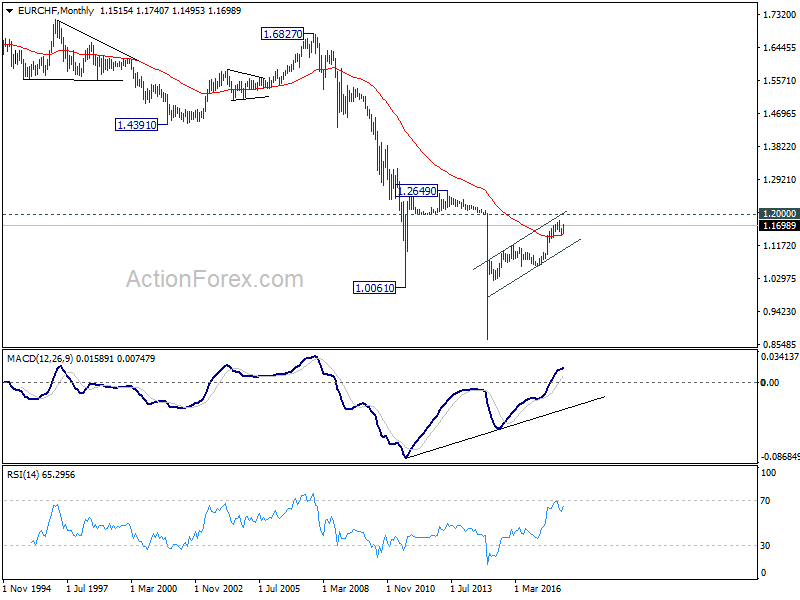
EUR/CHF Weekly Outlook
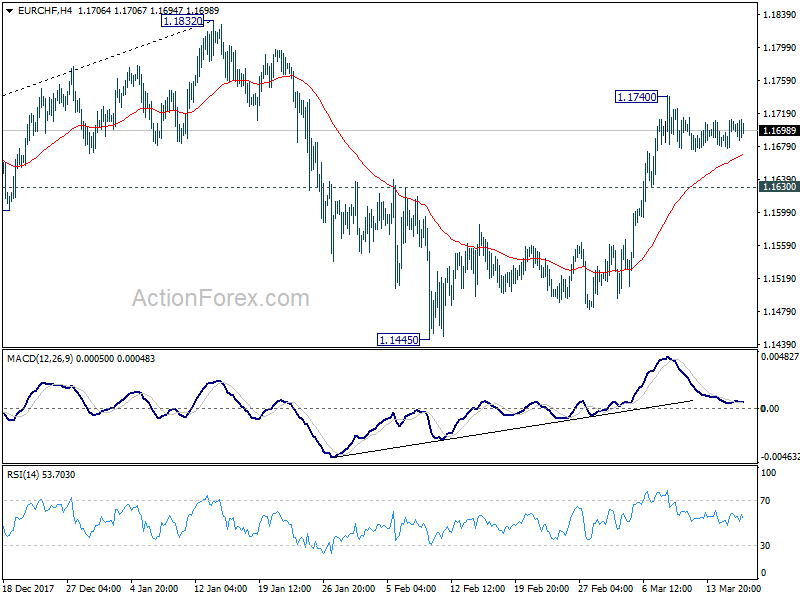
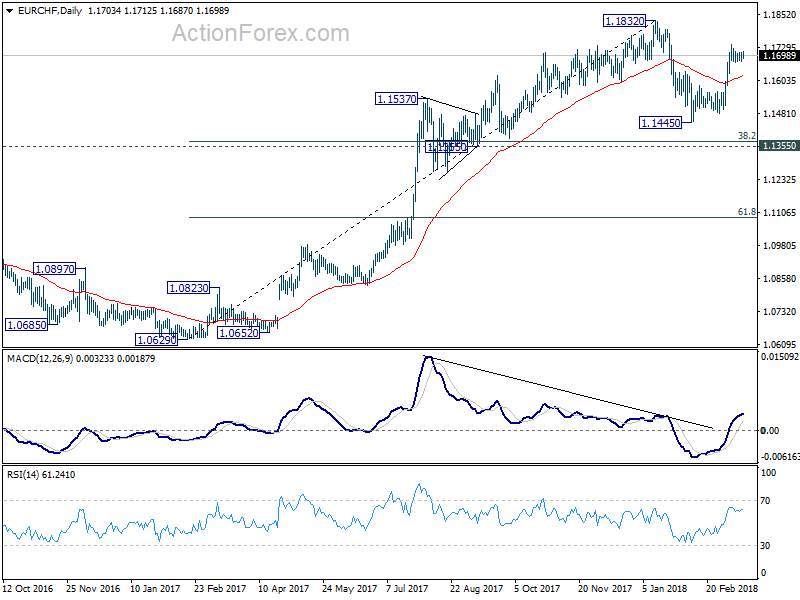
No change in EUR/CHF's outlook as it stayed in consolidation below 1.1740 last week. Initial bias remains neutral this week first. After all, near term outlook remains bullish as long as 1.1630 support holds. Above 1.1740 will target a test on 1.1832 high. At this point, we'll stay cautious strong resistance from there to bring another fall. Corrective pattern from 1.1832 might still have an attempt on 1.1355 cluster support (38.2% retracement of 1.0629 to 1.1832 at 1.1372) before completion. On the downside, below 1.1630 minor support will target 1.1445 low again.
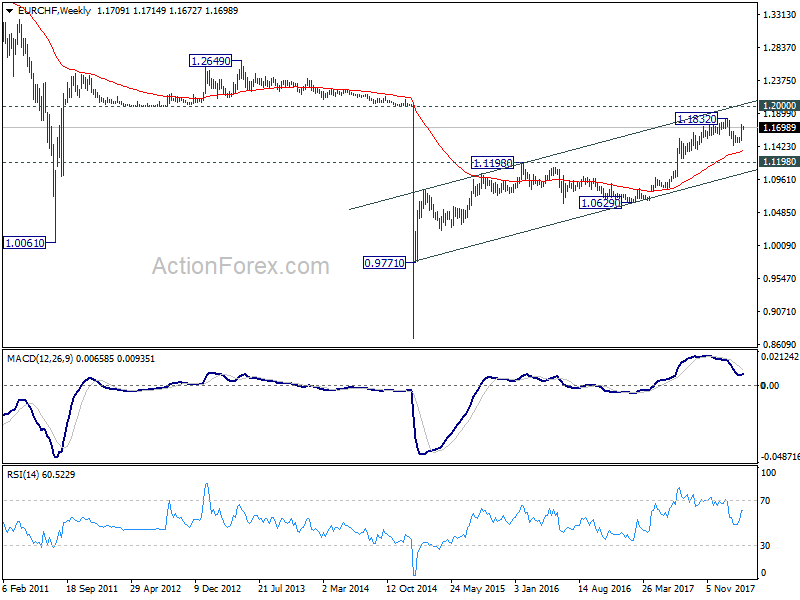
In the bigger picture, a medium term top should be in place at 1.1832 on bearish divergence condition in daily MACD. But there is no indication of long term reversal yet. As long as 1.1198 resistance turned support holds, we'd still expect another rise through prior SNB imposed floor at 1.2000.
CAD, AUD, NZD All Suffered as Trump Stepping on Protectionist Acceleration Pedal
Yen maintained solid strength throughout last week as it ended as the strongest one. Meanwhile, the fortunes of commodity currencies suddenly reversed towards the end. Canadian, Australian and New Zealand Dollar ended as the three weakest ones. Some blamed the selloff in commodity currencies to Dollar's strength. But the greenback just ended marginally higher against Euro and down against Yen and Sterling. US long term yields weakened, in particular in 30 year yield. Dollar index stayed in range well below 91 key resistance handle. While markets increased their bets on a Fed rate hike this week, they're paring bets on a June hike. So, traders dumped commodity currencies for some other reason. And we believed it's because of trade war on these countries.
Trump stepping on his protectionist pedal, targeting China
Recent developments clearly showed that US President Donald Trump is stepping on his protectionist acceleration pedal. Following the departure of globalist White House economic advisor Gary Cohn, another one Secretary of State Rex Tillerson was fired last week. Larry Kudlow was appointed to replace Cohn. Some people focused on his comment of "buy King Dollar" in the CNBC interview as the market mover. But indeed, it was his comments of "China needs a comeuppance on trade" that moved markets.
In the background, it's reported that Trump is going to make use of the so called Section 301 intellectual property investigation report as a reason to impose tariffs on Chinese products. And he has ordered Trade Representative Robert Lighthizer to come up with a plan of USD 60b a year of tariffs on China. The plan could be announced as soon as this week. At the same time, China was making itself ready for retaliation measures. Considering the close link between China, Australia and New Zealand, the latters will be deeply affected if a US-China trade war starts.
On other hand, Canadian Dollar was firstly weighed down by BoC Governor Stephen Poloz's caution that rate hikes might as come as quick as the markets thought. Additionally, outlook is heavily clouded by the lack of progress in NAFTA renegotiation. Mexican Economy Minister Ildefonso Guajardo once expressed his frustration that NAFTA will continue with Canada and Mexico, but could be without the US.
Bets on Fed March hike increased, but June hike decreased
The markets continued to firm up expectation for a 25bps rate hike by Fed this week to 1.75%. Fed fund futures are pricing in 94.4% chance for that. Released from the US last week, headline CPI accelerated to 2.2% yoy in February, up from 2.1% yoy. Core CPI was unchanged at 1.8% yoy. The data provided no obstacles for Fed's decision. Voting and Fed's new economic projections would be the key focuses though. In particular, known dove Chicago Fed Charles Evans might vote against the hike. The famous dot-plot could also reveal whether Fed officials have shifted their base case from three hikes to four hikes this year.
However, at the same time, expectations for another 25bps hike in June has decreased. to 74.8%, down from 77.6% a week ago. While it's admittedly only a slight downside adjustment in pricing, it could be seen as a sign of worry in the markets, which could also be reflected in the sharp fall in 30 year yield. Political uncertainty in the White House, as well as the risks of trade war could be quietly weighing on Fed expectations.
30 years yield faced strong resistance, tumbled
Talking about treasury yields, 10 year yield was relatively steady last week. TNX closed the week down 0.046 to 2.848. But it;s staying in recent tight range between 2.795 and 2.943. The pull back in 30 year yield was much more apparent as it closed the week down 0.079 to 3.080.TYX is facing strong resistance from 3.255, 61.8% retracement of 3.976 to 2.102 at 3.260. TYX is still technically in near term up trend. But we'll see whether the pull back would extend deeper.
 Dollar index struggled in range
Some people said that dollar was strong last week but that's not what we saw. The greenback closed down against Yen and Sterling which were the strongest ones. EUR/USD, while closed in red, is still hold on to 1.2268 minor support to maintain near term bullishness. Much more is needed for the dollar to prove its strength.
The dollar index too, struggled in tight range last week and was held below 91.01 key near term resistance. It's indeed even kept below 55 day EMA (now at 90.46). There is no clear indication of trend reversal yet even the index is trying to draw support from 50% retracement of 72.69 to 103.82 at 88.25. Medium term down trend is still in favor to extend to 61.8% retracement at 84.58. We'd have to see a sustained break of 91.01 resistance turned support for confirming medium term bottoming.
 BoE and Brexit transition deal for Sterling ahead
Sterling has been very resilient in the time of global market votaility. It ended last week as the second strongest following Yen. But it's bounded is February's range against all except commodity currencies. The coming week will be big for the Pound with CPI, BoE and EU summit scheduled.
Is BoE expected to change interest rate or asset purchase? No. Is anyone expected to dissent the decision? No. Is there new economic forecasts? No, as they were published in the February Quarterly Inflation Report already. Would BoE turn less cautious on the outlook? No, as the outlook hinges on Brexit negotiation and there won't be news regarding the transition deal before BoE announcement. So, the BoE rate decision could turn out to be a business as usual non-event.
Meanwhile, UK is expected table the legal text for the Brexit transition deal to EU during the summit starting March 22. It's hopeful that the transition deal would be approved. However, as some reported, the deal could be nothing more than political agreement, without details, nor clarity. And business would still be kept in dark on what they could expect next and continue to waste time and efforts on contingency.
The issue of Irish border is clearly the main issue now. And EU's position is quite clear. Without a solution on Irish border by Autumn, the negotiation could collapse. Without a Brexit deal, there is no point for a transition deal. Intensive talk is planned between March 26 and April 18 on the issue. But that's a story after next week.
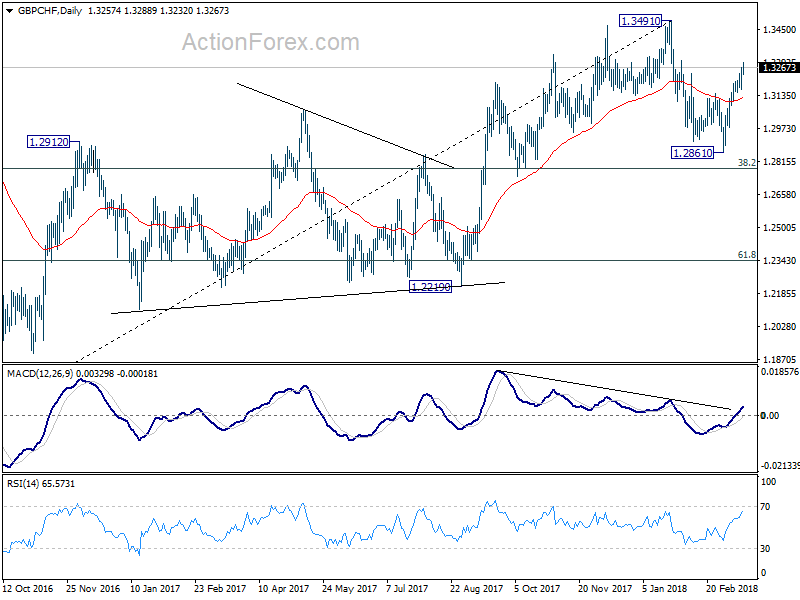
GBP/CHF's strong rebound since early March suggests that fall from 1.3491 was over at 1.2861. And it's kept quite well above 38.2% retracement of 1.1638 to 1.3491 at 1.2783. The development now argues that price actions from 1.3491 are merely developing into a sideway corrective pattern. Further rise could be seen back to retest 1.3491 in near term but first attempt should fail. Eventually, larger up trend from 1.1638 (2016 low) is in favor to resume after the consolidation completes.
 A look at CAD, AUD, NZD relative weakness
For now, we're not expecting commodity currencies to come back easily. But there are still some important data and events that could change their relatively strength. The list to watch include RBNZ rate decision, RBA minutes, Australia employment, Canada CPI and Canada retail sales. RBNZ shouldn't change monetary policy nor its neutral tone. RBA will also likely pains a neutral picture. Australia and Canadian data would likely be the more market moving ones.
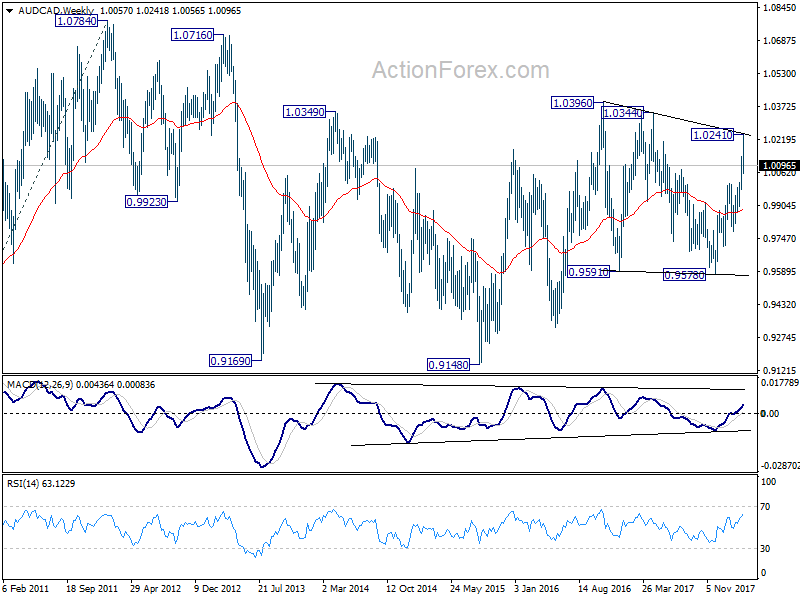
Comparing Aussie and Canadian, AUD/CAD extended recent rise to as high as 1.0241 last week but dropped sharply on the late selloff in Aussie. Pull back from 1.0241 might extend deeper in near term. But still, price actions from 1.0396 are viewed as a corrective pattern. It's either in form of a three wave pattern that's completed at 0.9570, or a five wave triangle with fall from 1.2041 as the final leg. In either case, range breakout should be around the corner for resume the rise from 0.9148 towards 1.0784 high.
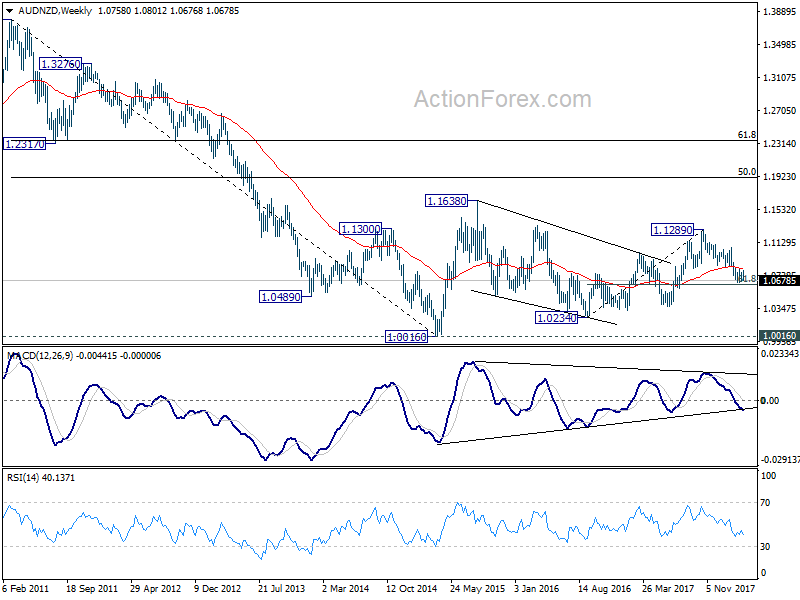
 AUD/NZD is staying in the medium term down trend from 1.1289. Recent consolidation was limited below 55 week EMA, thus maintaining bearishness. Weekly MACD could also be breaking its trend line. Hence, deeper decline is expected through 61.8% retracement of 1.0234 to 1.1289 at 1.0637, probably soon. But since the overall price actions from 1.0016 low are corrective looking, we'd expect loss of downside momentum as the cross approaches 1.0234 key support.
AUD/USD Weekly Outlook
AUD/USD's rebound was limited at 0.7915 last week and reversed. Subsequent sharp fall and break of 0.7712 support indicates resumption of whole decline from 0.8135. Initial bias stays on the downside this week for 0.7500 key support next.
One of the interpretation of recent price actions is that price action from 0.7758 to 0.7915 were a three wave consolidation pattern. If that's true, the fact that 0.7712 was well below 0.7758 indicates strong selling pressure even inside that consolidation. That is, decline from 0.7915 would then be a very powerful move that could takes out 0.7500 easily. We'll keep an eye on it to see if there is any further downside acceleration ahead.
On the upside, above 0.7769 minor resistance will turn intraday bias neutral first. But outlook will remain bearish as long as 0.7915 resistance holds.
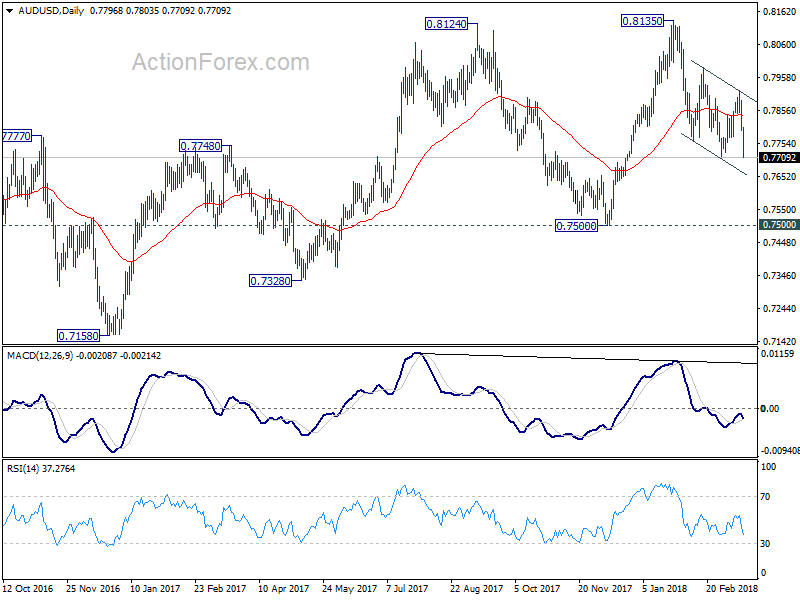
In the bigger picture, medium term rebound from 0.6826 is seen as a corrective move. It might still extend higher but we'd expect strong resistance from 38.2% retracement of 1.1079 to 0.6826 at 0.8451 to limit upside to bring long term down trend resumption. On the downside, break of 0.7500 support will now be an important signal that such corrective rebound is completed.
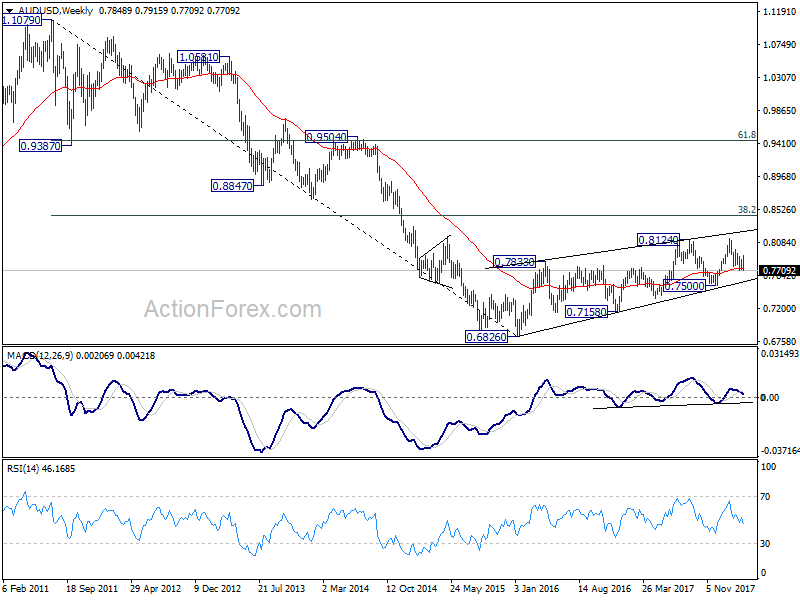
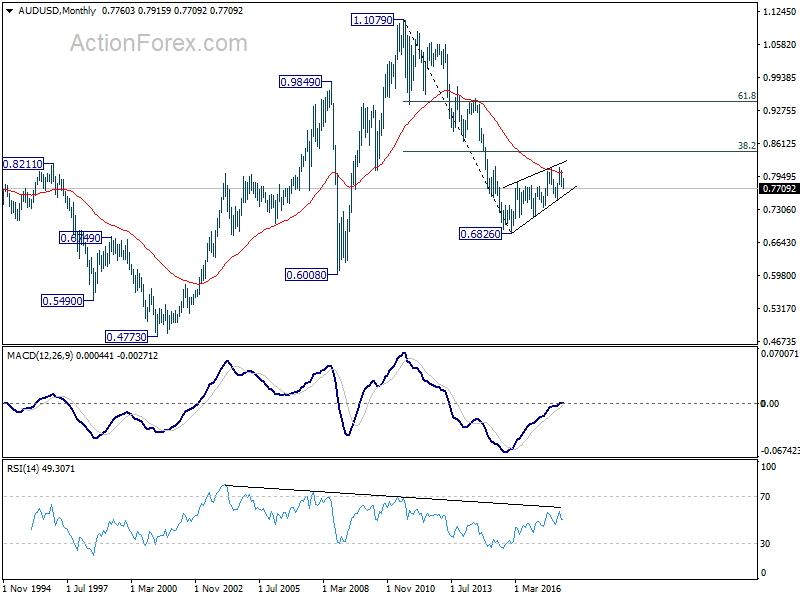
In the longer term picture, 0.6826 is seen as a long term bottom. Rise from there could either reverse the down trend from 1.1079, or just develop into a corrective pattern. At this point, we're favoring the latter. And, as long as 38.2% retracement of 1.1079 to 0.6826 at 0.8451 holds, we'd anticipate another decline through 0.6826 at a later stage. But strong support should be seen between 0.4773 (2001 low) and 0.6008 (2008 low).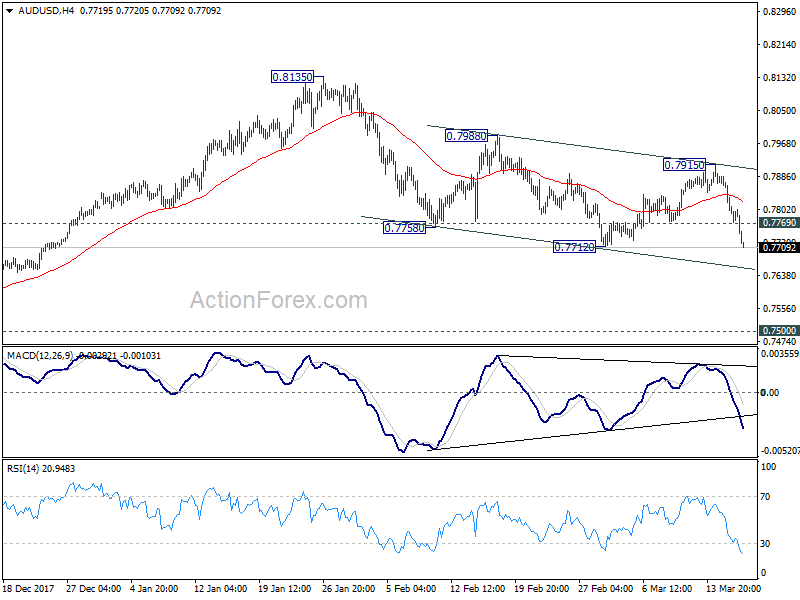
Summary 3/19 – 3/23
Monday, Mar 19, 2018
[php_everywhere instance="1"]
Tuesday, Mar 20, 2018
[php_everywhere instance="2"]
Wednesday, Mar 21, 2018
[php_everywhere instance="3"]
Thursday, Mar 22, 2018
[php_everywhere instance="4"]
Friday, Mar 23, 2018
[php_everywhere instance="5"]
Weekly Economic and Financial Commentary: Inflation Showing Signs of Taking a Bite Out of Growth
U.S. Review
Inflation Showing Signs of Taking a Bite Out of Growth
- Consumer prices rose 0.2 percent in February, taking the yearover- year rate of inflation up to 2.2 percent. Other measures of inflation for the month also showed price pressures building.
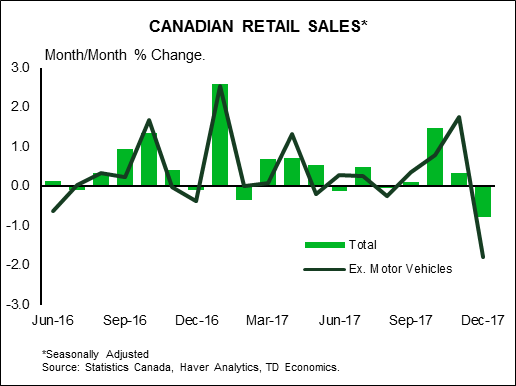
- Retail sales fell for the third straight month in February, reinforcing our view that consumer spending has downshifted to start the year.
- Industrial production bounced back in February after declining 0.3 percent in January. Manufacturing output rose 1.2 percent for the month. Housing starts declined in February after a 10.1 percent surge to start the year.
Inflation Showing Signs of Taking A Bite Out of Growth
Economic data this week signaled that inflation has begun to rise and may be adversely affecting consumer spending. Consumer Price Index (CPI) data showed an increase in the headline inflation rate, a trend that was reinforced by the Producer Price Index and import price data. Retail sales data posted their third month in a row of sales declines, raising questions about the strength of the consumer sector in the first quarter. Housing starts slowed in February following a strong reading in January. Industrial production picked up for the month, reflecting improving fundamentals in the sector.
Retail sales edged down 0.1 percent in February, with broad-based declines in a number of categories. Excluding auto sales, total sales rose 0.2 percent. The closely-watched control group, which feeds into the calculation for GDP, rose a modest 0.1 percent for the month following a flat reading in January. Much like the business investment sector, a stark divergence has emerged between the "soft" consumer confidence data and the "hard" consumer spending data. We maintain the view that first quarter consumer spending is likely to come in softer than expected, held back in part by firmer inflation readings. That said, we do not see evidence of an erosion in consumer fundamentals and expect consumer spending to pick up throughout the rest of this year.
Inflation readings in February continued to support our forecast for a faster pace of price increases this year. Both the headline and core CPI index rose 0.2 percent for the month, taking the headline reading to 2.2 percent on a year-over-year basis. Producer prices rose 0.2 percent, or 2.8 percent on a year-over-year basis. Import prices surprised to the upside, posting a 0.4 percent increase for the month. Nonfuel import prices rose at an impressive 0.5 percent rate, marking the largest monthly gain since 2011. Leading up to the March announcement of steel and aluminum tariffs, import prices for both metals were already up by double digits this past year. We will continue to monitor the data for any further effects from the tariffs on import prices.
Housing starts fell 7.0 percent in February to a 1.24 million-unit pace. Single family starts rose 2.9 percent to a 902,000-unit pace, while the more volatile multi-family starts declined 26.1 percent to a 334,000-unit pace. Housing starts are typically quite volatile in the first quarter, so we are not reading too much into the February decline. We are forecasting total housing starts of 1.31 million this year compared to 1.20 million units last year.
Industrial production bounced back in February, rising 1.1 percent in the wake of January's 0.3 percent decline. Utilities output declined 4.7 percent after rising 1.3 percent in January. Manufacturing output rose 1.2 percent on the month after a downwardly-revised 0.2 percent decline in January. Capacity utilization rose for the month but remains below its historical average, implying that more capacity can be brought online, reducing the need for further business fixed investment. As global and domestic demand builds this year we expect industrial production to expand 3.3 percent in 2018 relative to last year.
U.S. Outlook
Current Account • Wednesday
The current account deficit narrowed to a three-year low of $100.6 billion in Q3 from $124.4 billion in Q2, largely due to higher income payments on foreign assets and a narrower trade deficit in goods and services. The Q3 financial account, the counterpart to the current account in the balance of payments, also showed solid foreign direct investment of more than $95 billion for the quarter. Foreign demand for Treasuries remained strong in Q3, although it has since slowed, and foreigners became net sellers of Treasuries to end 2017. We look for the current account deficit to widen to $129.0 billion in Q4, mainly due to a larger trade deficit, as trade in goods and services makes up most of the current account. The trade deficit rose to $652.2 billion in Q4, and we look for it to widen further this year. Our currency strategy team forecasts that the dollar will depreciate against most major currencies over the coming year, with some of this weakness coming from a wider current account deficit.
Previous: -$100.6B Wells Fargo: -$129.0B Consensus: -$125.0B
FOMC Meeting • Wednesday
While the Federal Open Market Committee (FOMC) left rates unchanged at its January meeting, we look for it to raise the fed funds rate 25 bps at next week's meeting. Inflation has gathered momentum in recent months, with core inflation now running at a 3.1 percent three-month annualized rate in February. Average hourly earnings growth also remained solid in February after a strong 2.8 percent year-over-year gain in January, and the labor market continues to tighten. In light of higher inflation, rising inflation expectations and a solid employment outlook, we now forecast four rate hikes in 2018. Market expectations of a rate hike next week are also largely penciled in, especially after new Fed Chair Jerome Powell indicated a slightly more hawkish outlook during his first congressional testimony a few weeks ago. The FOMC will also update its economic projections and its closely-watched "dot plot" at next week's meeting.
Previous: 1.50% Wells Fargo: 1.75% Consensus: 1.75%
Durable Goods • Friday
January's durable goods report added another mark to recently underwhelming production data, with durable goods orders down 3.6 percent month over month. Looking beyond the weakness in the volatile transportation sector, the data showed a more pronounced slowdown. Core capital goods orders fell 0.1 percent over the month on the heels of a 0.6 percent drop in December.
January's weak durable goods report combined with similar declines in industrial production and factory orders is increasingly becoming at odds with the still-strong survey data reflected in the ISM indices. The ISM manufacturing index hit a 13-year high of 60.8 in February, continuing its recent upward trend. However, the survey data should likely converge with the hard data in the coming months. We look for durable goods orders to rise 1.5 percent in February, but weakness in the core capital goods orders component is likely telling of the slower pace of equipment spending we forecast for Q1.
Previous: -3.6% Wells Fargo: 1.5% Consensus: 1.6% (Month-over-Month)
Global Review
More Signs of Firming in Indian Economy
- Economic news out of India this week was broadly better than expected. That reinforced our view that with some of the structural reforms already implemented, India's economy should be a top performer over the next few years.
- Elsewhere in the global economy, we also learned this week that Chinese retail sales in February were slightly softer than expected, growing at just 9.7 percent year over year, a slowdown from 10.2 percent the month prior.
- In the Eurozone, industrial production fell 1.0 percent in January, which brought down the year-over-year rate to 2.7 percent.
Indian Economy Gaining Momentum
After implementing some measures that slowed the pace of GDP growth in recent years, India's economy remains on track as one of the fastest-growing economies in the world. Economic indicators out of India have generally been better than expected in recent weeks and months, and that theme remained more or less intact this week as well.
The second half of 2017 was marked by a rising rate of inflation in India, which stoked concerns that the Reserve Bank of India might eventually need to raise its repo rate. Since the start of the current year, some of that pressure has eased as inflation has come off the boil. In January, the year-over-year rate of CPI inflation slowed for the first time in six months coming in at just over 5 percent, and we learned this week that in February it slowed further to just 4.4 percent. That was even more of a slowing than the 4.7 percent rate that had been expected and it takes some pressure off the RBI to raise rates at the upcoming April meeting.
We also learned this week that year-over-year growth rate of industrial production in India quickened to 7.5 percent in January, which was more than the 6.4 percent that had been expected. All major categories were positive when compared to where they were a year ago.
The improvement in industrial production is consistent with our real GDP forecast for the Indian economy of 6.7 percent in 2018 before picking up to 7.4 percent in 2019. In each of the next two years, the numbers we have for India's economy are the fastest of any of the economies we cover, but it is not without its challenges.
To be sure, there are some pretty substantial hurdles that have already been cleared. The "demonetization" or removal of larger denomination currencies late in 2016 led to some retrenchment in consumer spending that weighed down growth in the first half of 2017.
The comprehensive rollout of a five-tiered goods and services tax (GST) was introduced in July 2017 to replace the pre-existing and somewhat confusing system which overlapped multiple different taxes at different levels of the government. Both the demonetization and GST were seen as necessary reforms, which weigh on growth in the short-run but help longer term.
The Indian economy grew faster than expected in Q4, lifting the year-over-year growth rate to 7.2 percent. Not all the news at the time was good, however. We observed in a report earlier this month that after the GDP report printed, export growth slowed sharply and consumer spending slowed in the quarter as well. Exports grew 9.1 percent year over year through January, and we learned this week that the figure for February was 4.5 percent. That, combined with a modest narrowing in the trade deficit, suggest some improvement in trade dynamics for the first quarter of 2018.
India has gotten through some growing pains and has more structural reform to do, but data this week show the economy remains on the right track and is gaining momentum.
Global Outlook
Brazilian Economic Activity Index • Monday
The Brazilian economy has continued to recover from a deep recession that occurred over the 2015-2016 period. Real GDP was up 2.1 percent on a year-ago basis in Q4, the fastest pace of growth since Q1-2014. The external sector helped boost economic growth, as real exports climbed 9.1 percent year over year in the fourth quarter. Private consumption and gross fixed capital formation also continued to accelerate in the quarter, signaling a broad-based recovery.
The Brazilian Economic Activity Index, published on a monthly basis by the central bank, will offer the first look at whether the momentum at the end of 2017 was carried into the new year. We remain positive on the direction of the Brazilian economy, though political turmoil remains a key risk to the outlook. Our current forecast for Brazilian economic growth is 2.8 percent in 2018 and 3.3 percent in 2019
Previous: 1.4% Consensus: -0.40% (Month-over-Month)
Bank of England Meeting • Thursday
A slew of economic data is to be reported next week in the United Kingdom, culminating in a meeting of the Monetary Policy Committee (MPC) of the Bank of England (BoE). The February consumer price index will be reported on Tuesday, and policymakers will be keeping a close eye on the currently above-target inflation numbers. Data on weekly earnings and unemployment will print on Wednesday, and Thursday will see retail sales data and a decision by the MPC on monetary policy.
BoE policymakers face a different set of challenges relative to most of their developed-economy counterparts. Inflation in the U.K. is above- rather than below-target, while economic growth has not noticeably strengthened as it has in the United States and the Eurozone. Stubbornly high inflation and/or faster wage growth would help reassure policymakers that additional rate hikes are warranted in the coming months.
Previous: 0.50% Wells Fargo: 0.50% Consensus: 0.50% (Bank Rate)
Canadian CPI • Friday
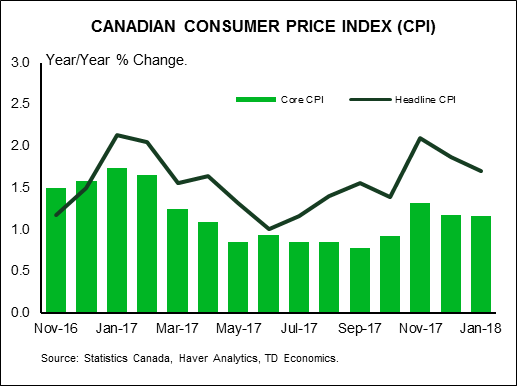
Despite a strong economic performance in 2017, inflation remained contained in Canada last year, with core price growth remaining comfortably within the Bank of Canada's (BoC) target band. In its policy statement released last week, the BoC noted that "inflation is fluctuating because of temporary factors related to gasoline, electricity, and minimum wages."
The BoC has been quick to respond to favorable economic data with tighter monetary policy. Economic growth slowed in H2-2017 after a breakneck pace in H1, and employment has outright declined through the first two months of 2018 after robust growth in Q4-2017. High household debt levels remain an ongoing concern for both us and policymakers at the BoC. With economic growth coming back down to earth and inflation in check, the BoC can afford to remain on hold for the time being as it continues to evaluate the incoming data.
Previous: 1.7% Wells Fargo: 1.8% Consensus: 2.0% (Year-over-Year)
Point of View
Interest Rate Watch
Unease of Policy Resolution
Economic policy experiments offer the promise of benefits (greater growth) but also bring the possibility of greater risks (volatile prices for credit, currencies and goods). Currently, U.S. economic policy is carrying on two experiments at once: fiscal stimulus as the economy operates with a minimal output gap and monetary policy that both raises the price of credit (rate hikes) and reduces the supply of credit (balance sheet reductions). We remain concerned about the results.
Two Untried Experiments at Once
As illustrated in the top graph, higher fiscal deficits for the next two years will bring more Treasury issuance to market at a time when the Federal Reserve has stated its intentions to reduce its balance sheet and thereby reduce its demand for Treasuries.
Moreover, increased Treasury issuance is now being carried out in an economic environment of rising inflation and a weaker dollar (middle graph). Our concern here is that tariff talk will tend to bias inflation upward and lower the dollar's value relative to the current outlook.
Higher Short-Term Rates Ahead
The Fed will be tested on its commitment to 2 percent inflation and a reduction in the balance sheet in the face of widening fiscal deficits. In our Monthly Economic Outlook released this week, we revised our fed funds forecast to four rate hikes in 2018, up from our previous forecast of three. Fiscal stimulus is helping to drive economic growth above potential growth late in the economic cycle, and we expect the Fed to respond accordingly. Widening deficits and balance sheet reductions will occur in the face of a continued path higher for the fed funds rate in 2018 and 2019 (bottom chart).
Economic Mythbusters
From our view, there are too many moving parts in this experiment. Expansionary fiscal policy in the face of tighter monetary policy sets up numerous tensions in interest rates, the dollar and growth. We are cautious on the view that policymakers will be able to coordinate both fiscal and monetary policy to a soft landing, given the cross winds of inflation and the downdraft of the dollar.
Credit Market Insights
Is Household Debt a Growing Worry?
Last week, the Federal Reserve released the Financial Accounts of the United States for Q4-2017. The release points to stable economic conditions among households. The data revealed that household net worth increased for the ninth consecutive quarter. Each quarter has continuously surpassed the all-time high level of household net worth, which currently stands at $98.7 trillion. Rising $2.1 trillion (NSA) in Q4, much of the gain was due to increased financial assets, a likely effect of the continuation in the bull market over the period.
Total household borrowing, however, increased $789.5 billion, at a seasonally adjusted annual rate (SAAR), over Q4. This was the largest quarterly increase since Q4-2007. A large contributor to this rise was the notable increase of $292.1 billion (SAAR) in consumer credit, which is a historic high quarterly increase for the series. Although we acknowledge consumer deleveraging may have neared an end in this cycle, monthly debt and other obligation payments remain near historic lows. Furthermore, liabilities as a percent of assets stand at their lowest level not only in this expansion, but since Q1-2000.
At present, household debt dynamics do not impart worry to our outlook, as the fourth quarter data show stable conditions. Although consumer spending started the year weakly, we expect stable credit conditions this year to foster steady levels of consumer spending.
Topic of the Week
Rising Inflation, Rising Fed Funds Path
Low inflation has kept the Fed on a restrained path of tightening so far in this cycle. Recent inflation data, however, have reinforced our view that price pressures are picking up. Core readings of both the Consumer Price Index (CPI) and PCE deflator posted solid gains to start the year. This week's core CPI print backed up an impressive gain in January and has left core CPI over the past three months rising at the fastest clip in 10 years.
Alternative measures of core inflation have also perked up, while input costs—including labor—are rising. Notably, markets have started to come around to the prospects for higher inflation, fueled by bets that fiscal stimulus at this late stage of the economic cycle will finally lead to a breakout in inflation. The weakening trend in the dollar and recent steel and aluminum tariffs also stand to lift inflation, albeit only modestly.
We still expect the pickup in inflation to remain orderly. Core inflation tends to adjust slowly around its longerterm trend, while structural headwinds that have weighed on inflation are not suddenly disappearing. Profit margins also look historically high economy-wide, suggesting at least some scope for businesses to absorb higher input costs, although this need not be the case if productivity improves. While the recently-passed tax plan will support household spending, inflation will likely be contained by stronger capital spending boosting productivity and lower tax rates helping firms absorb rising labor costs. The potential for trade restrictions to escalate, however, represents a meaningful upside risk to inflation.
We look for the PCE deflator to reach 2 percent as soon as next quarter, with core PCE inflation rising to 2.0 percent by Q4. The forward momentum and higher inflation expectations has led us to raise our forecast for the fed funds rate this year. We now expect the Fed to raise rates four times this year, rather than the three hikes estimated in the Fed's December projections.
The Weekly Bottom Line: U.S. Economic Boom to Last Through 2019
U.S. Highlights
- Our outlook for the U.S. economy through 2019 got revised up this week, as additional fiscal stimulus helps boost the outlook for domestic demand growth.
- The inflation reading for February remains consistent with the view that price pressures are gradually building.
- The sunny outlook is not without downside risks. Higher interest rates have a tendency to expose vulnerabilities, and the threat of a global trade war is becoming more real.
Canadian Highlights
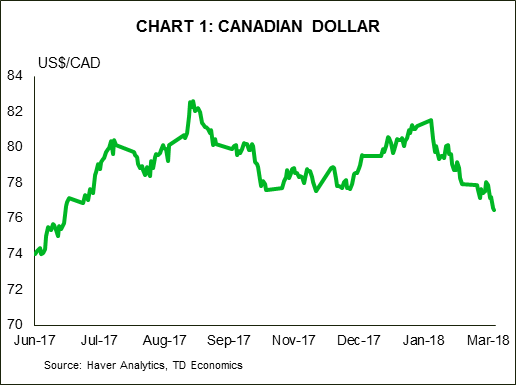
- The loonie fell to 76 US cents following a dovish tone from the Bank of Canada Governor and soft economic data.
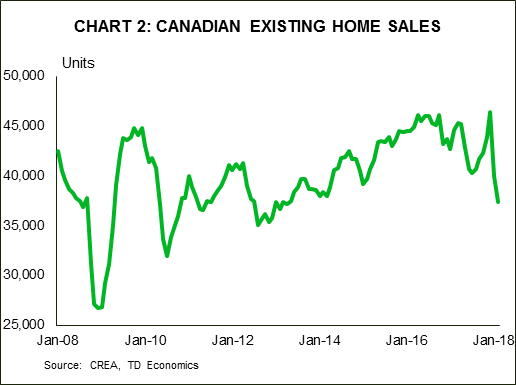
- Existing home sales slid 6.5% in February, marking a second consecutive drop and the lowest level seen since early-2013.
- Following a banner year in 2017 in which the economy grew by 3.0%, growth in Canada is expected to cool to around 2.0% over the next two years according to TD Economics' new Quarterly Economic Forecast.
U.S. - Economic Boom to Last Through 2019
This week we released our updated quarterly forecast for the U.S. and global economy. Our outlook for the U.S. economy was revised up relative to our December forecast, as the federal budget bill passed by Congress in February adds more stimulus to an economy that is already running hot. Underlying this improved outlook is a view that domestic demand will grow more strongly, supported by fiscal stimulus. Personal income tax cuts provide a lift to disposable income growth and consumer spending, while corporate tax reform and the boost to federal spending should translate into stronger business investment.
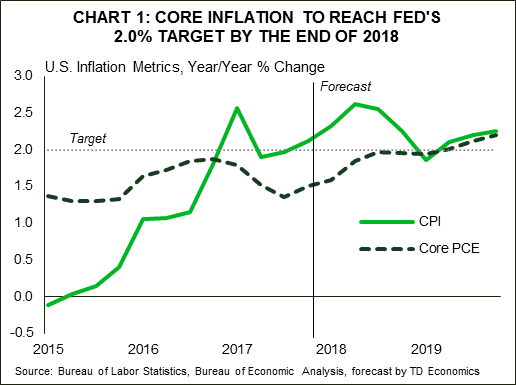
With economic growth expected to average close to 3% over the remainder of this year, capacity pressures are expected to build. Not only should this incent firms to invest, but scarcer labor should support wage growth. Our outlook anticipates that underlying inflation in the U.S. will hit the Fed's target of 2.0% before the end of the year, and stay slightly above target through 2019 (Chart 1). The CPI data for February supports this view, as price pressures ticked up a touch. Headline inflation rose to 2.2% y/y (+0.1 from 2.1% in January), while core inflation held at a 1.8% y/y pace.
After February's consensus-busting job gains of 313k, we anticipate monthly job gains of 200k in upcoming months, roughly in line with its average since the Great Recession's end. This should push the unemployment rate, which already sits at an eighteen-year low of 4.1%, even lower, reaching 3.7% by the end of 2019. Moreover, rising wages should encourage greater labor force participation enough to offset the drag from population aging.
In contrast to the very strong medium-term outlook, the outlook for the first quarter of 2018 is somewhat weaker. Retail sales in the first two months of this year have disappointed expectations, suggesting much softer consumer spending in the first quarter than the 3.8% (annualized) growth recorded at the end of 2017. We anticipate spending growth to re-accelerate in the second quarter, supported by the receipt of tax refunds, strengthening wage growth, and reduced personal income tax rates.
Booming economic activity together with building price pressures suggest that the Federal Reserve is likely to continue to raise interest rates this year and next. With three rate hikes on tap this year, the upper end of the range of the Fed's policy rate should rise to 2.25% by year end. Moreover, better growth for 2019 suggests an additional 75bps of rate hikes, bringing the upper end of the range to 3.0% at the end of 2019.
This largely sunny outlook for the U.S. and global economy is not all blue skies. For one, higher interest rates have a tendency to expose vulnerabilities as firms and households spend more of their income on borrowing costs. While years of deleveraging have left U.S. households in good stead to handle higher rates, corporate debt has outpaced GDP growth in recent years. Lastly, the U.S. administration's imposition of steel and aluminum tariffs and rumored forthcoming broad action against Chinese imports is a sign that global trade disruptions are more likely than previously appreciated (Chart 2).

Canada - Cautious Approach To Tightening
Soft economic data and a dovish tone from the Bank of Canada governor sent the loonie tumbling to 76 US cents this week, reaching its lowest level since mid-2017. Equity markets fared a bit better, with the S&P/TSX managing to eke out a gain on the week.
On the data front, existing home sales fell 6.5% in February, marking the second consecutive monthly decline and hitting a level of sales not seen in five years. While certainly a weak performance, some give back was expected following the surge in activity that took place late last year as buyers rushed to close deals ahead of the implementation of the new B20 rules. The worst is likely in the rear view mirror, but regions like B.C. and Ontario could see further pressure given these markets are particularly sensitive to the tightening in regulatory conditions - with another round of regulation introduced in the B.C. budget last month. On the whole, sales are expected to be soft in the near term, before finding support late in the year.
Indeed, our updated Quarterly Economic Forecast highlights the fact that housing fundamentals remain broadly constructive, with income gains having outpaced the rise in borrowing costs - a trend that is expected to continue as the housing market cools. That said, the near term weakness will lead to a contraction in residential investment this year, weighing on overall economic growth. Exports too, are likely to be soft, with manufacturing and exports starting the year off on a back-foot, leading net trade to be a drag on growth this year as well. As such, we have downgraded our outlook for real GDP growth to 2.0% in 2018 (previously 2.4%).
For the Bank of Canada, there are some push-pull forces that it must consider in setting monetary policy. While economic growth appears to have lost some momentum, the domestic economy remains healthy. Low unemployment will support consumer spending with robust demand materializing in a pick-up in business investment. Taken together, this should push core inflation up to the Bank's 2% target in the coming months, suggesting a bias towards higher rates. At the same time, rising interest rates in the U.S. are expected to generate an implicit tightening north of the border through higher long-term bond yields, thus requiring less urgency for rate hikes in Canada. Moreover, a number of uncertainties cloud the outlook and could push the Canadian economy off this more sustainable growth path.
While Canada has escaped the steel and aluminum tariffs recently announced by the Trump Administration (for now), NAFTA negotiations are ongoing with an outcome still quite uncertain. Moreover, household debt levels remain elevated. Data out this week showed that the household debt-to-income ratio held relatively steady at 170.4% in the fourth quarter of 2017. Moreover, the full impact of housing market regulations, which could alter the outlook in either direction, remains to be seen.
As such, it makes sense for the Bank of Canada to take a cautious approach as it removes stimulus. In a speech this week, Governor Poloz made it clear that accommodative monetary policy is not going away anytime soon. All told, we remain of the view that a gradual pace of hikes is in store, with the next unlikely to come before mid-year.
Canada: Upcoming Key Economic Releases
Consumer Price Index - February
Release Date: March 23, 2018
Previous Result: 0.7% m/m nsa , 1.7% y/y, Index: 131.7
TD Forecast: 0.4% m/m nsa, 2.0% y/y, Index: 132.3
Consensus: 0.5% m/m nsa, 2.0% y/y, Index: 132.4
We expect headline CPI to reach its target rate of 2.0% y/y, reflecting a 0.4% m/m gain on the month (flat when seasonally adjusted). Energy prices were flat on balance, with lower gasoline prices offset by a likely sharp increase in natural gas. Food price growth should moderate, led by the food-away-from-home category which jumped in January on the Ontario wage hike. Elsewhere, the story is the same, with shelter prices reflecting more modest new home price pressures offset by rising mortgage interest costs. CAD exchange rate movements are relatively benign with USDCAD little changed in February after reversing much of its weakness in January. Exclusion-based core measures (ex food and energy, CPIX) should move marginally higher while core inflation may continue to respond to the past absorption in labour market slack and move higher. Looking ahead, we expect headline inflation to hover just above 2%.
 Retail Sales - January
Release Date: March 23, 2018
Previous Result: -0.8%, ex-auto: -1.8%
TD Forecast: 1.1%, ex-auto: 0.9%
Consensus: 1.2%, ex-auto: 0.9%
Retail sales are forecast to rise by 1.1% m/m in January, led by auto sales and a rebound in the core. December was one of the worst months on record for ex autos and gasoline sales and we expect some reversal. While we expect autos to support the monthly print, our forecast is consistent with motor vehicle sales decelerating on a y/y basis after averaging 9% y/y in 2017. Gasoline station receipts should also make a positive contribution on higher prices. However, higher prices for consumer goods as a whole will weigh on real retail sales, which should come in near 0.8% m/m and help anchor consumer spending for Q1 at 2.8%, significantly lower than the 3.5% average in 2017.
US Fed and BoE to Guide Markets
The US dollar is mixed against major pairs ahead of the March Federal Open Market Committee (FOMC) meeting. The Fed is expected to deliver its fist interest rate lift under Chair Jerome Powell. The Fed will publish its rate statement on Wednesday, March 21 at 2:00 pm EDT. Strong data has fuelled the dollar revival but the drama in the White House and tariff uncertainty are keeping the currency down against safe haven currencies. The CME FedWatch is showing a 94.4 percent probability of a 25 basis points rate hike, which has already been priced into the USD, with a market eager to hear Chair Powell’s thoughts on the future path of monetary policy during his first post FOMC press conference.
- Fed expected to hike interest rates by 25 bps
- Brexit and Bank of England (BoE) to guide GBP
- CAD will look to retail sales and inflation data for support
Dollar to Look for Chair Powell for Guidance
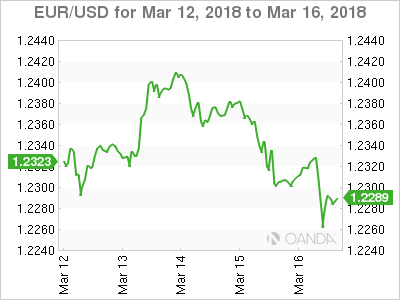 The EUR/USD lost 0.15 percent in the last five days. The single currency is trading at 1.2284 with a rising USD ahead of the Federal Open Market Committee (FOMC) on Wednesday. The Fed has forecasted three to four rate hikes this year depending on the economic growth indicators with Fed members supporting the message through different statements.
The Fed appears on track to deliver the first rate hike of the Powell era, taking the interest rate to a range of 150–175 basis points. Economic data and the central bank have been dollar positive, but the personal moves in Washington and the uncertainty on trade have reduced some of the dollar gains.
The tariffs announced by the US President have begun to elicit retaliatory responses from nations that have not been excluded, even if the full list of exclusions are not public yet. The protectionist measures have created controversy even within the Republican party as it bring a trade war closer to a reality.
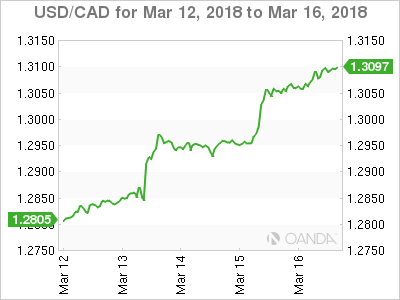 The USD/CAD rose 2.23 percent in the last five trading days. The currency pair is trading at 10.3095 touching 8 month lows as trade with the US is still an uncertain topic and the head of the Bank of Canada (BoC) has signalled that higher rates will be slower in coming. The Fed on the other hand is getting ready for its first interest rate lift under the stewardship of Jerome Powell.
The Canadian economic calendar will have few major entries and only until the end of the week. Retail sales and the consumer price index (CPI) will be released on Friday, March 23 at 8:30 am EDT. Core retail sales fell by 1.8 percent last month and a recovery is expected while inflation rose by 0.7 percent.
The loonie has been under pressure all year. The tariffs announced by the White House did not hit Canada but is still influencing the forecast on the future of NAFTA with Donald Trump still active on twitter singling out the surplus with its Northern neighbour. The slowdown of the economy was anticipated but the two factors combined have the currency at a 8 month low as the monetary policy divergence is only going to get wider.
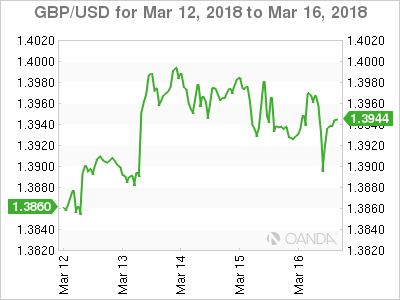 The GBP/USD gained 0.62 percent during the week. Cable is trading at 1.3935 ahead of the Brexit summit next week. The hopes for reaching a transition deal are up and have boosted the currency. The Bank of England (BoE) warned this week that regulators in the UK and the EU are not doing enough to prevent material risks from the derivatives market even if there is a transition deal in place.
With optimism riding high about reaching a deal the central bank will publish its Monetary policy summary on Thursday, March 22 at 8:00 am EDT. The BoE is forecasted to leave the rate at 0.50 percent with a vote count showing a unanimous 9 for keeping rates untouched.
UK inflation data and average earning will be released during the week setting the stage for the central bank and the Brexit summit on Thursday and Friday.
Market events to watch this week:
Monday, March 19
- 8:30pm AUD Monetary Policy Meeting Minutes
Tuesday, March 20
- 5:30am GBP CPI y/y
Wednesday, March 21
- 5:30am GBP Average Earnings Index 3m/y
- 10:30am USD Crude Oil Inventories
- 2:00pm USD FOMC Economic Projections
- 2:00pm USD FOMC Statement
- 2:00pm USD Federal Funds Rate
- 2:30pm USD FOMC Press Conference
- 4:00pm NZD RBNZ Rate Statement
- 8:30pm AUD Employment Change
Thursday, March 22
- 5:30am GBP Retail Sales m/m
- 8:00am GBP MPC Official Bank Rate Votes
- 8:00am GBP Monetary Policy Summary
- 8:00am GBP Official Bank Rate
Friday, March 23
- 8:30am CAD CPI m/m
- 8:30am CAD Core Retail Sales m/m
- 8:30am USD Core Durable Goods Orders m/m
*All times EDT
EURUSD Falls Further after Upbeat US Data; Focus Turns Towards FOMC Meeting Next Week
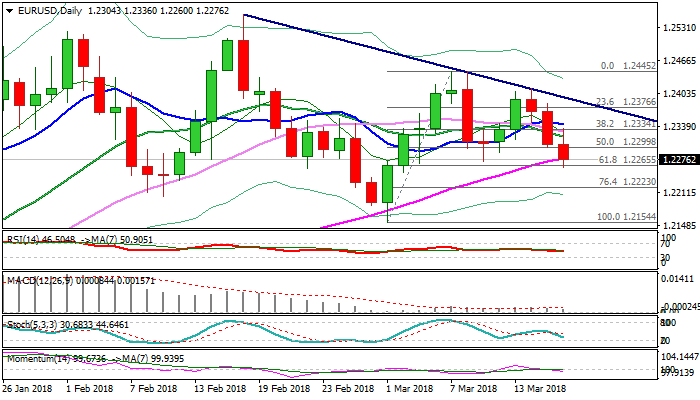
The Euro probed below key supports at 1.2271/65 (55SMA / Fibo 61.8% of 1.2154/1.2445 upleg) as the dollar firmed after upbeat IP and Michigan data.
The pair is on track for daily close in the cloud and below1.2271/65 pivots, which would generate stronger bearish signal.
The notion is supported by the second bearish weekly candle with long upper shadow.
Extension below 55SMA would look for test of 1.2205 (09 Feb low) and may stretch towards key support at 1.2154 (01 Mar).
FOMC policy meeting will be closely watched as key event next week, with hawkish stance of the central bank expected to boost dollar.
However, EURUSD needs break below 1.2154 low to generate reversal signal and open way for stronger retracement of larger 1.1553/1.2555 ascend.
Res: 1.2300; 1.2336; 1.2353; 1.2383
Sup: 1.2260; 1.2223; 1.2205; 1.2154
Week Ahead – All Eyes on FOMC Projections; Pound in Spotlight as UK Data, BoE Awaited
It will be a crucial week for the greenback and sterling next week as the Federal Reserve and Bank of England meet to decide on monetary policy. It will also be an important week for the UK in terms of data as inflation, jobs and retail sales figures are released. Employment numbers are expected out of Australia too and Canada will be reporting inflation and retail sales figures as well. In the Eurozone, the focus will be on the March flash PMIs, while a policy meeting by the Reserve Bank of New Zealand will be another central bank event to watch.
Political issues could also dominate forex markets next week as European Union leaders meet at their Spring summit to discuss the Brexit transition deal, and G20 heads of government gather in Buenos Aires, Argentina, on March 19-20 with trade protectionism likely to become a contentious topic.
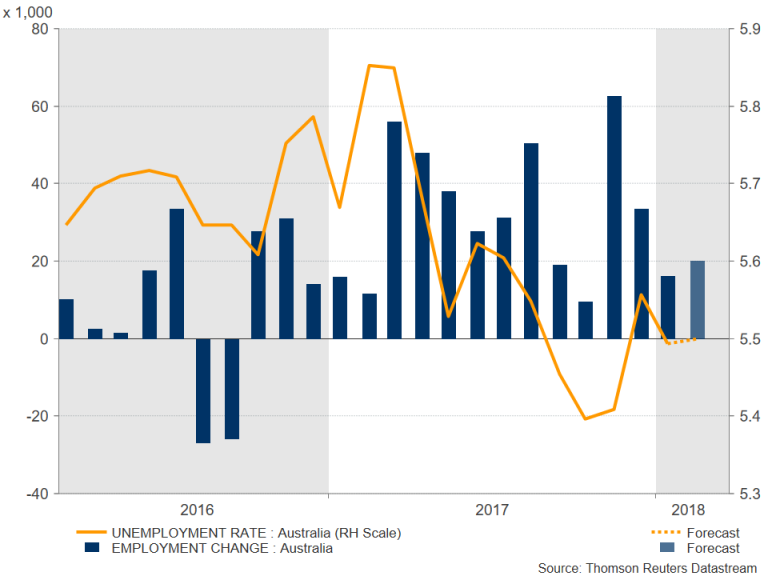
AUD and NZD look vulnerable ahead of Aussie jobs and RBNZ
Jobs growth slowed somewhat in Australia in January as an unexpected plunge in full-time employment overshadowed the positive headline figure posting its longest run of growth on record. Any further signs of weakness in the labour market in Thursday’s employment report for February could drag the Australian dollar lower, while Tuesday’s minutes of the RBA’s March policy meeting pose another risk. The currency is looking vulnerable after losing upside momentum this week when it failed to close above the $0.79 resistance.
 Its New Zealand counterpart also lost some steam after GDP data disappointed this week. New Zealand’s economy grew by a respectable 0.6% rate in the final three months of 2017, but this was slightly below estimates and not strong enough to bring forward expectations of how soon the RBNZ will raise rates. The RBNZ holds its monetary policy meeting on Thursday. No change in rates is anticipated but the kiwi could see some volatility if the central bank changes its language on the outlook, particularly if it sees a negative impact from the increasing protectionist stance of the United States.
Canadian data unlikely to move loonie after dovish Bank of Canada
Sticking with commodity-linked currencies, the Canadian dollar has been an underperformer against the US dollar this year as Trump’s trade policies have weighed on the currency. However, just as some optimism started to set in about the progress of the NAFTA talks, antagonistic comments by US President Trump and very dovish remarks by the Bank of Canada’s Steven Poloz drove dollar/loonie above the key resistance area of 1.30 this week. Against this backdrop, Friday’s CPI data for February and retail sales numbers for January may fail to generate much reaction unless there’s a big deviation from the expectations.
Japan CPI to give strengthening yen a reprieve?
Inflation figures out of Japan next week may add to the upside pressure currently facing the yen, which has been benefiting from the US policy uncertainty as well as a political scandal in Japan. The country’s core CPI rate, due on Thursday, is forecast to inch up from 0.9% to 1.0% year-on-year in February. However, with Bank of Japan policymakers recently sounding more forceful in reiterating that the bank is in no rush to exit its massive stimulus program, the yen will likely remain more sensitive to risk sentiment than domestic data. Reaction to Monday’s Summary of Opinions of the March policy meeting is also expected to be muted as the BoJ will probably keep to familiar script and not want to fuel further talk of policy normalization. Trade data on February exports and imports will be watched too on Monday, along with the Nikkei/Markit flash manufacturing PMI on Thursday.
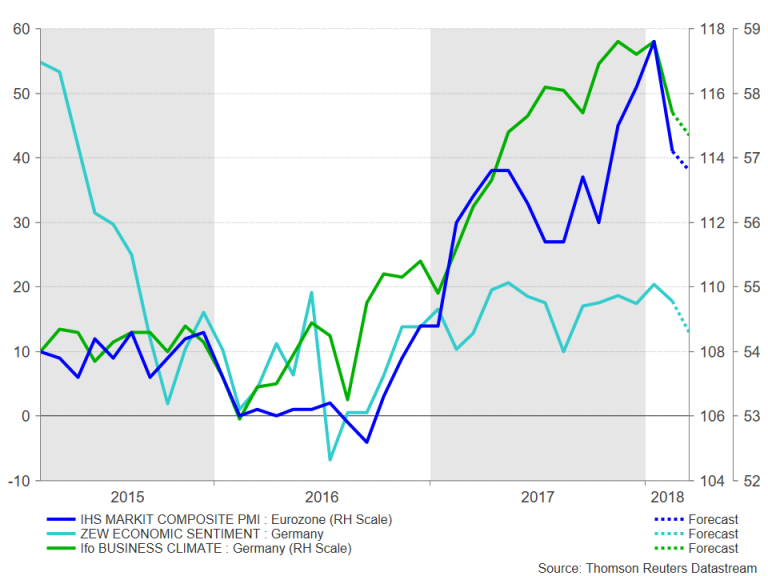
Euro to seek direction from flash PMIs
After getting knocked down by a dovish Mario Draghi for the third time in a month on Wednesday, the euro will be looking to next week’s flash PMI readings from IHS Markit for some support. However, euro bulls will likely be disappointed as business sentiment across the Eurozone is expected to dip further in March. Both the manufacturing and the services PMIs are forecast to edge marginally lower in March’s preliminary reading on Thursday. The composite PMI for the region is expected to fall by 0.3 points to 56.8.
Although euro area activity remains at healthy levels despite a modest slowdown in the first quarter of 2018, a stronger currency and the threat of US tariffs could be starting to take a toll on European businesses’ outlook. There could be more proof of this in Germany’s closely tracked business survey gauges, which are also expected to worsen slightly during the month. The ZEW economic sentiment index, due on Tuesday, is forecast to decline from 17.8 to 13.0 in March, while the Ifo’s business climate index is expected to fall from 115.4 to 114.7 on Thursday.
 Pound set for a flurry of activity
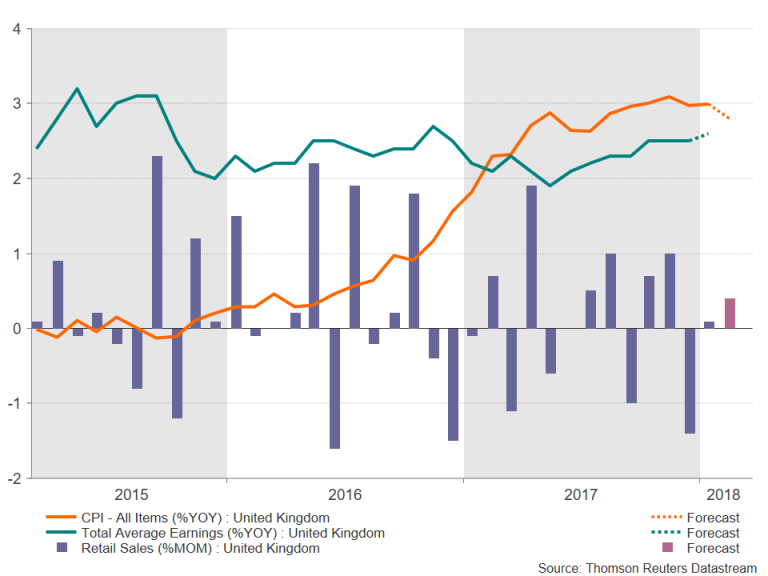
Sterling’s recovery from March’s 7-week low of $1.3710 appears to have met a wall at the $1.40 level. Major risk events next week will determine if the pound will be able to overcome this resistance or reverse lower. The first test will come on Tuesday with the latest UK inflation figures. The annual rate of change in the headline consumer price index is expected to moderate to 2.8% in February from 3.0% in January. The core rate is forecast to fall to 2.5% from 2.7%. On Wednesday, the labour market report for January will be watched for any evidence of an acceleration in wage growth. Like in the US, the unemployment rate in Britain is currently near multi-decade lows. The jobless rate is expected to hold steady at 4.4%. However, wage growth remains anaemic despite the tight labour market. Average weekly earnings are forecast to quicken slightly to 2.6% y/y in the three months to January. Any signs of a convincing pick-up in pay growth would give the Bank of England more reason to maintain a hawkish tone when it meets on Wednesday and Thursday. The BoE will also be able to sift through Thursday’s retail sales figures before it announces its decision. UK retail sales are expected to grow by 0.4% month-on-month in February, rebounding from the slump in the prior two months.
 A solid set of figures next week would back the BoE’s thinking that some withdrawal of monetary stimulus is needed, possibly as early as May. However, apart from data, there is another pre-condition for the Bank for a May rate hike and that is whether or not the UK and the European Union will agree on a transition deal at the EU summit taking place on March 22-23.
News reports currently suggest the UK and the EU are close to clinching a deal. An agreement would remove a layer of uncertainty for British firms and clear the way for the BoE to raise rates in May. However, a no deal could push back a rate hike until August or November and trigger a sharp sell-off in the pound.
Fed to raise rates but new dot plot to take centre stage
The US economic calendar will be a lighter one next week but the March FOMC meeting should ensure the dollar attracts plenty of attention. The major releases will include existing home sales for February on Wednesday, the IHS Markit flash PMIs for March on Thursday, and durable goods orders and new home sales for February on Friday. The data are unlikely to grab the usual interest in a week when the Fed publishes its latest views on the economy and as all recent evidence converges to only modest growth in the first quarter, with analysts sharply paring back their initial bullish GDP forecasts for the quarter.
New Fed chief Jerome Powell will chair his first FOMC meeting on Tuesday and Wednesday with the consensus being that the committee will decide to raise the fed funds rate by 25 basis points to 1.50%-1.75%. With a rate hike being more or less fully priced in by the markets, the bigger focus will be the Fed’s quarterly projections, and in particular, the new dot plot chart, which draws out the FOMC’s predicted path of interest rates. The most probable outcome is that Fed policymakers will maintain a cautious stance and stick to median forecasts of three rate hikes but with a slight bias towards four moves. A hawkish dot plot could provide the dollar with a bit of a lift, though this would also risk triggering another panic in bond and equity markets. Not-so-hawkish projections on the other hand could push the dollar deeper into bearish territory.
Australia & New Zealand Weekly: Near Term Positives Set to Fade for Commodities
Week beginning 19 March 2018
- Near term positives set to fade for commodities.
- Australia: RBA minutes, Westpac-MI leading index, labour force.
- NZ: RBNZ policy decision and targets review, Westpac-MM consumer confidence.
- China: property prices.
- Euro Area: EU Summit.
- US: FOMC policy decision.
- UK: BoE policy decision.
- Markit flash PMIs.
- Key economic & financial forecasts.
Information contained in this report current as at 16 March 2018.
Near Term Positives Set to Fade for Commodities
Westpac has revised its near term forecasts for iron ore and met coal, holding them around current levels to the September quarter before they correct into 2019 and hit a low in late 2019 or early 2020. Driving these revisions have been the changes to our economic growth forecasts, the impact of Chinese industrial/environmental policies and the supply response of commodity producers.
Firstly, global activity currently is currently much stronger than our earlier expectations. The broad global demand indictors (global PMIs, industrial production and trade) ended 2017 on a very strong note and continued to strengthen through early 2018. Added to this are the upwards revisions we have made to our US and global growth forecasts. Since the start of the year there has been a significant shift in the stance of US fiscal policy just as the economy was gaining momentum. With the unemployment rate of 4.1% comfortably below the estimates of full employment (4.5%), it arguably raises some concerns about the possibility of the economy overheating sometime soon. Arguably, we have not seen a comparable policy "mix" since the 1960's. As a result Westpac has lifted its forecasts for US growth from 2.5% in 2018 and 2.2% in 2019 to 3.0% and 2.5% respectively and revised our forecast for global growth from 3.8% in 2018 to 3.9%.
Secondly, we now have a better understanding of how the environmental policies to improve air quality, combined with those aimed at restructuring the Chinese steel industry, are impacting demand for iron ore and coal. The controls put in place to reduce air pollution resulted in the closure of smaller, less efficient furnaces diverting steel production to larger more efficient furnaces. An important note here is that larger furnaces tend to use more imported ore as they are often located closer to the coast. And these larger furnaces are also under pressure to reduce emissions, as well as improve overall efficiencies, so they have increasingly turned to the higher grades of imported ore. As such, this focus on environmental outcomes and efficiency has directly led to an increase in demand for imported ore and, in particular, higher grades of ore. This explains why the discount for 58%fe compared to 62%fe) has widened to 44% in February compared to an average of 22% in 2016. President Xi Jinping has delivered blue skies to the middle classes, something that is not going to be easy to take away.
 Thirdly, through 2017 there was a concentrated clampdown on illegal Electric Induction Furnaces (EIF) which, by some estimates, took as much as 49.4mt out of Chinese steel production in the year. This illegal steel production is not measured in the official data, whereas the lift in production from furnaces taking up the slack is measured. Compared to the official steel output, 49.4mt loss in EIF production represents around 6% of 2016 output which is more than the 4% increase in official steel production reported in 2017. That is, the measured rise in official steel production in 2017 was due to the closure of EIFs and not new output. EIFs use a lot more scrap steel that blast furnaces so not only did diverting production to blast furnaces increase the demand for imported ore but it also lifted the demand for iron ore overall.
 And finally, as smaller blast furnaces were being closed, local Chinese iron ore mines were also reducing output despite the strong support of higher domestic ore prices. Through the year to December 2017, Chinese ore production contracted around 9% and we suspect this has continued into early 2018. Therefore, even as demand for domestic ore declined with the closure of smaller furnaces, ore supply also contracted leaving the price of domestic ore well supported. Furthermore, the adjustment in both legal and illegal steel capacity, at the timeof very low steel inventories, helps explain why steel prices, and thus margins at steel mills, remained well supported through 2017. These strong margins at steel mills enabled purchasers to bid up the price of higher grades of iron ore.
 Even the rise in Chinese port inventories to new record highs has to be considered in the light of this increase in demand for imported ore. It is true that inventories are at record highs compared to steel production but this doesn't take into account that; a) demand for imported ore has risen significantly this year, and b) most of the ore in inventories is reported to be of lower grade ores. If you compare inventories to the current level of imports, they are high but do not appear to be excessive so part of the build may be a deliberate lift to maintain import coverage.
 At the same time, a lift in the supply of ore, particularly for the higher grades, does not appear to have fully met this increase in demand. Total imports are almost 5% higher in 2017 but output from Australian and Brazil lagged expectations with no perceivable lift from the more marginal suppliers despite the higher than expected prices. Total imports, which are best described as flat since 2017Q1, are currently just holding trend.
So 2018 started with a very positive environment for iron ore even as steel output eased in the second half of 2017. Going forward, steel output should correct modestly in line with a further moderation in Chinese construction activity. Construction activity already slowed at end 2017, falling back to 5%yr in December, with little chance of a recovery from here as the Chinese economy slows and credit conditions tighten. Ore supply should also lift from the dominant exporters as margins remain extremely attractive further pressuring prices later in the forecast horizon. We see the 62%fe (cfr) falling to US$60/t be end 2018 and a low of US$52/t in late 2019.
 With met coal, Australian production has suffered ongoing disruptions from cyclones, floods, industrial disputes and infrastructure delays. Exports from Queensland, which is the largest supplier of met coal, have broadly gone sideways since early 2014 except for the brief but significant disruption caused by cyclone Debbie in April 2017. Given that Australia is the main supplier of met coal in the seaborne market, and thus overall supply is lagging behind demand, it is only natural that prices have been well supported. We are looking for Qld coking coal to hold around US$230/t to the September quarter before easing back to US$220/t in the December quarter and then hitting a low of US$130/t at the end of 2019.
 The week that was
In the past week, surging business confidence and a sense of positivity amongst consumers has been reported for Australia; at the same time however, political and economic confidence in the US has taken a hit.
Business conditions, as reported by the NAB business survey, hit a record high in Feb back to 1994. Confidence edged back in the month, but remains at an above-average level. The strength in conditions has broadened by state, with strong conditions now being reported in NSW, Victoria and Queensland. However, by industry, there remains a material divergence. Momentum is most apparent in the goods producing industries of construction, manufacturing and mining. Of these industries, the construction and manufacturing sectors are benefiting from elevated levels of residential construction activity as well as the strong uptrend in public and private non-residential construction and infrastructure investment. Meanwhile, mining is profiting from the elevated level of commodity prices and Australian producers' low cost structure. Conditions in the business and consumer sectors are more subdued, but still much improved. Abstracting from monthly volatility, the Feb survey points to continued robust demand for labour and a desire to invest. However, evident in official ABS releases, this investment is lopsided, with strength in construction, but not in non-mining equipment spending.
The Australian Chamber Westpac Survey of Industrial Trends offers a deeper investigation of the state of Australian manufacturing. Though overall activity and new orders have pulled back from their late-2017 highs, they remain at elevated levels versus history. Further, export orders continue to track higher. Looking ahead, expectations for the coming six months are very positive. While investment intentions have turned down, they are still indicative of solid growth in equipment and construction spending. The need to invest is structural as well as cyclical: the survey detail highlights that capacity is a key impediment to growth.
Turning then to consumer sentiment, the Westpac-MI survey printed at 103, a touch higher than February and the fourth consecutive reading above the 100 optimist/ pessimist divide. Family finances versus a year ago and expectations for the year ahead both improved in the month, as did year-ahead expectations for the economy. In contrast, the five-year view on the economy deteriorated in the month, perhaps in response to rising trade frictions following President Trump's tariff announcement. Supporting this view, 'international conditions' had the highest news recall in 2 ½ years and was regarded unfavourably. Taking a longer-term view, economic conditions are above average; along with continued strength in employment growth, this is resulting in households having strong confidence in their job prospects. That said, family finances remain sub-par and this is affecting spending decisions. 'Time to buy a dwelling' remains well below average on affordability concerns. Notably, the 'time to buy' index for Sydney and Melbourne is much lower than elsewhere and house price expectations in NSW are materially lower than elsewhere.
Moving offshore, the first stop is New Zealand. There, Q4 GDP came in line with our New Zealand team's expectation of 0.6%. That was however below the market's expectation of 0.8%. As discussed by Westpac NZ economics, the pace of growth has slowed over the last year, and this softer momentum is expected to continue in the near term given building industry growth constraints and poor dairying conditions as well as uncertainty over the impact of the new Government's policies. Regarding the RBNZ's response, our team does not believe that this result will prompt a change in their tone, but it does reinforce (as Westpac has held for some time) that rate hikes are further off than many in the market expect.
Now to the US, another disappointing retail sales print was received this week, February seeing a third consecutive decline in sales. The January outcome was revised up, but only to -0.1%. Weather was certainly a factor in February in two ways: auto sales continue to come back to a more normal level after their hurricane-induced spike in late 2017; also abnormally cold weather in February weighed on gasoline and store sales as consumers stayed home. While we expect consumer spending to strengthen in coming months as weather effects abate, our core expectations remains that consumption growth will be weaker in 2018 than 2016 and 2017. Despite the benefit of tax cuts, real income growth remains weak and the savings rate is low; further, wealth is highly skewed towards the top of the income distribution. Hence, support for additional discretionary spending is limited. Going forward, higher interest rates are also likely to weigh on durables spending, particularly autos. This result has put a dent in expectations for Q1 GDP, but for now markets remain positive on the 2018 view, principally because of the scale of support offered by legislated government spending and belief in stronger business investment.
The key source of uncertainty for the US remains the administration of President Trump. Following Gary Cohn's resignation as Chief Economic Advisor, Secretary of State Tillerson has since been fired. And, as we noted last week, murmurs of trade actions against China are surfacing. Equities have been little affected given the market's optimism over growth. But the US dollar is under pressure. A material interest rate differential has opened up between the US and the rest of the developed world. Yet the US dollar index (DXY) is almost 13% below its December 2016 peak. The impact of fiscal uncertainty and rising deficits is clear for all to see. It is not surprising then that the first point of business for President Trump's new Chief Economic Advisor Larry Kudlow has been to stand in support of the currency and the outlook for the US economy.
Chart of the week: Aus consumers 'wisest place for savings'
The latest Westpac-MI Consumer Sentiment survey included a quarterly update of questions on the 'wisest place for savings' that offer additional insights around attitudes towards risk, debt, and different asset classes. The March results continue to show high levels of risk aversion. Nearly two thirds of consumers still favour safe options - deposits, superannuation or paying down debt - with only 11% nominating real estate and 8% nominating shares. Indeed, more consumers favour 'pay down debt' (22%) than those favouring real estate and shares combined.
The mix suggests consumers will continue to take a conservative approach to their finances, restraining spending, focussing on savings and shying away from risk with their balance sheet decisions. There are also some hints of frustration in recent responses with a notably high proportion of consumers (17%) nominating 'other assets', 'spend it' or not offering a response. That likely comes from the low returns available on 'safe' assets and unpalatably high perceived risks surrounding 'risk' assets.
 New Zealand: week ahead & data wrap
Few surprises
Slower GDP growth was confirmed by this week's data as the economy shifted down a gear. We expect this more subdued growth backdrop will persist in 2018 as the new Government's policies weigh on growth in the near term. And with few surprises on the data front in recent weeks, outgoing Reserve Bank Governor Grant Spencer is unlikely to make many waves with his final OCR decision on Thursday. We expect the OCR to remain unchanged at 1.75%. Once that's out of the way, we will await the announcement of the new PTA, signed by the Minister of Finance and incoming Governor Adrian Orr.
Thursday's GDP data confirmed that the pace of growth slowed over the last year. GDP increased 0.6% in the quarter, bringing the annual pace of growth to 2.9%. This was bang on our expectations, though softer than the market had anticipated. A 2.9% growth rate is a respectable outturn, but some way off the 3.5-4% pace we observed in 2015 and 2016. We expect the annual rate of growth will slow further this year as targeted policy changes cool the housing market, which in turn will impact on household spending, and as firms are more cautious around investment and hiring decisions.
Beneath the headline, the details for the quarter were also consistent with expectations. The agriculture sector was the biggest drag on growth - largely reflecting the hit to milk production on the back of the hot and dry weather the country experienced late last year. Weaker agricultural production flowed through to manufacturing activity via softer food processing.
In contrast, activity in the service sectors was a bit more lively. There were strong gains in retail, wholesaling, transport and business services. However, personal services such as healthcare and recreation were soft. Overall, services were up by 1.1%.
Firm growth in the domestic economy was also reflected in current account data released earlier in the week. The current account deficit widened from 2.5% to 2.7%, which was a little larger than expected. However, much of the surprise was due to a widening investment income deficit on the back of a surge in earnings of overseas-owned firms. This is an encouraging story to the extent that it reflects strong trading conditions in the local economy, and is consistent with the corporate tax take running well ahead of Treasury forecasts.
More generally at 2.7% of GDP, the current account deficit remains well within a 'sustainable' range. The run of modest deficits in recent years has helped New Zealand's external imbalances to improve markedly. New Zealand's net international liabilities position has narrowed from -84% of GDP in 2009 to -55% in the December quarter. This improvement has helped to shrink the risk premium that markets demand when lending to New Zealand.
This week's GDP and current account data were the final data releases ahead of next week's RBNZ OCR review. With the GDP data printing only a touch below the RBNZ's expectations, there was certainly nothing to prompt a change of tone from the RBNZ. Indeed, even looking more broadly at the new information available since the February Monetary Policy Statement there has been little to change the RBNZ's outlook. Q4 labour market data was released after the forecasts were finalised, but before publication, and were covered off in the press conference. The RBNZ probably had the results of its own inflation expectations survey (which showed that expectations were unaffected by the surprisingly weak Q4 CPI print) prior to publication.
Releases more recently have been monthly data that, while timely, can be a bit more volatile. Card spending was strong in January but soft in February, business confidence has improved a little but remains well below its post-election levels, and net migration was surprisingly strong in January, though we continue to expect annual migration numbers to moderate from here.
Even the NZ dollar, so often a source of surprise for the RBNZ, has tracked in line with expectations. The TWI is currently sitting at 75, bang on the RBNZ's assumption. And despite widespread concern about the potential for a trade war to erupt on the back of President Trump's tariff threats, for now these concerns simply remain threatening clouds on the horizon while global growth remains firm.
Consequently, we expect Thursday's OCR review to contain few surprises. The OCR is expected to remain on hold at 1.75%, with the bottom line likely to remain unchanged: "Monetary policy will remain accommodative for a considerable period". Similarly, our own take on the outlook has changed little in recent weeks. We still expect that the OCR will need to remain on hold for longer than the market currently anticipates - we don't have a rate hike pencilled in until late 2019.
Next week's OCR review will be Governor Spencer's last after his short stint in the top job. Incoming Governor Adrian Orr will take office on 27 March, and before then a new Policy Targets Agreement (PTA) will need to be signed (likely at some point in the two working days after the OCR review so as not to complicate matters).
Yet the PTA that is signed this month may not be the final word on the matter. The Government's two-phase review of the Reserve Bank Act is ongoing. While advice on phase one of the review was due to be provided to the Government ahead of the signing of the new PTA, the timeline for phase two of the review, which is much more wide ranging, has an even longer timeframe.
So although we could see the new PTA nudge the Governor toward giving greater consideration to maximising employment, for example, it's unlikely to fully incorporate proposed changes to the decision making structure at the RBNZ, and it's unlikely to be the final word on the matter. Indeed, a new PTA will probably need to be agreed between the Governor and the Minister of Finance when changes to the Reserve Bank Act are eventually finalised.
Data Previews
Aus Feb Westpac-MI Leading Index
Mar 21, Last: +0.73%
- The six month annualised growth rate in the Leading Index fell from +1.39% in Dec to +0.73% in Jan, fully reversing a 0.7ppt jump in the previous month. The swings mainly reflect extreme volatility in monthly dwelling approvals. Overall, the Index is still pointing to above trend growth momentum in the early part of 2018.
- The Feb read will include another volatile read on dwelling approvals which surged 17% in Jan. Commodity prices also firmed, up 3.8% (in AUD terms) vs 5.2% last month, and the yield spread widened a further 13bps. Other components look to have been softer, the ASX200 down -0.4%; the Westpac-MI Consumer Expectations Index down -0.1%; US industrial production down -0.1%; and the Westpac-MI Unemployment Expectations Index a touch weaker.
 Aus Labour Force Survey - total employment '000
Mar 22, Last: 16k, WBC f/c: 25k
Mkt f/c: 20k, Range: 8k to 30k
- Australia posted a 16k increase in employment in January 2018 which records the longest streak of job gains with a 16th consecutive positive print. The month's increase was very close to the market and Westpac's expectation for a 15k rise.
- However, the composition of employment changes was quite stark with full-time employment down 49.8k and parttime employment up 65.9k. That comes after a strong 2017 for full-time employment growth and the annual growth rate is still an elevated 3.6%.
- The leading indicators, both from business and household surveys, have strengthened so far in 2018. Westpac's Jobs Index is suggesting that while employment growth maybe stronger than you would expect, there is no reason to be looking for a fundamental correction anytime soon.
 Aus Labour Force Survey - unemployment %
Mar 22, Last: 5.5%, WBC f/c: 5.5%
Mkt f/c: 5.5%, Range: 5.3% to 5.6%
- In January, the unemployment rate fell to 5.5% from 5.6% in December (revised up from 5.5%) with participation declining to 65.6% from 65.7%. Over the past year, while the unemployment rate did fall from a peak of 5.9% in February 2017 to the current 5.5%, the drop was more muted than the gain in employment due to rising participation.
- The uplift in participation has been driven mainly by females joining, re-joining, or remaining for longer in the labour force. However, this spike occurred alongside a rising male participation rate which had otherwise been in a downtrend.
- Given there appears to be a strong cyclical lift in participation, corresponding to the rise in employment, we are forecasting participation to rise modestly to 65.7% and this will be enough to see the unemployment rate hold flat at 5.5%.
 NZ Westpac McDermott Miller Consumer confidence
Mar 20, Last: 107.4
- Consumer confidence dropped to below average levels late in 2017. However, underneath the aggregate figures was a noticeable skew across households: Confidence among those households earning less than $70,000 per annum actually rose modestly, while confidence among those households earning more than $70,000 per annum fell sharply. In both cases, it's likely that sentient was affected by the change of government at the end of last year.
 NZ RBNZ OCR review
Mar 22, Last: 1.75%, Westpac f/c: 1.75%, Mkt f/c: 1.75%
- We expect the OCR to remain on hold at 1.75% until late 2019.
- Recent developments will have given the Reserve Bank little cause to change its stance. Low inflation and a period of more subdued growth mean that interest rates will need to remain low for a considerable time.
- This is the last OCR review for Acting Governor Spencer. The incoming Governor is due to sign a new Policy Targets Agreement shortly. Employment will be a consideration in future OCR decisions, but the details have yet to be resolved.
 UK Bank of England Bank Rate decision
Mar 22, Last: 0.5%, Mkt: 0.5%, WBC f/c: 0.5%
- While the Bank of England left the Bank Rate on hold in February, there was a hawkish tilt in the accompanying statement. The MPC noted that policy "would need to be tightened somewhat earlier and by a somewhat greater extent over the forecast period than anticipated at the time of the November Report".
- We expect that the Bank Rate will again be left hold at the March meeting and that the BOE's earlier tightening bias will remain. Since February, we haven't seen major surprises in terms of economic conditions. Inflation is sitting at the top of the BOE's target band and while growth remains sluggish, there are positive signs in parts of the economy. Developments on the external front (including Brexit negotiations) continue to signal some headwinds.
- We have pencilled in a hike from the BOE in June. Markets have priced in a 50% chance of a hike in May.
 US Mar FOMC meeting
Mar 22, last 1.375%, WBC 1.625%
- The March FOMC fed funds rate decision is as certain a prospect as markets get. From recent communications, it is evident that the Committee is in agrement of the appropriateness of a further rate increase, and the market knows this to be the case. That will see the fed funds rate rise to 1.625%. As planned, quantitative tightening will also remain on auto pilot.
- Market participants will therefore immediately focus their attention on the new set of Committee forecasts and followup comments from Chair Powell in the press conference.
- Expected is a confident FOMC Chair, both with respect to the economy's strength and the FOMC's approach to policy. While growth forecasts and the distribution of rate projections are likely to drift up, the median fed funds forecast should remain unchanged at three in 2018 and three more in 2019. Gradual and timely are the operative words for policy.