Sample Category Title
Strategy: Trump’s Attack On Globalisation Continues
Trump administration takes further steps against globalisation
This week saw a further step towards US protectionism, eyeing China in particular. After last week, when Donald Trump's administration imposed tariffs on the import of steel and aluminium, the administration this week blocked Broadcom's proposed takeover of Qualcomm for ‘national security' reasons. Furthermore, White House trade adviser Peter Navarro yesterday said the US administration would consider steps against China's alleged theft of US intellectual property over coming weeks. In addition, according to a Reuters' story, Trump is considering imposing tariffs on USD60bn of imported goods from China, which corresponds to 13% of total imported goods from China and 2.75% of US total goods imports.
Degree of retaliation by China is key
The more protectionist stance has raised the prospects of retaliation by US trading partners. The EU is trying to persuade the US to exempt the EU from tariffs given its status as a key ally of the US (Trump tweeted this week that he wants zero-tariff trade between the EU and the US). However, given the likely targeted US trade measures against China, the bigger risk of an escalation lies with China (see more details on our take on how China could react in Research – 10 areas where China could retaliate vs. US measures, 15 March). While we expect China to retaliate against any protectionist measures implemented by Trump, we believe it would tread carefully and not strike back too hard. Among the US goods to be targeted are soybeans, grains and aircraft, which are politically sensitive for Trump. China could also sell US treasuries but we do not expect this to be the first line of defence.
USD may be a victim of increased US protectionism
In themselves, US import tariffs should (in theory) foster USD appreciation but as these, in the current setting, are part of a wider agenda to boost the US economy, protectionist measures have generally become associated with a political push for a weaker USD. Further, as risk appetite would be likely to sour because of ‘US isolation', the USD may not exhibit the usual safe-haven properties in this context (rather the contrary perhaps). Finally, because of a wider set of US trade restrictions, we see potential for US productivity to decline over time, which would imply a real depreciation of the USD. In a risk scenario with more aggressive US protectionist measures, our medium-term model sees the EUR/USD moving to 1.34, while in our base case of limited trade fall-out, the mediumterm value for the cross is still around 1.28.
Global reflation theme losing some momentum lately but Fed still set to hike next week
Fear of global reflation was one of the key triggers of the equity sell-off in early February. The stronger-than-expected wage growth in the nonfarm payrolls set off the sell-off. However, the numbers have provided less support to the reflation theme. The nonfarm payroll number last Friday saw only a small tick up in wage inflation, while February's strong increase was revised down. Furthermore, as announced on Tuesday, US CPI inflation for February grew at a monthly rate of 0.2%, as expected, while core inflation also fell back slightly. Market-based inflation expectations have also declined somewhat on the back of the numbers.
Less concern about reflation, and hence a more aggressive central bank stance, has prompted a rebound in risky assets. While we expect the Fed to raise the target range by 25bp to 1.50-1.75% at its meeting next week, we expect the FOMC to maintain the hiking signal at three hikes this year, albeit lifting the median dot for next year from 2.25 to 3.00 hikes in line with our view. Hence, we disagree with the markets, which price in only slightly more than one hike next year (so a total of slightly more than four hikes from now until yearend 2019 against our expectation of six hikes). However, typically, markets are more focused on the near-term outlook, so we do not expect major market volatility on the back of the Fed meeting next week.
Forex Analysis: AUDUSD And EURJPY
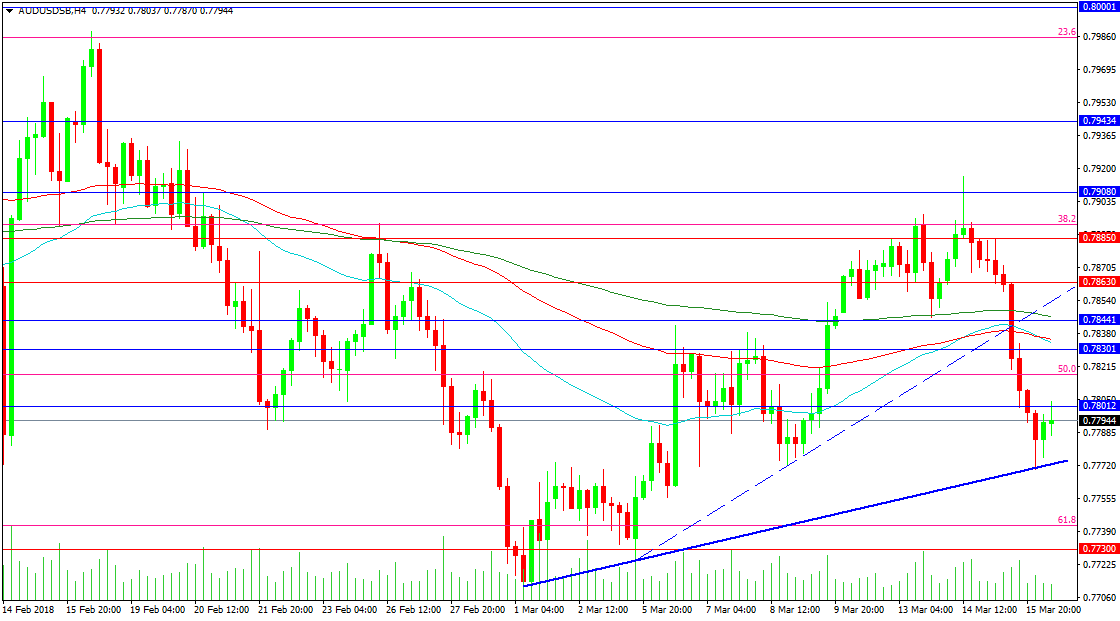
The AUDUSD pair failed to stay above the 0.79000 level and broke down under trend line support late yesterday, to test the next supporting trend line at 0.77707. A fall below this area would see a sustained push lower to the 0.77300 level and the February lows at 0.77122. A loss under 0.77000 would target 0.76950 initially, with further support at 0.76400 and 0.76100.
Resistance has been tested today just above 0.78000, with 0.78300 and the 50 and 100-period moving averages at 0.78332. The 0.78441 level is just above, with the 200-period MA above it at 0.78465. The broken trend line is located at 0.78525 and a retest on this line might be enough to set up a later move higher to test Wednesday’s high. A break above that level targets the February high at 0.79881.
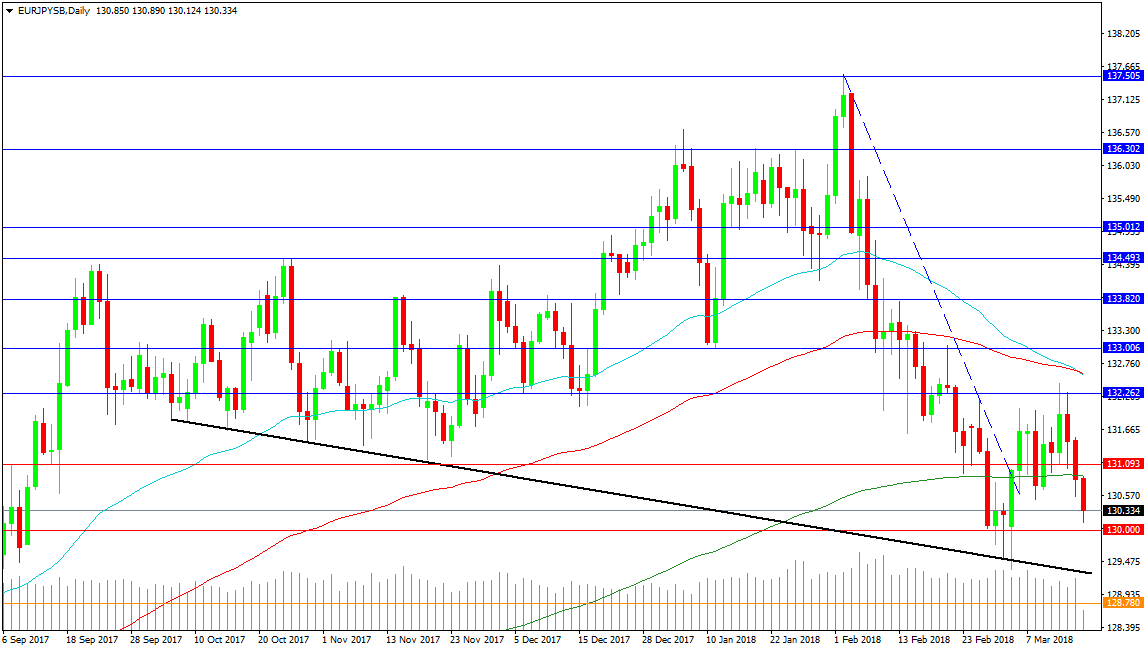
EURJPY
This pair has tested support at the black trend line at 129.500 before rebounding higher to resistance at 132.262. Price has since moved lower again towards 130.000. The 200 DMA at 130.906 has provided resistance and a high for today’s candle. This is the median of the current trading range, as price has moved back and forth across it since first contact on February 23rd. Support comes at 130.000, with the black trend line at 129.292 today. Support below can be found at 128.780.
Resistance above the 200 DMA is located at 131.093 and 132.262, with the 50 and 100 DMAs at 132.593. The 133.000 level needs to be taken if the market wants to move on to its February highs. A break above this level completes the first step but there are key levels of resistance at 133.820 and 134.493. The 135.000 level forms the bottom of an area of consolidation used in January up as far as 136.302, with a break above leading to the high at 137.498.
Further USDJPY Losses Expected Below 106.00
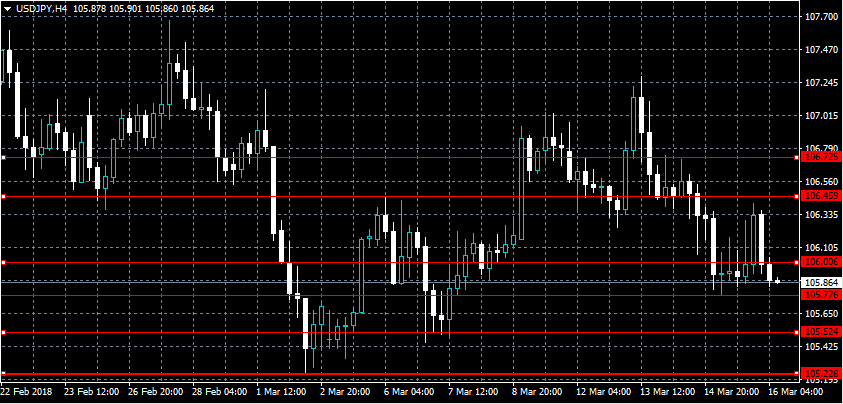
The U.S dollar has come under further bearish selling pressure against the Japanese yen, with investors moving into the perceived safety of the yen after the Trump Organization faced a subpoenaed from U.S investigators. The USDJPY pair has also come under pressure from technical sellers, as price-action was strongly rejected from key resistance around the 106.40 level. Traders now look towards the 106.00 level as a daily pivot point, ahead of high-impacting macroeconomic data from the United States economy later today.
The USDJPY pair is strongly bearish while trading below the 106.00 level, further losses towards the 105.50 and 105.22 levels appears increasingly likely.
Should the USDJPY pair maintain price-action above the 106.00 level, buyers may attempt a further test of the 106.45 resistance level.
EURUSD Intraday Bearish Below 1.2334 Level
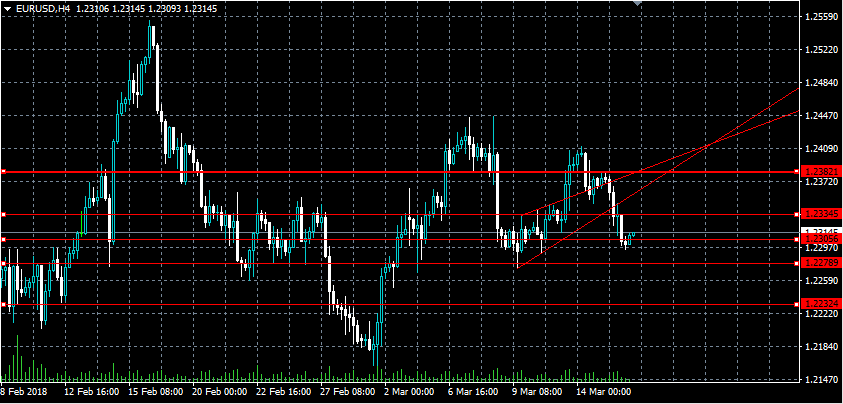
The euro has continued to drift lower against the U.S dollar on Friday, with price-action so far finding weekly support from the 1.2300 support level. The EURUSD turned bearish as buyers failed to move price above the 1.2400 level, with the pair repeatedly failing below important technical support. Traders now look towards the release of EU CPI inflation data for the month of February, with intraday sellers firmly in control whilst the pair trades below the 1.2334 level.
The EURUSD pair is intraday bearish below the 1.2334 level, key weekly support is found at the 1.2305 and 1.2278 levels.
If the EURUSD pair can maintain price-action above the 1.2332 level, buyers will likely test the 1.2357 and 1.2382 resistance areas.
BoE FPC statement talks Brexit, domestic and global risks
Some highlights on BoE's FPC statement from the March 12 meeting:-
- "Apart from those related to Brexit, domestic risks remain standard overall, and that risks from global vulnerabilities remain material."
- Globally, "the principle risks are in debt markets"
- "Risks stemming from corporate debt in the United States have continued to build. "
- "Financial vulnerabilities in China remain elevated."
- "Current account deficit remains large by international standards."
- "Over recent quarters (the current account) deficit has been increasingly funded by capital inflows - rather than sales of foreign assets by UK residents - thus increasing the UK's reliance on the confidence of foreign investors,"
- "The UK banking system could continue to support the real economy through a disorderly Brexit."
- "The FPC judged that Brexit risks did not warrant additional capital buffers for banks. Developments since November have not changed this assessment."
- "The FPC judges that existing crypto-assets do not currently pose a material risk to UK financial stability"
EURUSD Analysis: Shows Signs Of Recovery
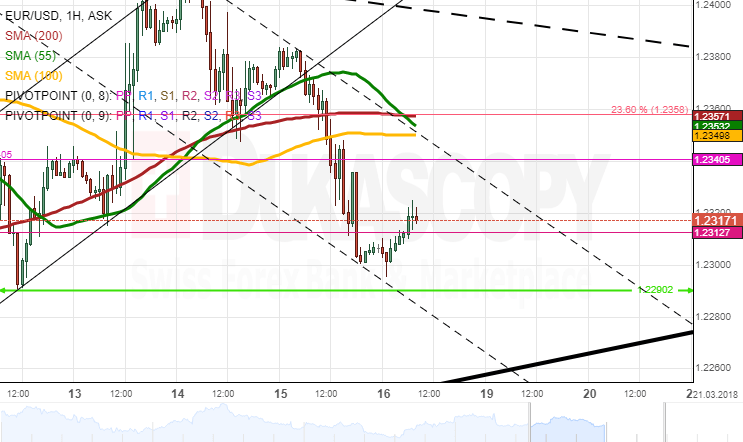
Contrary to expectations, the common European currency was guided by bears on Thursday. This strong momentum south allowed the pair to dash through the combined support of the 55-, 100– and 200-hour SMAs and the weekly PP. The second part of the day showed high volatility in both directions which allayed considerably during the Asian session early today.
It seems that bulls could be ready to push the rate away from its two-week low of 1.2290 and regain some of its positions lost yesterday. The Euro is likely to aim for the resistance cluster formed by the aforementioned SMAs and the 23.60% Fibo retracement near the 1.2360 area.
In case of favourable US Building Permits, this level might even be breached to the upside, thus setting 1.2380 as a daily high.
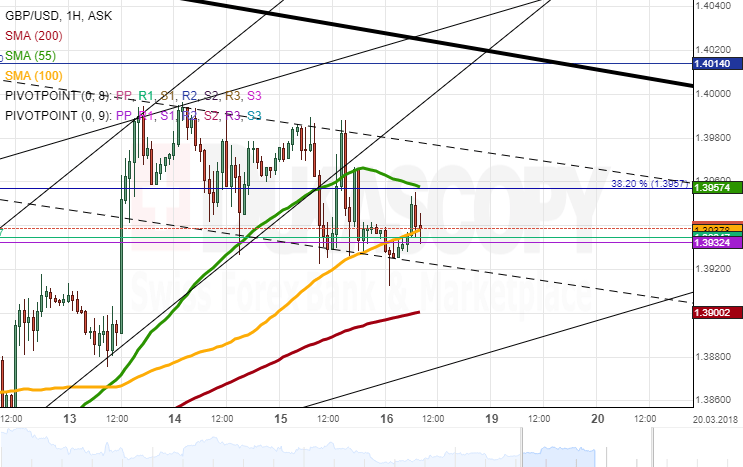
GBPUSD Analysis: Two Scenarios Possible
The Sterling continues to depreciate against the US Dollar for the second consecutive session. This movement has been constrained in a rather flat channel down.
In case the current sentiment is to persist, the pair is likely to reach the lower boundary of a medium-term channel circa 1.39. The 200-hour SMA is likewise located near this area.
Technical indicators, however, are more favouable of the bullish scenario. At the time of this analysis, the pair was trading between two strong barriers one of which being the 55-hour SMA and the 38.20% Fibo retracement at 1.3960.
The prevalence of bulls would result in a breakout of this resistance and a subsequent surge towards the three-week high at 1.40 where the senior channel is located.
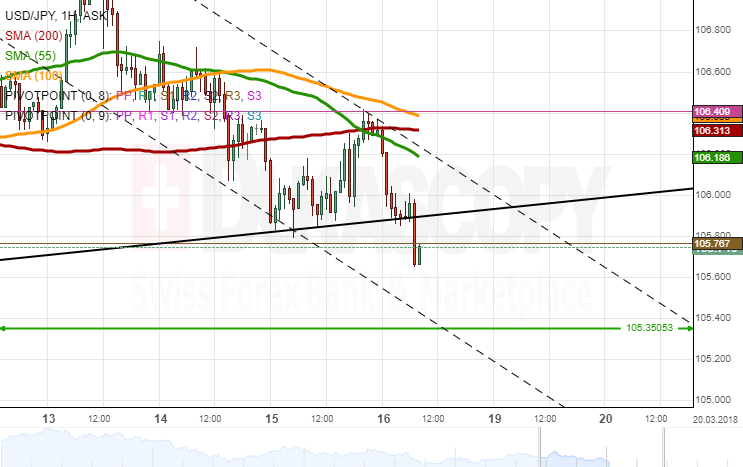
USDJPY Analysis: Fails To Overcome 106.40
The US Dollar was trading in the same range against the Yen during the most of the session on Thursday. The pair failed to move above the 106.40 mark, as the northern barrier was limited by the 55-, 100– and 200-hour SMAs and the weekly PP. As a result, the pair was pushed back to 106.00 during the Asian session.
Given that this resistance is likewise reinforced by SMAs on the four-hour chart, it is expected that the Greenback fails to overcome this area today. The most likely downside target should be the 2017 low of 105.35. Meanwhile, the pair might still go for a re-test of the 106.40 area, thus limiting the expected fall to 105.60.
Some volatility might be introduced in response to US Building Permits released at 1230GMT; however, the projected trading range is unlikely to be breached.
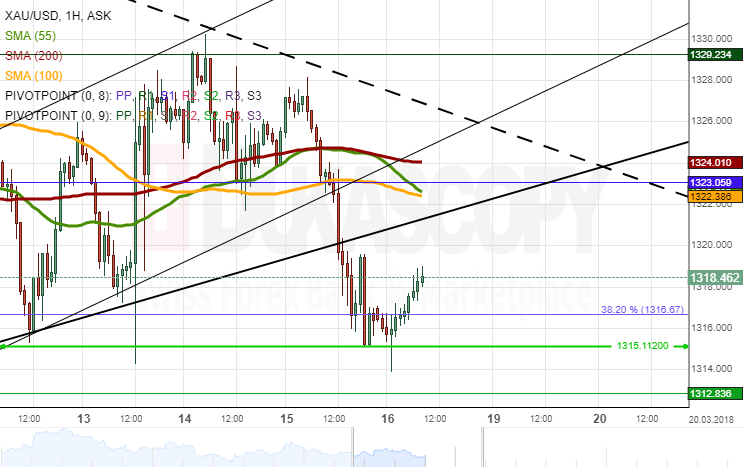
Gold Analysis: Falls To Two-Week Low
Gold was driven by bearish momentum during the previous trading session. This sentiment strengthened mid-session when the pair breached the combined support of the 55-, 100– and 200-hour SMAs. As a result, the yellow metal was located at 1,315.10—its lowest level in March—late on Thursday.
Given that this area has provided considerable support during the past three weeks, it is likely that the pair fails to edge lower in this session and therefore approaches the previously-breached moving averages. The downward-sloping trend-line at 1,320.00 should be the highest mark for today.
Even though technical indicators flash bearish signals, some apparent signs of recovery add some ground to the aforementioned bullish scenario.
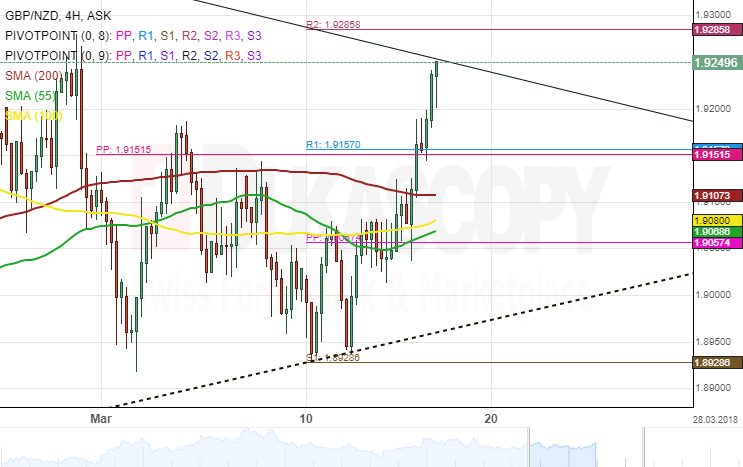
GBP/NZD 4H Chart: Possible Retracement
The British Pound has been guided by several patterns against the New Zealand Dollar. On the larger time frame, the rate is bound by an ascending channel, while on the smaller time frame, it is trading inside a medium-scale triangle.
The currency exchange rate has breached a resistance cluster set by the monthly pivot point and the weekly R1 near 1.9151. Also, the GBP/NZD pair has moved closer to the upper boundary of the medium-scale triangle and could be set for a breakout during the following trading session.
Technical indicators suggest the rally could continue, however, from a theoretical point of view, the rate should retrace south for a re-test of the aforementioned resistance cluster within this trading session.