Sample Category Title
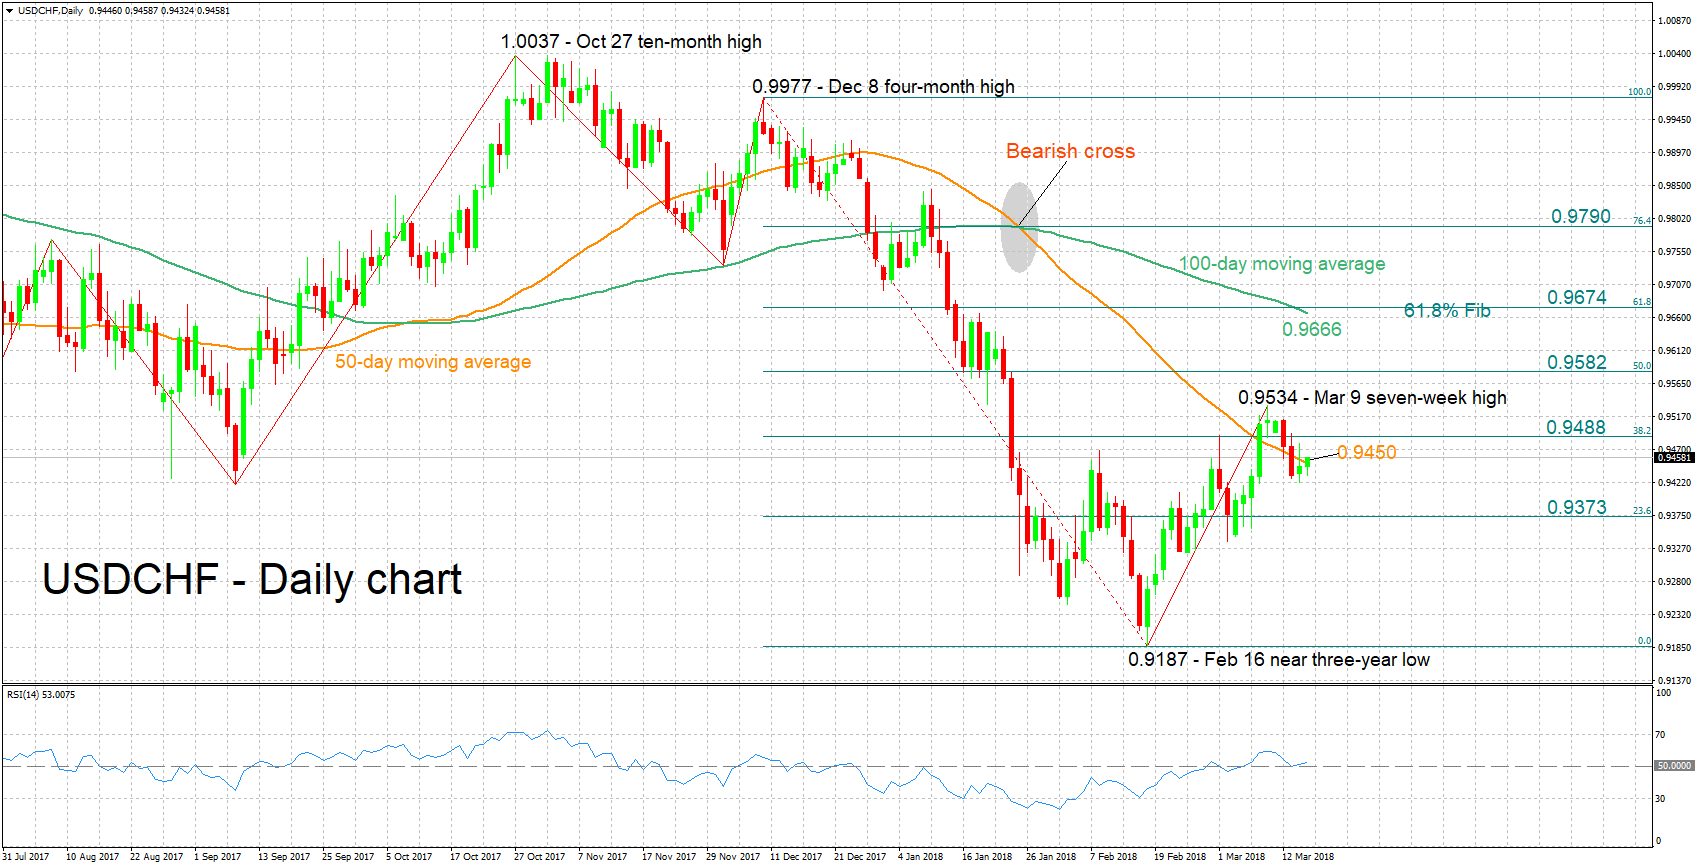
USDCHF Looking Bullish In The Short-Term But Maintains Bearish Medium-Term Tone
USDCHF has advanced is recent weeks, distancing itself from the near three-year low of 0.9187 hit on February 16. Last Friday, the pair posted a seven-week high of 0.9534.
The short-term bias is looking cautiously positive, with the RSI continuing to rise.
The pair has managed to marginally exceed the 50-day moving average line at 0.9450, with immediate resistance potentially coming around the 38.2% Fibonacci retracement level of the December 8 to February 16 downleg, at 0.9488. Not far above and in case of stronger bullish movement, last week’s multi-week high of 0.9534 could act as a barrier to the upside as well.
On the downside, support might come around the 23.6% Fibonacci mark at 0.9373; the area around this point was congested recently. Further below, the near three-year low of 0.9187 that was recorded around mid-February would increasingly come into view, with some round levels – for example, the 0.93 handle – having the capacity to provide support before that.
The medium-term picture is looking mostly bearish, with the pair trading lower by 2.9% year-to-date. In addition, both the 50- and 100-day MA lines are currently maintaining a negative slope, while a bearish cross was recorded in late January when the 50-day MA moved below the 100-day one. Should the pair move further above the 50-day MA though, this would increasingly shift the outlook towards a more neutral one.
Overall, the short-term outlook is looking predominantly bullish and the medium-term appears bearish for the most part.
Forex Analysis: GBPUSD And Silver Analysis
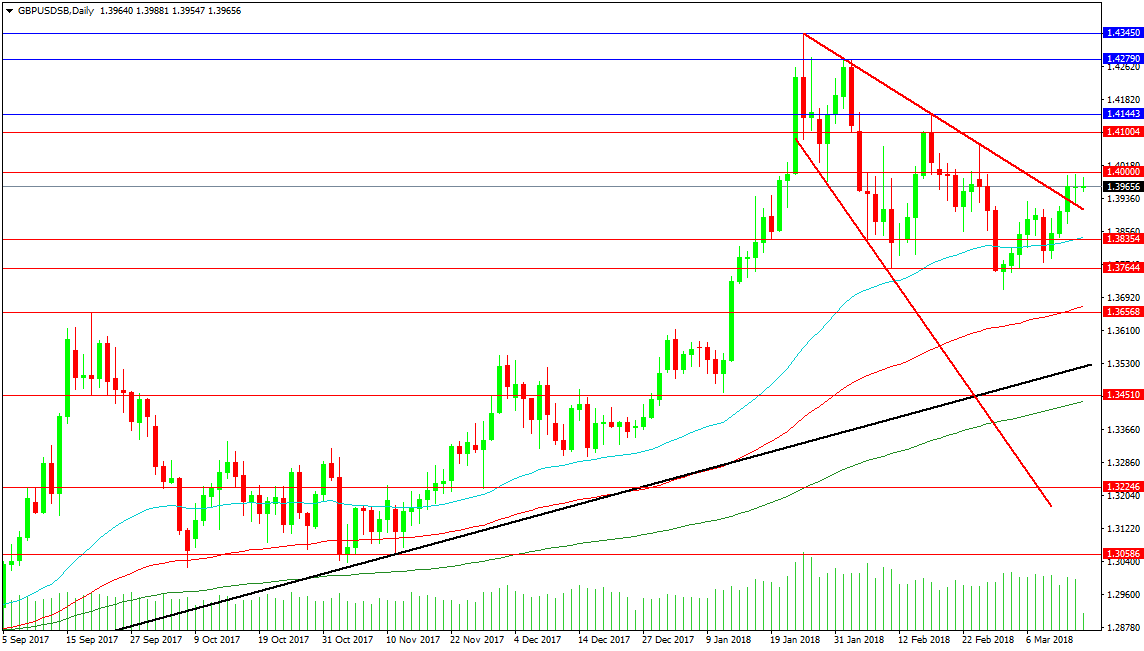
The GBPUSD pair has broken higher from its falling wedge pattern, crossing the 1.39280 mark on Tuesday and retesting the trend line as support yesterday. Resistance can be found at the 1.40000 level. A break above this point would lead to a challenge of the 1.41000 area, with resistance above at 1.41443. The high from the 1st of February comes in at 1.42800, with the high from January at 1.43450.
Support can be found at the trend line with the 50 DMA at 1.38421 and the 1.38354 level below. The 1.37644 level would open the way for a retest of the 1st of March low at 1.37117 and the 100 DMA at 1.36707, with 1.36568 close by. A loss here puts the major support at the rising black trend line at 1.35200. This would signal a takeover by short sellers but they would need to drive price under the 200 DMA at 1.34361. From there, swift moves down can reach for 1.32246 and 1.30586.
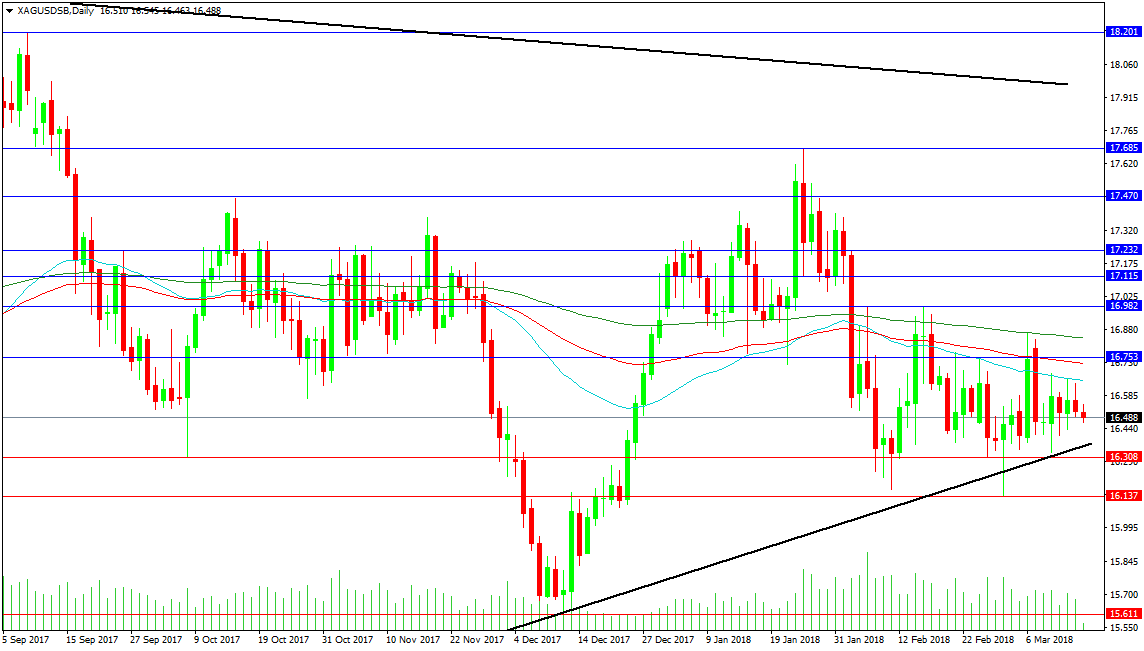
Silver
The metal has been trading in a sideways consolidation pattern, with the latest manifestation forming a triangle, shown here in black. The danger with a sideways pattern is that, over time, multiple trend lines are formed and broken without ever hitting their target levels and with price generally reverting to the mean. This can be repeated until the price eventually breaks out into a trend. Price had been trading around the 17.000 level but, during February and into March, this seems to have slipped to 16.500. The range has narrowed to a 16.0 handle but a break higher would need to clear the 18.000 level to confirm a move out of the 2017 range, with the 15.600 level as downside support
Near-term resistance is found at the moving averages in a tight band centred on 16.753, with the 16.982 level used recently to cap price. Further resistance is found at 17.232 and 17.470, followed by 17.685. Support is located at the rising black trend line at 16.369, with 16.308 and 16.137 below. Any loss below 15.611 could reach for 14.320 on a breakout.
Canadian Dollar Quiet Ahead Of Canadian, US Job Reports
The Canadian dollar has ticked higher in the Thursday session. Currently, USD/CAD is trading at 1.2975, up 0.16% on the day. On the release front, Canada releases ADP Non-Farm Employment Change. In the US, unemployment claims is expected to drop to 227 thousand, and the Philly Fed Manufacturing Index is forecast to fall to 23.1 points. On Friday, the US releases three key events – Building Permits, Housing Starts and Preliminary UoM Consumer Sentiment. Canada will publish Foreign Securities Purchases and Manufacturing Sales.
What can we expect from the Bank of Canada? Earlier in the week, BoC Governor Stephen Poloz sounded dovish about future rate hikes. Poloz said that there was slack in the labor market, leaving room for the economy to grow without generating inflation. Investors took this as a message that the BoC is in no rush to raise rates anytime soon, and the Canadian dollar lost ground on Tuesday. Poloz added that any rate increases would be “gradual” and dependent on economic data. It seems clear that the BoC will not be able to match the Fed pace of rate hikes, as the US economy continues to outpace its northern neighbor. As well, the future of NAFTA is up in the air, with the US threatening to withdraw from the agreement if Canada and Mexico do not make far-reaching concessions to the US. This means that the Canadian dollar could be in trouble, as rate hikes in the US will make the greenback more attractive to investors.
The Federal Reserve is widely expected to raise interest rates next week. According to the CME Group, the odds of a quarter-point raise stand at 89 percent. What can we expect from the Fed during the year? The pressing question is how many rate hikes will we see in 2018. The current Fed projection remains at three hikes, but the superb nonfarm payrolls report last week has raised speculation that the Fed could accelerate the pace to four hikes, which would be good news for the US dollar. Investors will be keeping a close eye on key US data, especially inflation indicators. If these numbers improve, we’re likely to see four rate hikes in 2018.
SNB Jordan warns protectionism is damaging for everyone
SNB chairman Thomas Jordan warned of US protectionism in a radio interview today:-
- "The risks have not materialised yet, but if international trade doesn't function well, that is damaging for everyone,"
- "Safe havens are sought when there are political uncertainties or big changes in the financial markets. This can be triggered by protectionism,"
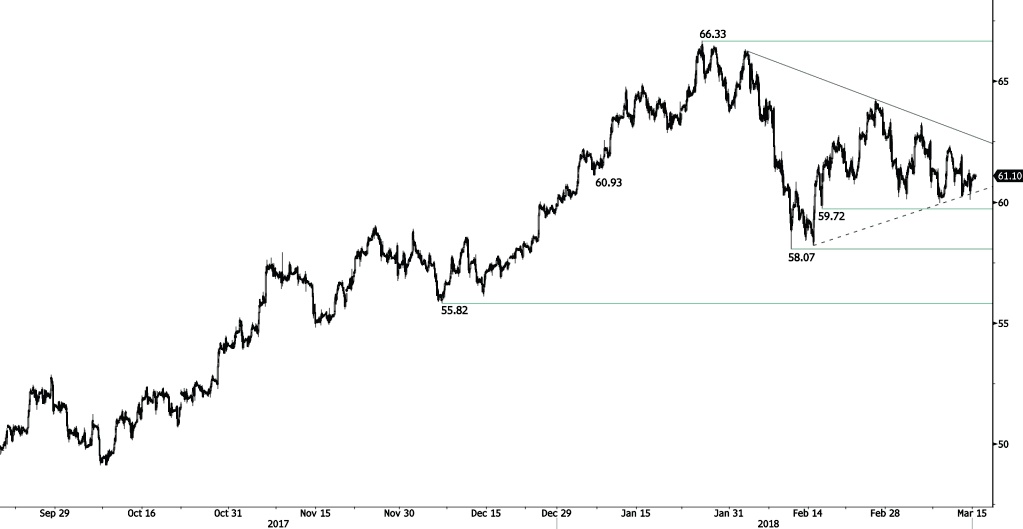
CRUDE OIL Slight Increase
Crude oil is pushing back following recent selling pressures after reaching 61.33. Expected to bounce back. Hourly support and resistance remain at 59.72 (15/02/2018 low) and 66.33 (25/01/2018 high). The technical structure suggests short-term increase.
In the long-term, crude oil has recovered after its sharp decline last year. However, we consider that further weakness is very likely. For the time being, the pair lies in an upside trend since June 2017. Support lies at 42.20 (16/11/2016) while resistance is located at 77.83 (20/11/2014). Crude oil is trading largely above its 200 DMA.
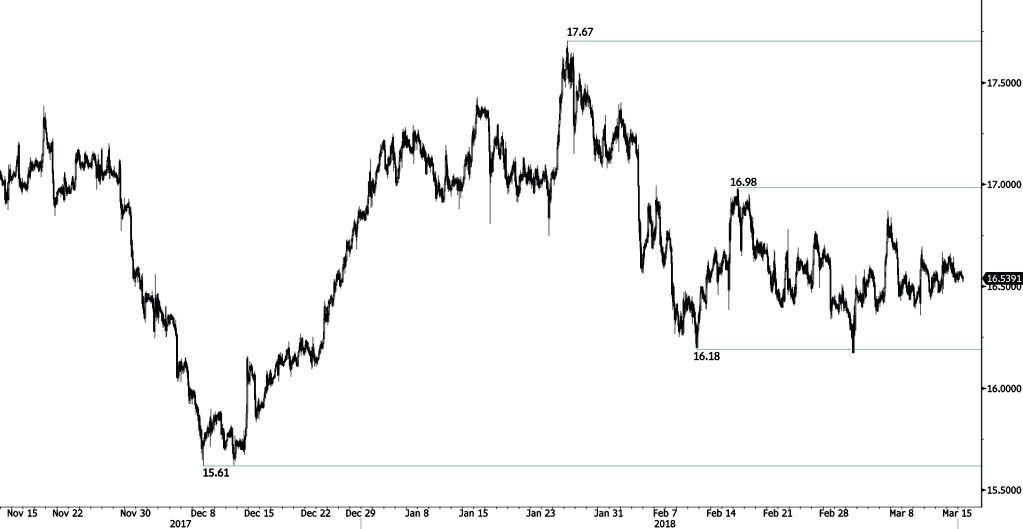
SILVER Edging Lower
Silver is declining further, trading at the 16.50 range and expected to decline along 16.45. Silver is contained between hourly support and resistance given at 16.18 (09/02/2018 low) and 16.98 (15/02/2018 high). The short-term technical structure suggests further short-term decrease.
In the long-term, the trend remains negative/ sideways. Further downside is very likely. The pair is trading below its 200 DMA. Resistance is located at 21.58 (10/07/2014 high). Strong support can be found at 11.75 (20/04/2009).
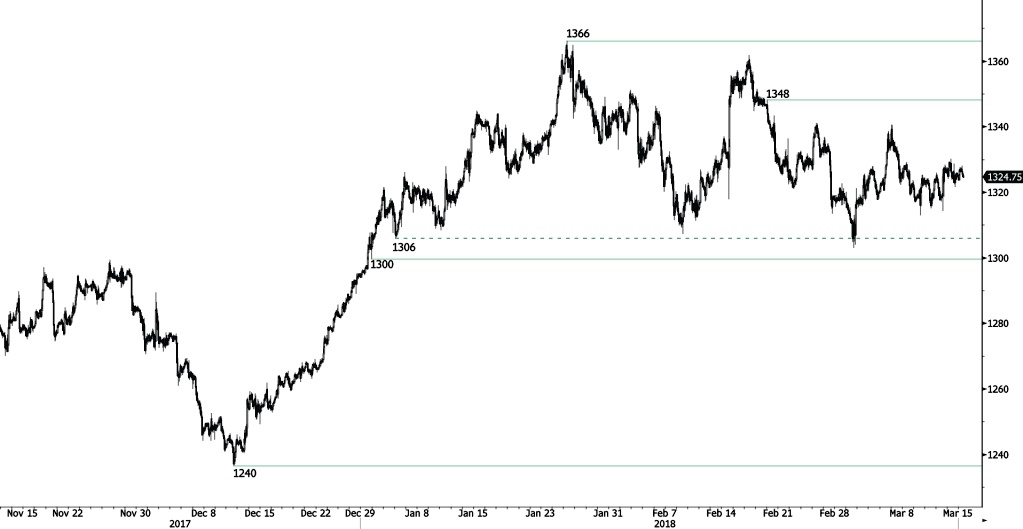
GOLD Declining Further
Gold continues decreasing, heading for the 1320 range. The pair currently trades between hourly support and resistance at 1300 (29/12/2017 low) and 1348 (20/02/2018 high). Expected to show further decrease.
In the long-term, the technical structure suggests that there is a growing upside momentum. A break of 1'392 (17/03/2014) is required to confirm it. A major support can be found at 1'045 (05/02/2010 low).
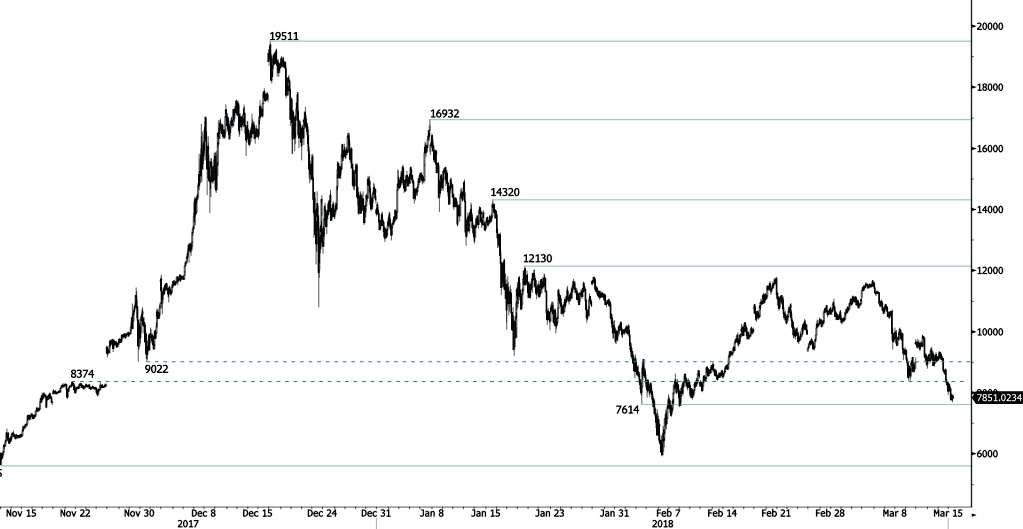
BITCOIN Testing Support At 7614
Bitcoin trades indistinctly at the 8200 range, nearing hourly support at 7614 (02/02/2018 low). Expected to show short-term stabilization. Hourly resistance is maintained at 12130 (18/01/2018 high).
In the long-term, the digital currency has had an exponential growth but also presented important downturns. There is decent likelihood that the currency could stabilize between 7'000 - 12'000 in 2018. Bitcoin is approaching its 200 DMA (7000 range).
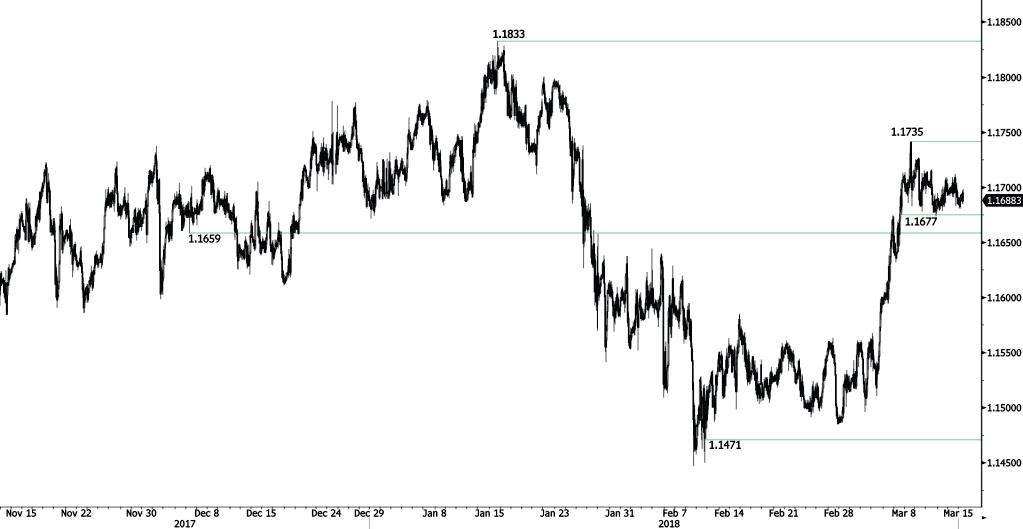
EUR/CHF Indistinct Trading
EUR/CHF is having a consolidation phase following recent bearish moves, bouncing at the 1.1680 range. Hourly support and resistance are given at 1.1677 (07/03/2018 low) and 1.1735 (08/03/2018 high). The short-term technical structure suggests further short-term sideway moves.
In the longer term, the technical structure has reversed. Strong resistance is given at 1.20 (level before the unpeg). Yet, the ECB's slowing QE program is likely to cause buying pressures on the euro, which should weigh in favour of the EUR/CHF. Support can be found at 1.0234 (20/04/2015 low).
EUR/GBP Selling Pressures Continue
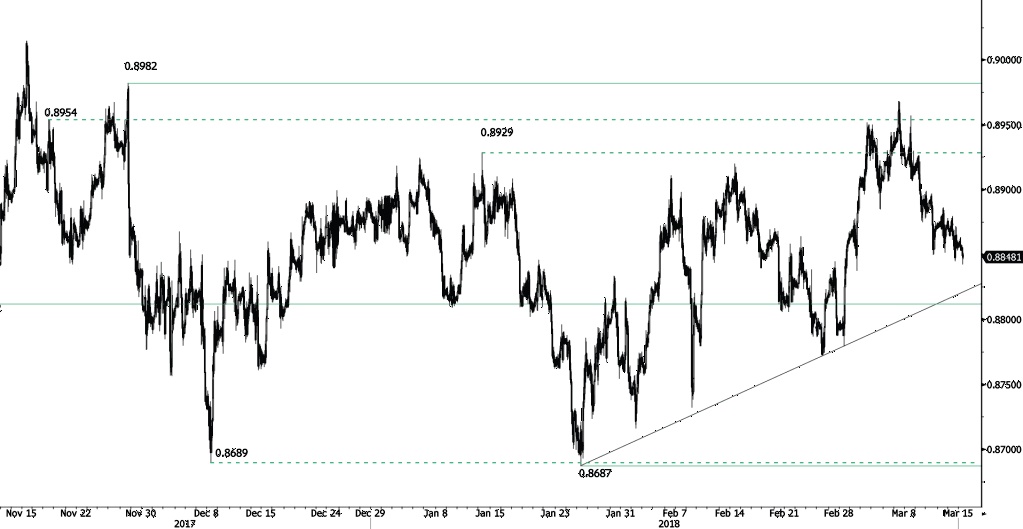
EUR/GBP is maintaining its bearish consolidation phase, trading at the 0.8850 range and expected to stabilize. Hourly support and resistance are given at 0.8812 (10/11/2017 low) and 0.8982 (28/11/2017 high). The technical structure suggests short-term sideway moves.
In the long-term, the pair has largely recovered from 2015 lows. The technical structure suggests further upside pressure. Strong resistance can be found at 0.9500 (psychological level) while support remains at 0.8304 (05/12/2016 low). The pair is trading above its 200 DMA. Selling pressures continue.