Sample Category Title
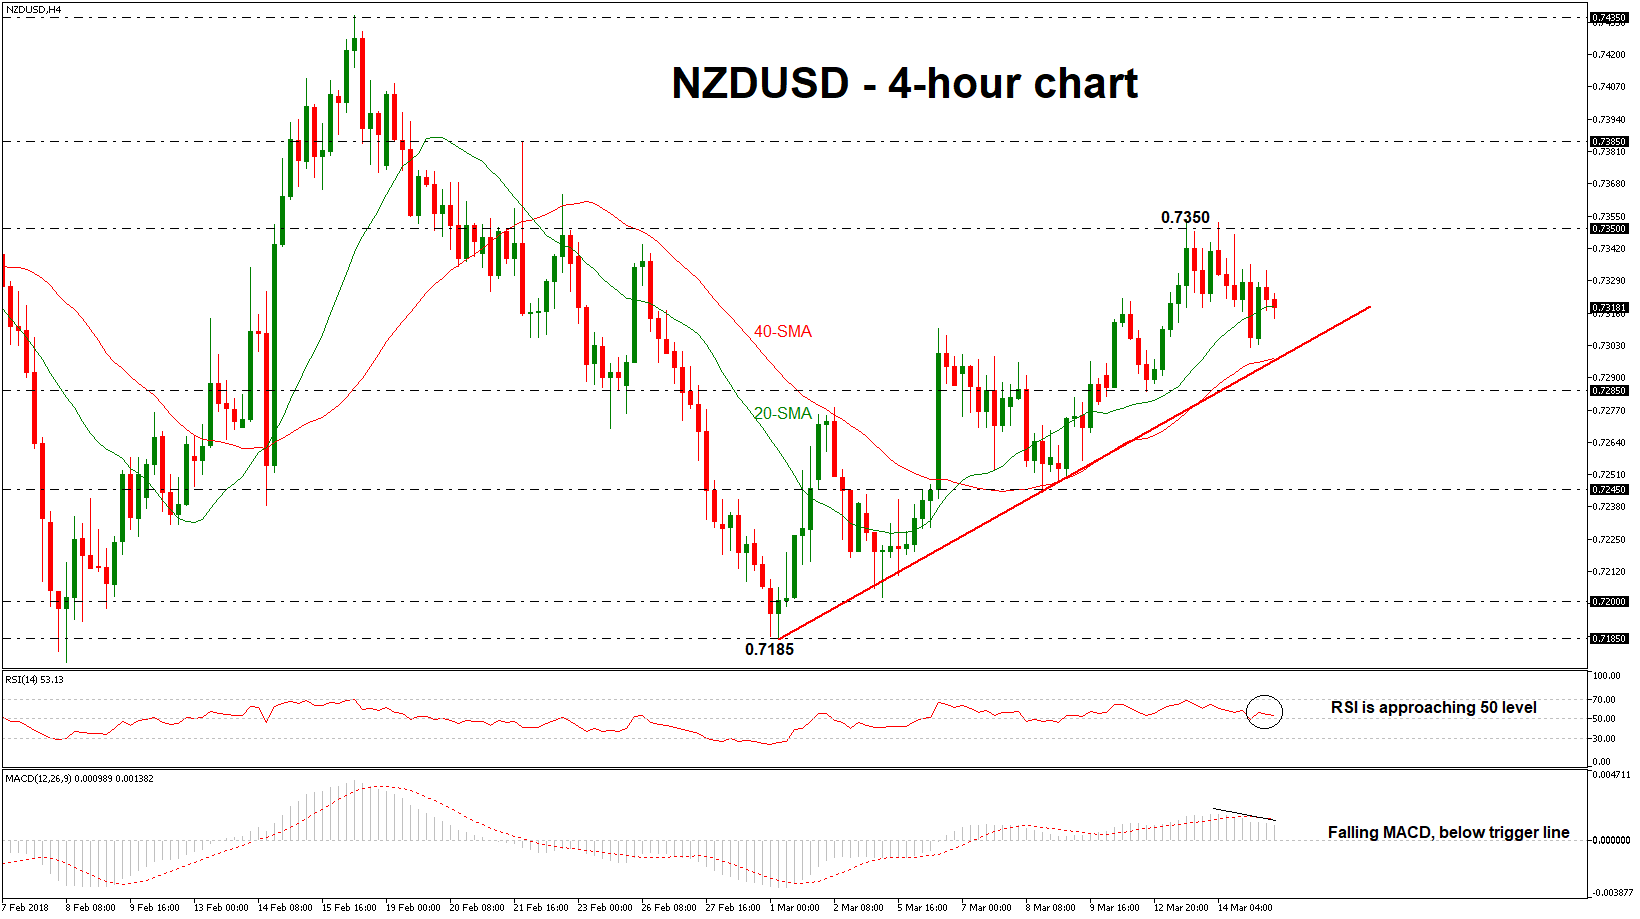
NZDUSD Fails To Jump Above 0.7350, Weak Bias In Short Term
NZDUSD has been developing within an ascending trend since March 1 after the strong rebound on the 0.7185 support level. Although the pair hit several times the 0.7350 resistance barrier yesterday it failed to have a successful run above it and is currently moving near the 0.7310 price level and below the 20-simple moving average in the 4-hour chart.
Looking at momentum indicators, the RSI indicator approached the 50 level after the bounce off the overbought zone. The MACD oscillator also supports the downward correction as it fell below its trigger line, creating a bearish crossover.
In the wake of negative pressures, the market could meet support at the diagonal line before it heads lower to the 0.7285 support. A successful close below this level could see a retest of the 0.7245 strong barrier.
On the contrary, a move to the upside could see immediate resistance at the 0.7350 key level but should the market increase positive momentum above this zone, the 0.7385 could be the next level in focus taken from the peak on February 21.
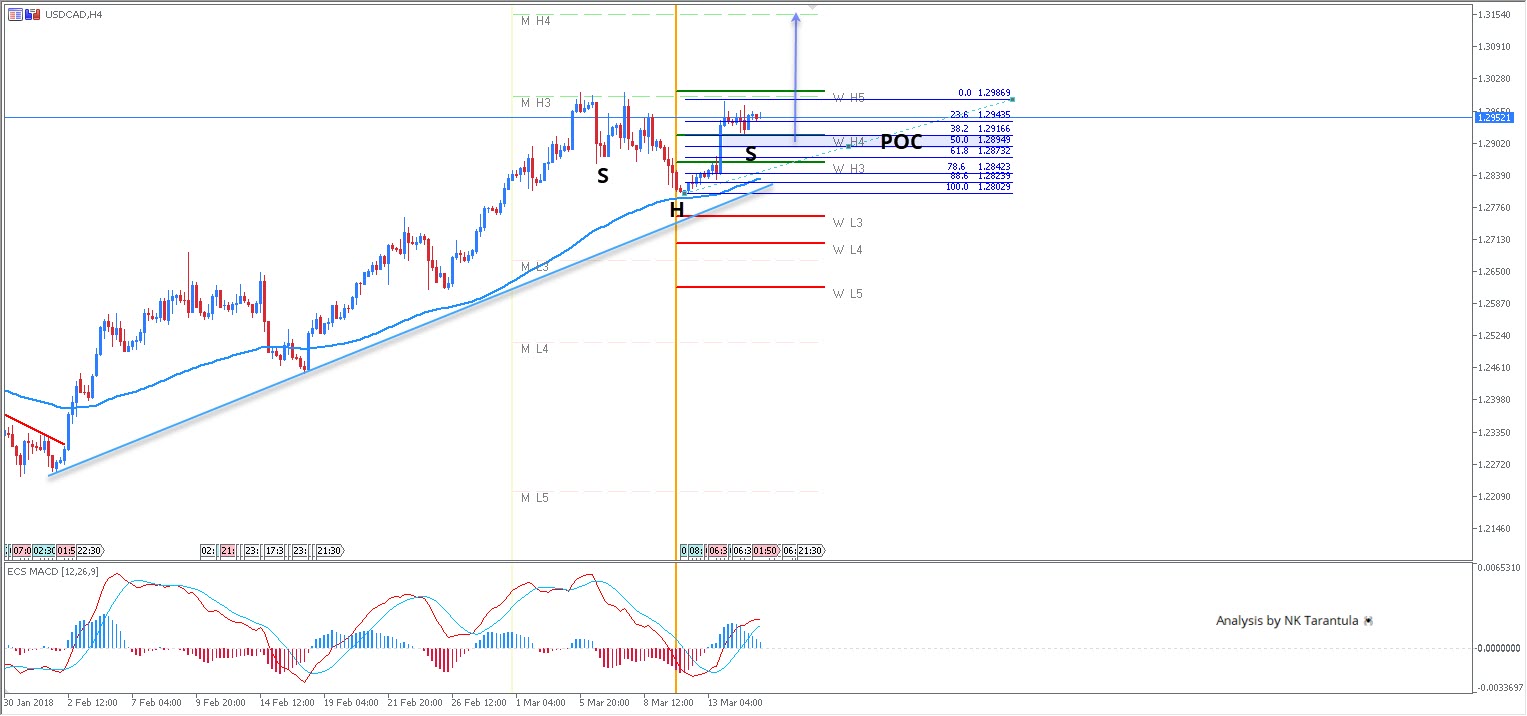
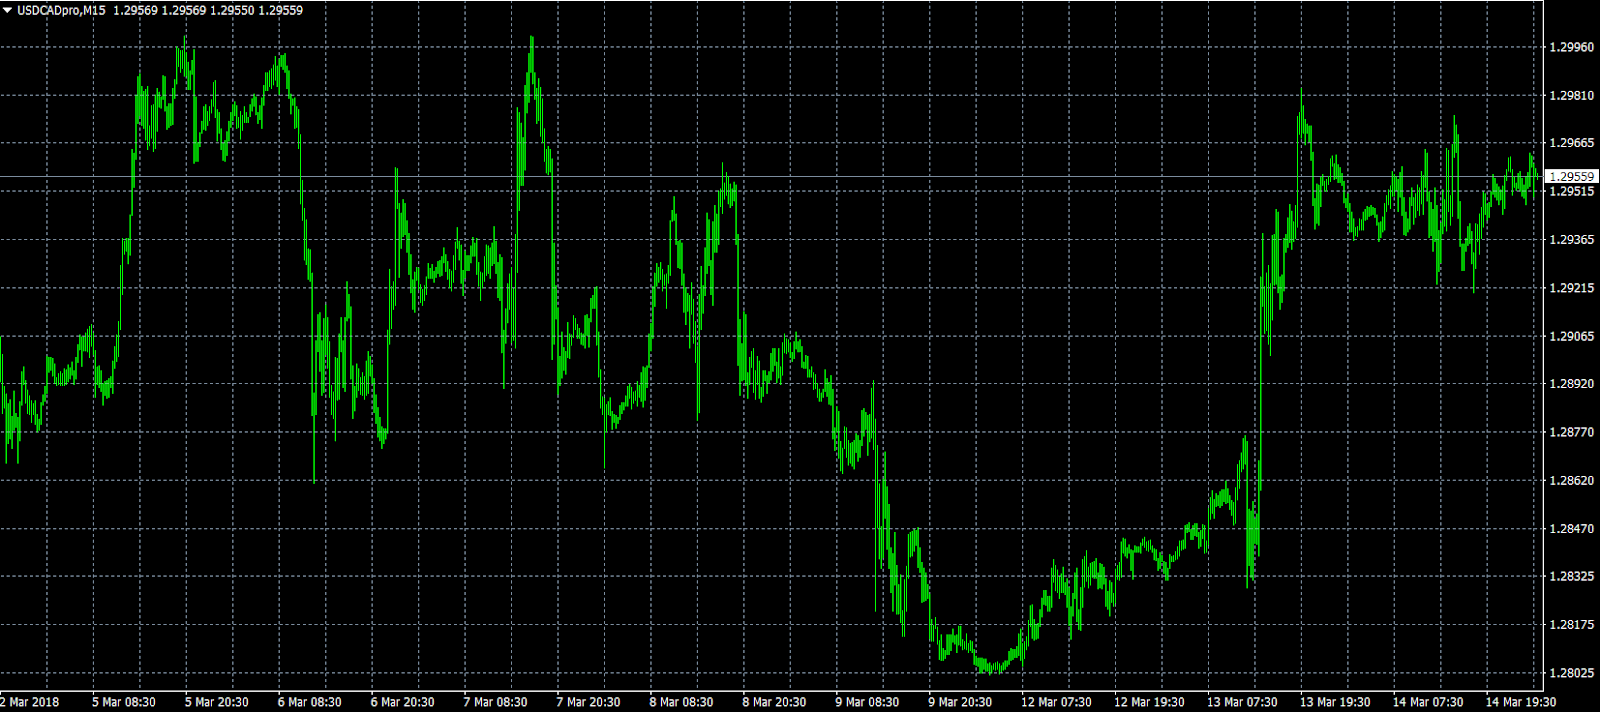
USD/CAD Bullish SHS Pattern For A Bounce Towards 1.3000 And Above
The USD/CAD has formed an inverted head and shoulder bullish pattern. The right shoulder has been formed, however the price could still retrace down before a possible bounce. At this point the price might go straight up (from 1.2943) or retrace exactly to POC then bounce. 1.2895-1.2915 is the POC zone so pay attention to it. Targets are 1.2990 – confluence of W H5 and M H3 camarilla pivots. This is a strong resistance zone and the pair needs a 4h close above 1.3000 to proceed further up. In that case, it could even target M H4 in upcoming days. As long as the pair is holding above 1.2800 it is bullish.
W H3 -Weekly Camarilla Pivot (Weekly Interim Resistance)
W L3 - Weekly Camarilla Pivot (Weekly Interim Support)
W H3 - Weekly Camarilla Pivot (Weekly Interim Resistance)
W H4 - Weekly Camarilla Pivot (Strong Weekly Resistance)
M H4 - Monthly Camarilla Pivot (Very Strong Monthly Resistance)
M L3 – Monthly Camarilla Pivot (Monthly Support)
M L4 – Monthly H4 Camarilla (Very Strong Monthly Support)
POC - Point Of Confluence (The zone where we expect price to react aka entry zone)
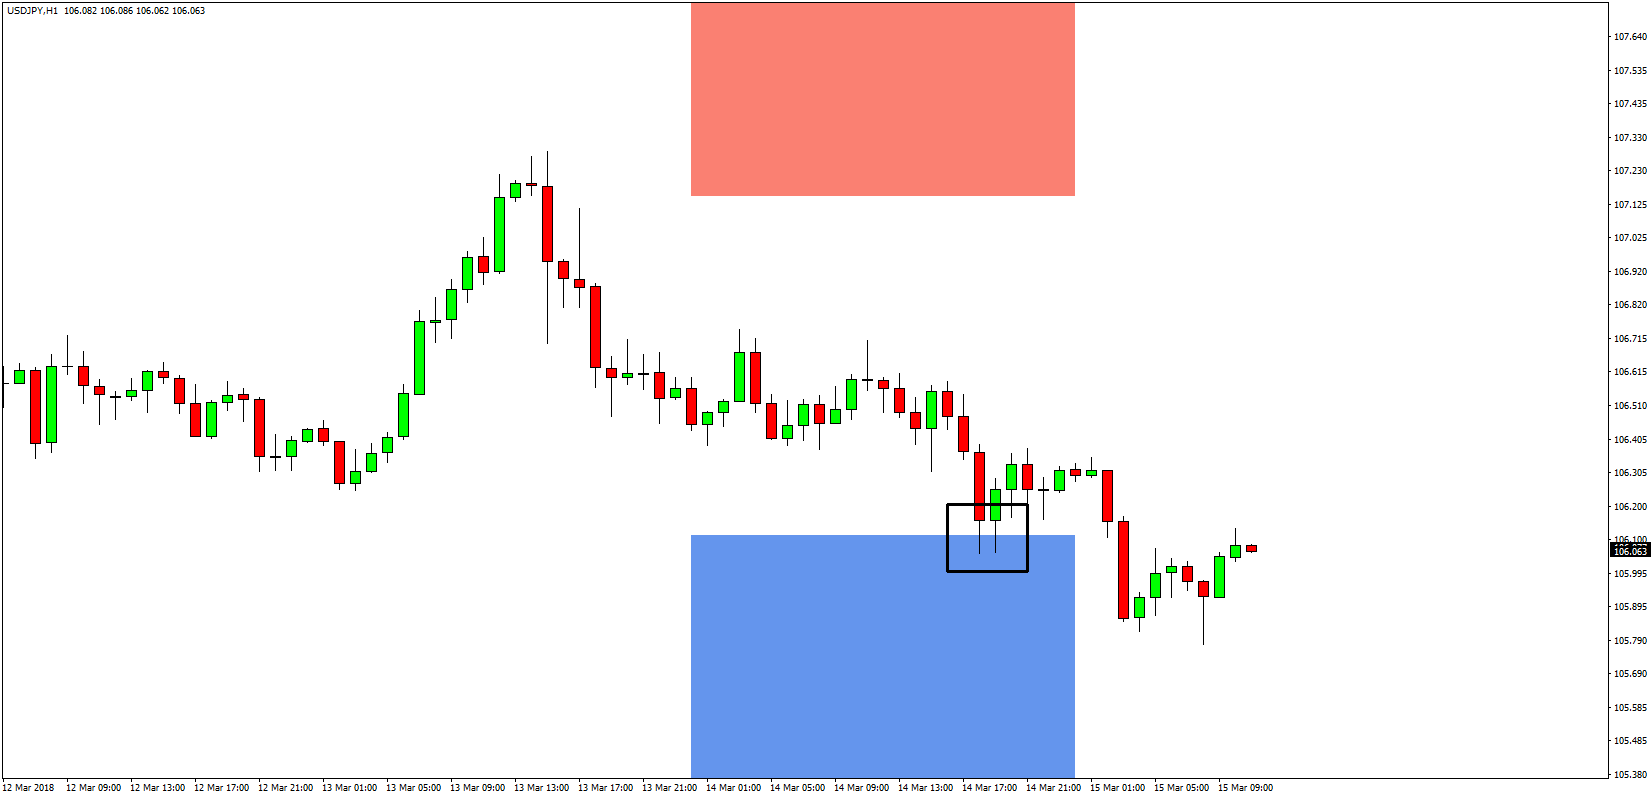
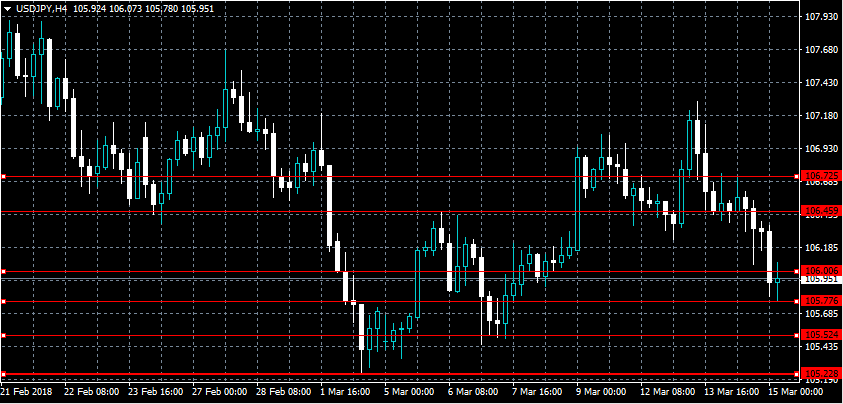
Technical Outlook: USDJPY – Bearish Bias Keeps 105 Zone In Focus But Bears May Hold Until FOMC
The pair holds in red in early Thursday's trading, maintaining negative tone for the second straight day after strong upside rejection at 107.29 on Tuesday.
Fresh weakness probes below 106 handle (Fibo 61.8% of 105.24/107.29 recovery leg) to generate further bearish signal on firm break lower.
Daily MA's are back to full bearish setup, 14-d momentum heads south and stays in the negative territory, keeping bearish bias.
Loss of 106 support would lead towards key supports at 105.24 (2018 low, the lowest since Oct 2016) and psychological 105 support.
However, bears need a catalyst for break lower, as loss of 105 handle would open way towards 100 zone and the pair may hold in prolonged consolidation until next week's FOMC policy meeting.
Res: 106.35; 106.55; 107.00; 107.20
Sup: 106.02; 105.78; 105.45; 105.24
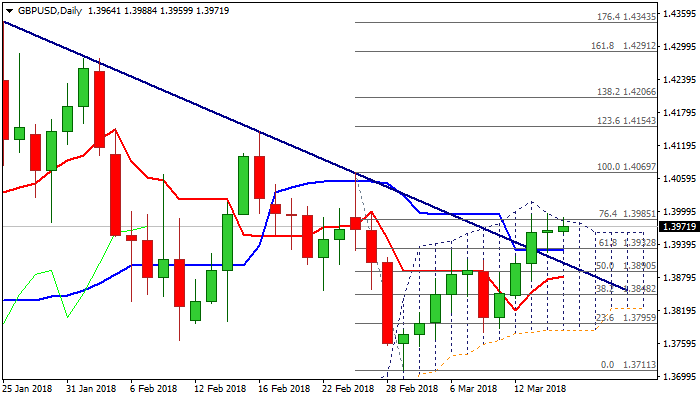
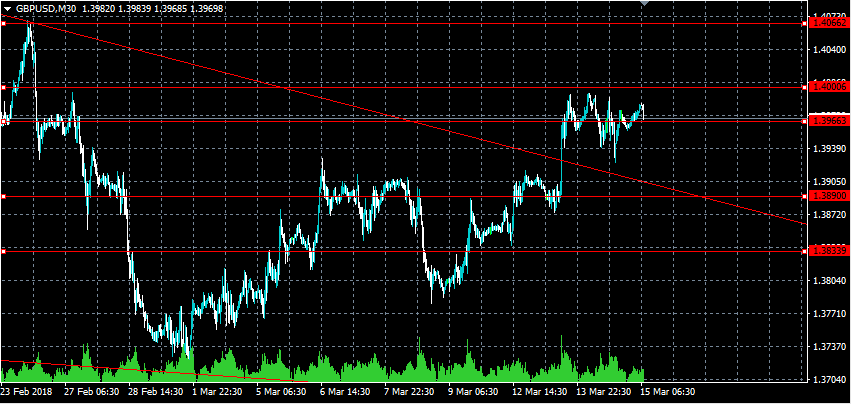
Technical Outlook: GBPUSD – Bullish Bias But Daily Cloud Top Continues To Limit Upside Attempts
Cable stands at the front foot on Thursday and pressures daily cloud top, after attempts in past two days failed here and Wednesday’s action ended in Doji candle, signaling indecision.
Bulls may show signs of stall on repeated failure to break higher, as momentum studies are neutral and overbought slow stochastic warns of pullback.
Strong offers in 1.40 zone continue to frustrate bulls which need clear break higher to signal continuation of recovery phase from 1.3711 (01 Mar low).
Bullish scenario sees extension towards 1.4070 (26 Feb high) and pivotal 1.4103 barrier (Fibo 61.8% of 1.4344/1.3711) on firm break above 1.40.
Repeated close below cloud top would be bearish signal which needs confirmation on extension below 1.3920/06 pivots (30SMA / broken bear-trendline off 1.4345 peak.
Res: 1.4000, 1.4069, 1.4103, 1.4144
Sup: 1.3960, 1.3920, 1.3906, 1.3880
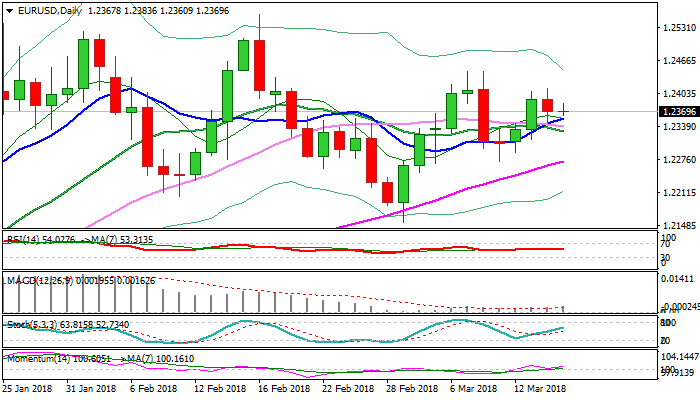
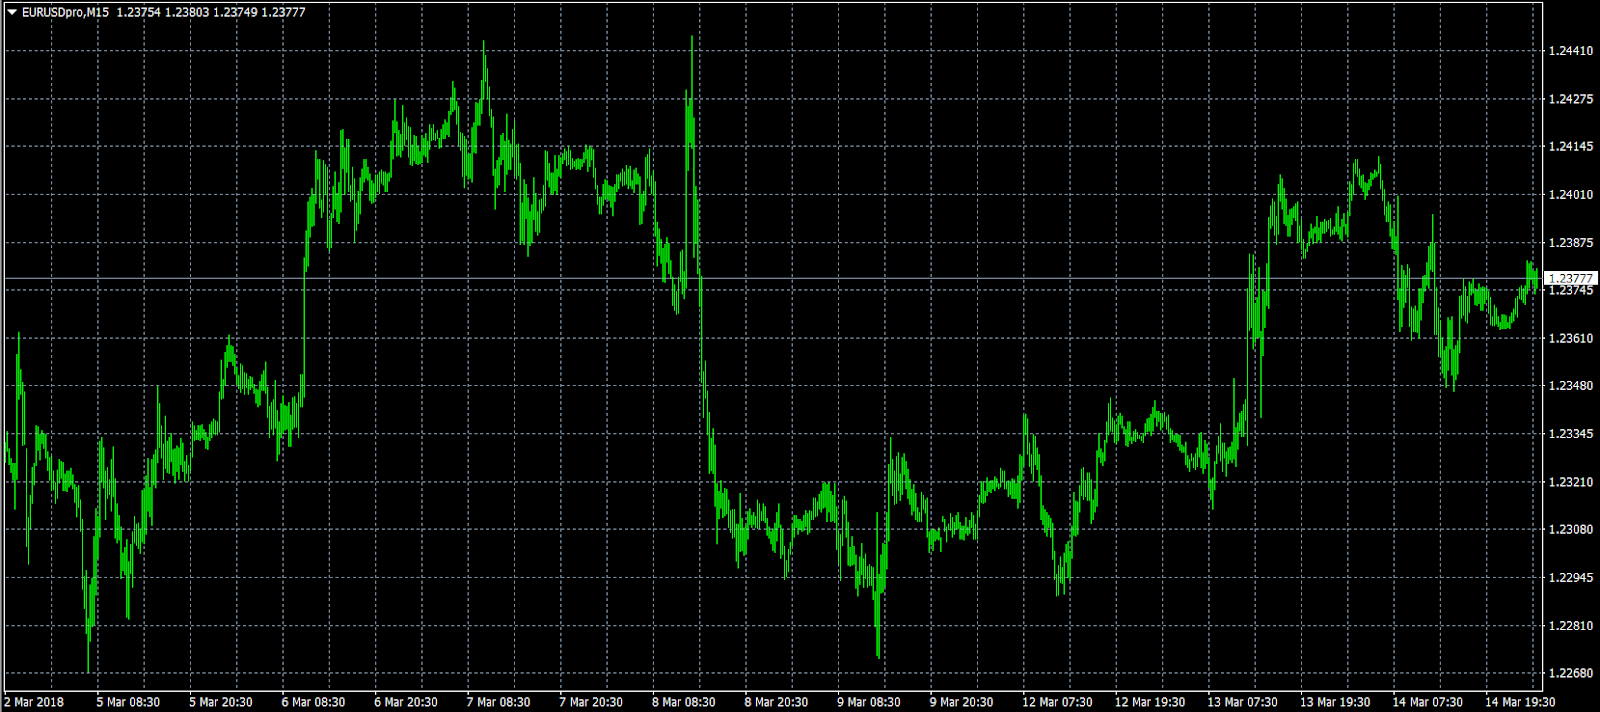
Technical Outlook: EURUSD – In Sideways Mode But Bullish Bias Above 10SMA
The Euro remains in sideways mode and within tight range at the beginning of European session, following quiet trading in Asia.
Wednesday’s close in red after repeated failure to clear 1.24 barrier weighs, but dips so far hold above pivotal supports at 1.2355 (converged daily Tenkan-sen/Kijun-sen in attempts to form bullish cross/10SMA).
Hopes for fresh upside are expected to remain in play while the latter supports hold, as MA’s are in bullish setup and momentum heads north in positive territory, keeping in play near-term bullish bias.
Overall action is underpinned by rising daily cloud, with cloud top marking next pivotal support at 1.2297.
Bulls need close above cracked 1.2400 barrier (Fibo 61.8% of 1.2555/1.2154 descend) to signal further recovery towards 1.2446 (07/08 Mar double top) and 1.2460 (Fibo 76.4%), with extension towards psychological 1.2500 barrier, seen on stronger acceleration.
The notion is supported by weaker dollar after US retail sales miss and persisting trade war fears.
Bearish scenario requires break of 10SMA (1.2355) and 20SMA (1.2330) as initial bearish signals to expose key supports at 1.2297 (daily cloud top) and 1.2272 (09 Mar low / rising 55SMA).
Res: 1.2383, 1.2412, 1.2446, 1.2460
Sup: 1.2355, 1.2330, 1.2297, 1.2272
10 Areas Where China Could Retaliate Vs US Measures
- There is little doubt that China would retaliate against any protectionist measures directed at it by the US. In this report we highlight 10 areas where China could strike back.
- Soybeans, grains and aircraft would likely be the most in scope as this could hurt Trump in politically important areas. US consumer goods in China could also suffer as a result of a potential (mild) consumer boycott.
- China could sell US treasuries, but we do not expect this to be the first line of defence as it would also hurt China and could lead to financial instability globally.
- While we expect China to retaliate against any protectionist measures from Trump, we believe it would tread carefully and not strike back too hard.
- Our baseline scenario is not a large-scale trade war. However, the risk remains as long as there are further trade measures looming.
We expect the next front in the global trade tensions to be between the US and China. This week, several media outlets reported that Trump is preparing direct protectionist measures against China and it seems to be more a matter of when than if when it comes to US action against China.
This would almost certainly lead to retaliation. In response to the US tariffs on steel and aluminium, China's vice-foreign minister, Zhang Yesui, said "we will not sit idly by and will take necessary measures if the US hurts China's interests". So where could China move? We provide a list of potential areas below:
1) Soybeans: China is the biggest buyer of US soybeans, accounting for 60% of US soybean exports. On concerns of a trade war, the American Soybean Association requested a meeting with Trump after he announced tariffs on steel and aluminium. A Chinese tariff on US soybeans would divert demand to other large soybean exporters such as Brazil and Argentina at the expense of US soybean farmers.
2) Beef: In a trade deal between Trump and Xi Jinping in May 2017, China opened up to US beef exports after a 14-year break. It gave the US access to the fastest-growing meat market in the world and Trump celebrated the deal with a tweet saying “China just agreed that the US will be allowed to sell beef, and other major products, into China once again. This is REAL news!” Commerce Secretary Wilbur Ross called the agreement a “herculean accomp lishment” and argued that the deal represented the biggest accomplishment in US-China trade negotiations “in the whole history of USChina relations”. However, China could step back from the deal and limit access again, thus hurting US beef exporters.
3) Aircraft: Next to soybeans, aircraft are the second-biggest US export good to China. It would not be hard to substitute Boeing aircraft with Airbus instead. China’s major airlines are state-owned enterprises and aircraft purchases could be changed easily from Boeing to Airbus.
4) Grains: Sorghum and other grains used for feeding livestock are also in scope for retaliation. Sorghum is farmed chiefly in the US for export to China. In February this year, China launched an anti-dumping probe into US sorghum exports - two weeks after Trump imposed tariffs on washing machines and solar panels. It was generally seen as a clear warning that sorghum could be targeted if needed in a retaliatory response.
5) November 2017 deals of USD250 billion: During Trump ’s visit to Beijing in November 2017, he came back to the US with trade deals worth USD250bn. One of the deals was the sale of 300 Boeing aircraft worth USD37bn alone. However, the deals were reported to be mainly in the form of memoranda of understanding, and China could choose to walk away from some of these.
6) Tariffs on a broad range of US goods: According to recent news reports, Trump is considering imposing tariffs on Chinese goods in a broad range of areas such as telecommunications and apparel. China could choose to take the same approach.
7) Consumer boycott: If sentiment among Chinese consumers turned against the US, it could hurt US brands. It could, for example, hurt US car sales in China, which in 2017 were worth close to USD10bn. As the fastest-growing consumer market in the world, even a ‘mild’ consumer boy cott in China would hurt US companies. A similar effect is not possible in the US, as China export s very few consumer brands to the US. Most consumer goods going from China to the US are actually US brands such as Apple and Nike.
8) US investments in China: If the US puts greater restrictions on Chinese investments in US companies, China may do the same to US investments in the country. China is currently opening up to foreign investments in new areas - for example in the financial sector. However, US companies could be discriminated against in terms of access to the Chinese market. This could happen both directly and indirectly by prolonging application processes, etc.
9) US treasury bonds: China holds more than USD1tr of US treasury bonds. A large sale of these could push up US bond yields. Selling US treasury bonds is not likely to be the first line of defence though, as it would lead to losses on China’s own p ortfolio and could easily cause havoc in financial markets and backfire on China.
10) Rare earth exports to the US: China has close to a monopoly in the 17 rare earth minerals, with around 90% of global mining. Rare earth minerals are used in products such as mobile phones, LED displays and atomic batteries that power guided missiles. In 2010, China halted exports of rare earth minerals to Japan after an incident that angered China. In 2011, prices spiked when China imposed export quotas on the minerals.
There are thus plenty of areas where China could retaliate and make it expensive for Trump to launch protectionist measures - both economically and politically. According to a story in The Washington Post, the chairman of AmCham China’s p olicy committee, Lester Ross, said it was likely that the Chinese authorities would target retaliation against sectors that have ‘political resonance’ in the US . In particular, “that might mean favouring Europe’s Airbus over Boeing for aircraft orders, or cutting imports of agricultura commodities, whose producers are predominantly in states that voted for Trump”. We agree that these are the most likely areas China would use in any retaliation.
However, we still expect China to tread carefully in order to not trigger even larger protectionist measures from Trump and start a tit -for-tat trade war that would hurt the Chinese economy on a larger scale. However, as long as new measures are looming, uncertainty over a potential escalation would remain
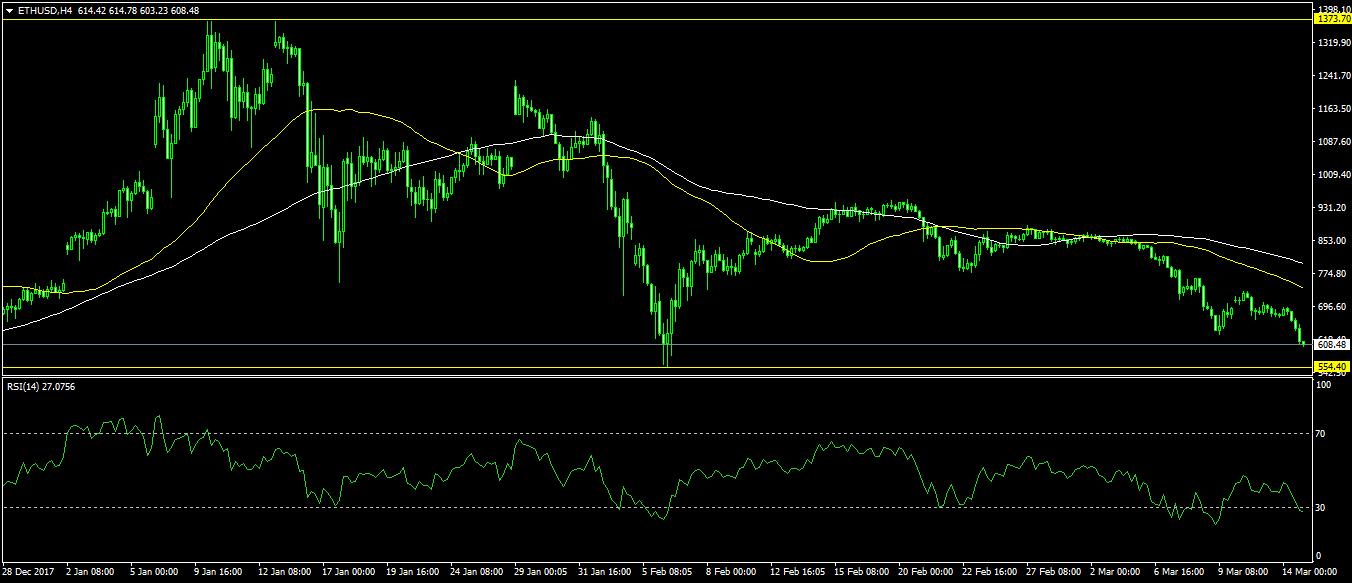
Ethereum Drops After Google Halts Ads On Cryptocurrencies
The Price of ethereum fell by more than 10% after Google announced that it would ban cryptocurrency related adverts on its platforms. The announcement came a month after Facebook, the second largest advertiser in the world, announced a similar move.
In a statement, the company said that starting from June, it will stop offering ads on certain financial products including cryptocurrency exchanges, Initial Coin Offerings (ICOs), and binary options.
Ethereum was more affected than other cryptocurrencies because of its connection with ICOs. Most ICOs are based on the technology that powers ethereum. It is currently trading at $615.
Without Google, it will be difficult for startups offering ICOs to market their products online. This is because Google is by far the largest advertiser in the world, reaching billions of people every month.
The news about Google came a few hours after one of the most respected professionals in finance said that the bubble on bitcoin was about to burst. In an interview with CNBC, Stefan Hofrichter, the head of global economics for Allianz Global Investors argued that the bubble on bitcoin and other cryptocurrencies will soon burst. The same sentiment was shared earlier this week by John Oliver, a popular comedian from the United States.
As shown below, the ETH/USD pair has been declining since January, when it peaked at $1373. The pair’s RSI is currently at 30, which is an indication that it is oversold. As such, in the short term, the pair could try to recover as short traders take profits.
USDJPY Intraday Bearish Below 106.45 Level
The U.S dollar has moved sharply lower against the Japanese yen, hitting 105.77 overnight, as U.S. President Donald Trump sought to impose fresh tariffs on the Chinese economy. The USDJPY pair also took as hit, as Retail Sales from the United States fell into negative territory for the second straight month, slumping lower by -0.1 percent. Moving into the European session, traders look toward the key 105.50 level for major support, whilst the 106.00 handle remains the most relevant short-term upside resistance level.
The USDJPY pair is intraday bearish while trading below the 106.45 level, further downside towards the 105.50 and 105.22 levels seems likely.
Should the USDJPY pair move above the 106.00 level, price-action may correct towards the pivotal 106.45 technical level.
GBPUSD Looking For Solid Gains Above 1.3966
The British pound remains strongly bullish against the greenback on Thursday, with price-action still well bid above the key 1.3920 level. The GBPUSD currently trades around the 1.3970 level, with sterling buyers yesterday meeting demand around the 1.3920 region, which represents the pairs key monthly pivot point. GBPUSD buyers continue to press for further gains above the 1.3966 level, whilst sellers look for sustained intraday weakness below the 1.3920 level.
The GBPUSD pair is intraday bullish whilst trading above the 1.3920 level, key resistance is found at the 1.4000 and 1.4066 levels.
Should the GBPUSD pair move below the 1.3920 level, sellers will then likely target the 1.3889 and 1.3833 support levels.
Data Dump Continues On Thursday
Economic data will continue to make the rounds on Thursday, with most of the action centred on North American markets. A policy meeting at the Swiss National Bank (SNB) will also get media attention, although no changes are expected.
The European session begins at 07:45 GMT with a report on French inflation. France’s consumer price index (CPI) is forecast to weaken to 1.3% annually in February, compared with 1.4% the previous month. Compared to the previous month, no change in CPI is expected.
The Swiss government will also report on producer inflation at 08:15 GMT, leading to the SNB policy statement fifteen minutes later. The central bank is widely expected to keep its benchmark interest rate in negative territory at -0.75%.
The final European release on the day will come from Greece at 10:00 GMT when the national statistics agency reports on unemployment.
Shifting gears to North America, the New York Federal Reserve Bank will issue its monthly report on manufacturing at 12:30 GMT. The Empire State manufacturing index is projected to rise to 15.0 in March from 13.1 the previous month.
In a separate report, the Philadelphia Fed will also report on regional manufacturing conditions. However, the Philadelphia reading is expected to show a decline of 2.8 points to 23.0 in March.
At the same time, the Department of Labor will release the weekly data set on jobless claims. The number of Americans filing for first-time unemployment benefits is projected to fall by 5,000 to a seasonally adjusted 226,000 in the week ended 10 March.
Later in the session, the National Association of Home Builders (NAHB) will release the March housing market index, which is seen as an important barometer of homebuilder confidence.
North of the border, the ADP payrolls institute will report on private sector job creation for Canada. Last Friday, Canada reported a net gain of 15,400 jobs for February.
EUR/USD
Europe’s common currency pushed higher on Wednesday but failed to cross the 1.2400 US threshold. The EUR/USD exchange rate was last seen trading at 1.2381, where it was up 0.1% from the previous close. Immediate resistance is likely found at 1.2412, followed by 1.2447.
USD/CAD
The US dollar was back on the offensive Wednesday, as investors continued to react to dovish statements from BOC Governor Stephen Poloz. The USD/CAD is currently trading in the mid-1.2900 region, with investors awaiting from catalysts in the form of economic data.
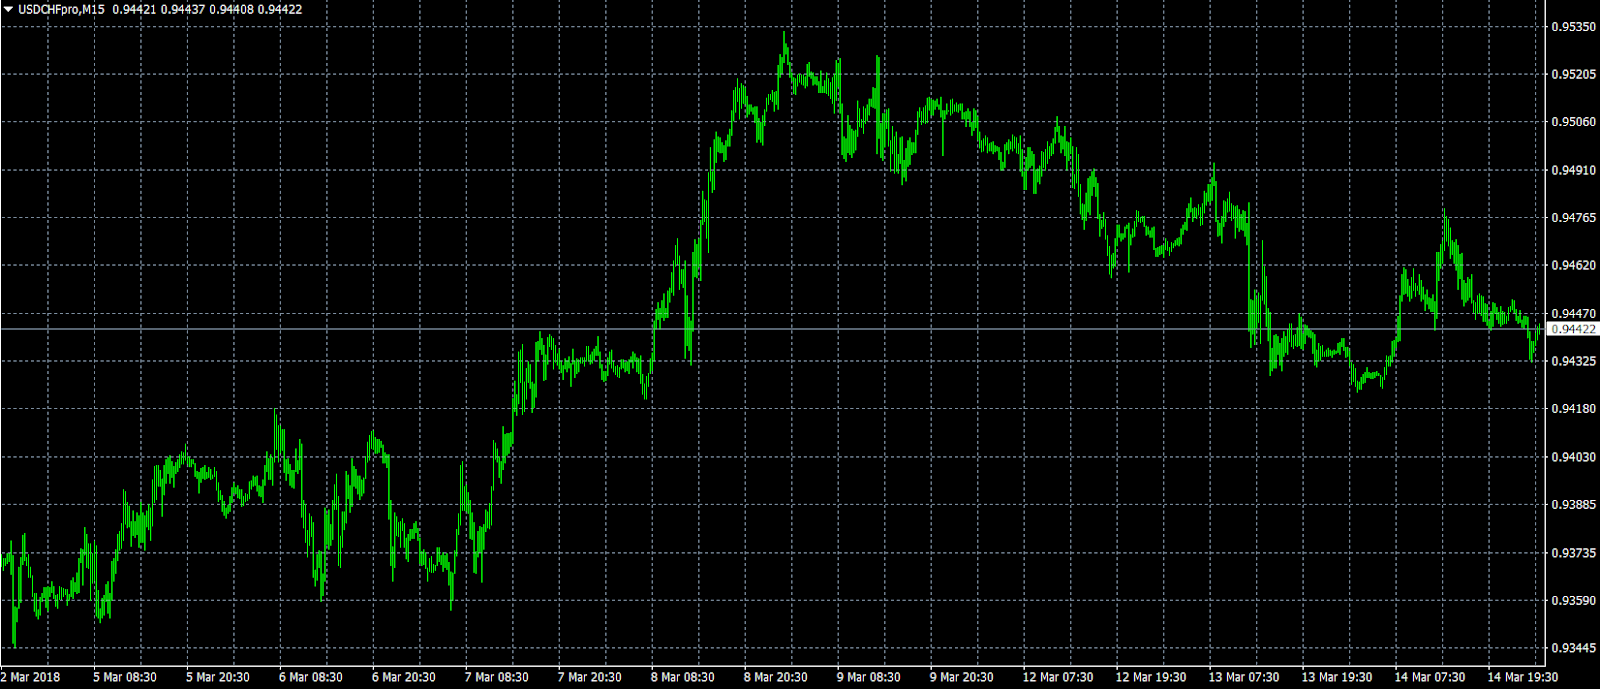
USD/CHF
After weeks of steady progress, the USD/CHF has declined over the past two sessions amid heightened geopolitical and trade risks involving the United States. The pair now trades at 0.9444, with immediate support located at 0.9300. The pair will remain under pressure insofar as it trades below the 0.9535 resistance.