
Sample Category Title
USD/CHF Daily Outlook
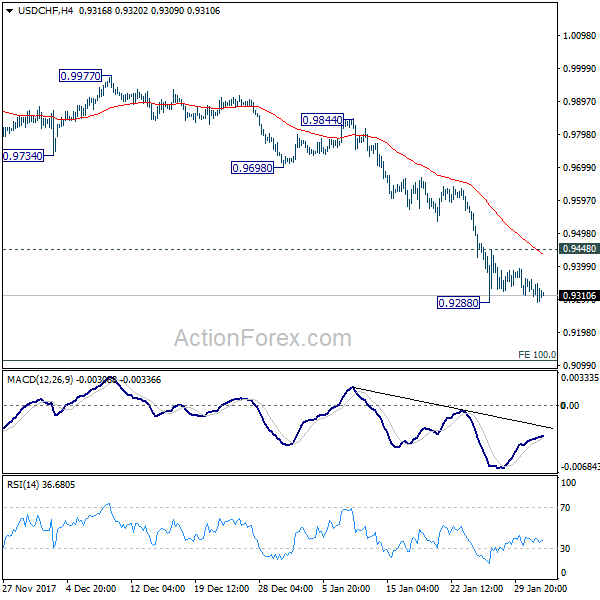
Daily Pivots: (S1) 0.9281; (P) 0.9320; (R1) 0.9350; More...
USD/CHF is still bounded in range trading above 0.9288 temporary low at this point. And intraday bias remains neutral. Another recovery could be seen as consolidation extends. But after all, as long as 0.9448 minor resistance holds, near term outlook stays bearish. Break of 0.9288 will extend larger down trend to next key fibonacci level at 0.9115. Nonetheless, break of 0.9448 will indicate short term bottoming and bring stronger rebound.
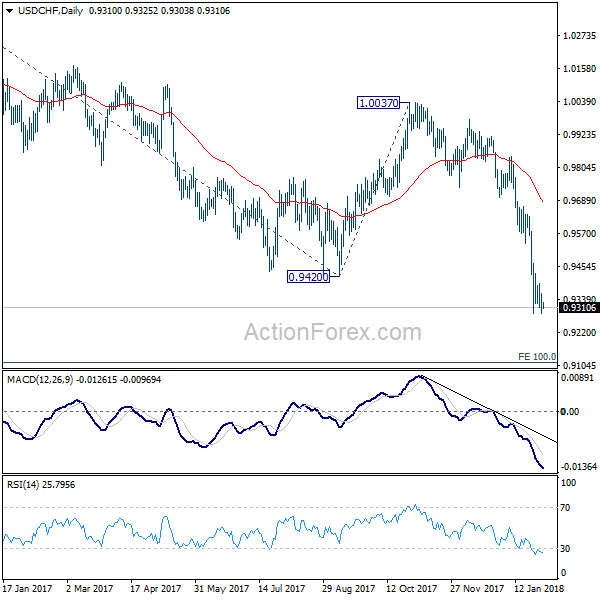
In the bigger picture, the strong break of 0.9420 support suggests that fall from 1.0342 is developing into a medium term down trend. Deeper fall should be seen to 100% projection of 1.0342 to 0.9420 from 1.0037 at 0.9115. Break will target 161.8% projection at 08545. In any case, break of 0.9640 resistance is needed to be the first sign of medium term bottoming. Otherwise, outlook will stay bearish even in case of strong rebound.
USD/JPY Daily Outlook
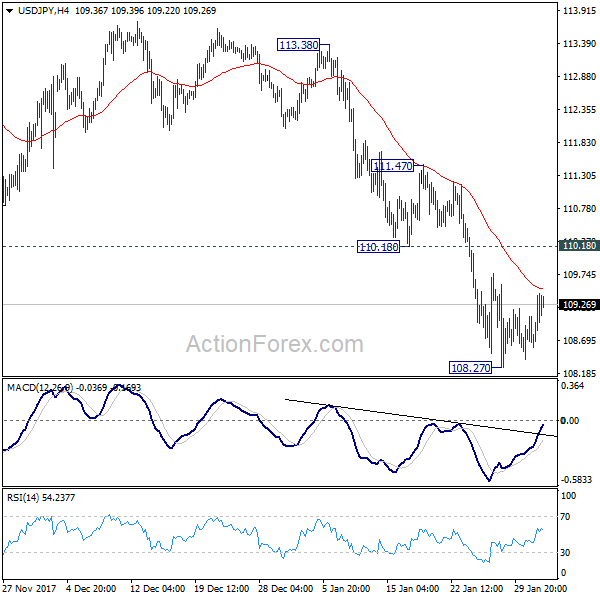
Daily Pivots: (S1) 108.69; (P) 109.07; (R1) 109.54; More...
USD/JPY recovers as consolidation from 108.27 temporary low continues. Intraday bias stays neutral first. As long as 110.18 resistance holds, deeper decline is expected. On the downside, break of 108.27 will extend recent fall through 107.31 support to next fibonacci support at 106.48. Nonetheless, break of 110.18 will be the first sign of near term reversal and will turn bias back to the upside for 111.47 resistance.
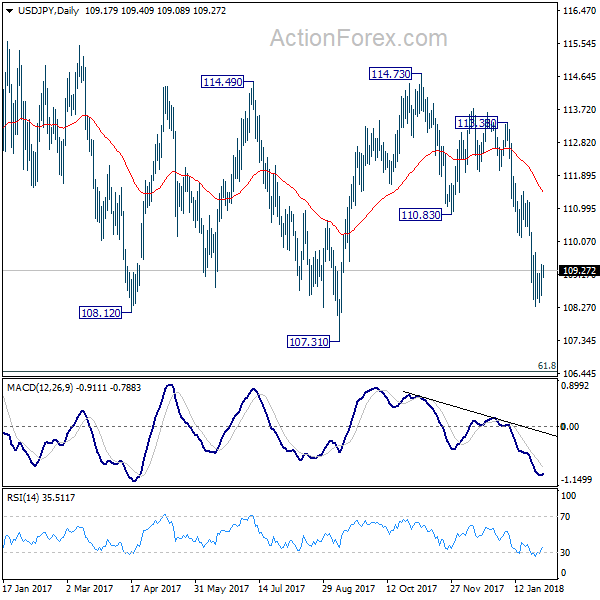
In the bigger picture, current development argues that the corrective pattern from 118.65 is extending. There is risk of dropping further to 61.8% retracement of 98.97 to 118.65 at 106.48. But this level should provide strong support to contain downside and bring resumption of rise from 98.97. However, sustained break of 106.48 will now likely send USD/JPY through 98.97 to resume the corrective fall from 125.85 (2015 high).
USD/CAD Daily Outlook
Daily Pivots: (S1) 1.2258; (P) 1.2302; (R1) 1.2359; More...
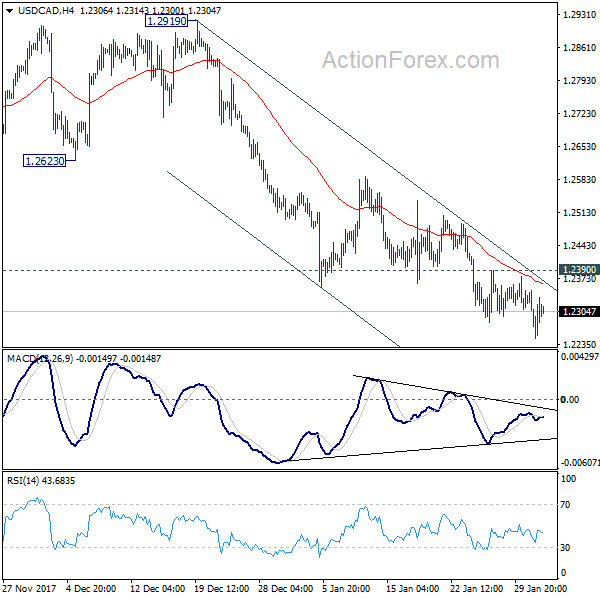
Intraday bias in USD/CAD remains on the downside for the moment. Current decline from 1.2919 would extend to retest 1.2061 low. Decisive break there will resume larger down trend. However, considering bullish convergence condition in 4 hour MACD, break of 1.2390 minor resistance should indicate short term bottoming. In this case, intraday bias will be turned back to the upside for rebound to 55 day EMA (now at 1.2541).
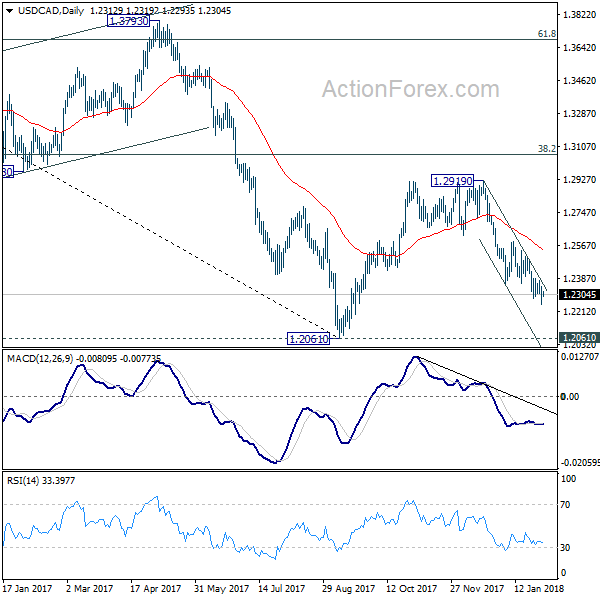
In the bigger picture, rebound from 1.2061 is likely completed completed at 1.2919, rejected by 55 week EMA and kept below 38.2% retracement of 1.4689 to 1.2061 at 1.3065. The development also suggests that long term fall from 1.4689 is not completed yet. Decisive break of 1.2061 low will target 61.8% retracement of 0.9406 to 1.4689 at 1.1424. This will now be the favored case as long as 1.2919 resistance holds.
Market Morning Briefing: Euro Reached A High Of 1.2475 Yesterday
STOCKS
Dow (26149.39, +0.28%) was almost stable yesterday. Note that 25700-26000 is a crucial near term support region which may hold, keeping the index range-bound within 26700-25700 levels.
Dax (13189.48, -0.06%) is likely to move down slowly towards 13100-13000 support levels from where a bounce could be expected in the medium term.
Nikkei (23410.66, +1.35%) has moved up from levels above 23000. Although there is some more room on the downside towards 23000-22800 levels, the index may try to move up towards 23800-24000 again in the next few sessions.
Shanghai (3471.28, -0.27%) is headed lower and could target 3450-3400 levels in the near term. View is bearish for the coming sessions.
Nifty (11027.70, -0.20%) has come off below 11040 but is testing interim support near 10980. A break below 10980 is needed to confirm an upcoming short dip towards 10900-10800 in the medium term.
Sensex (35965.02, -0.19%) is also trading just above support at 35750. A break on the downside could initiate a short term dip towards 35000. Near term looks bearish.
COMMODITIES
Brent (68.97) is likely to respect the support near 68 and while that holds, the price could possibly trade in the 72/71-68 region for some time. 68 needs to break on the downside to confirm a down leg which may extend to lower levels of 67-65; but we wait for confirmation before looking at lower levels. For now a bounce from 68 is preferred.
WTI (64.81) has moved up from 64 but has some scope of testing 63.0-62.8 on the downside before again trying to move up eventually.
Brent-WTI spread (4.16) came off sharply from 4.51 seen yesterday. As mentioned, there is room on the downside towards 3.5 and the spread seems to be moving towards that gradually.
Gold (1343.18) has moved up contrary to our expectation of a fall towards 1325/20. That is possibly because of the 21-day MA acting as support (See daily line chart) and while that holds, the price could move up towards 1350-1360 again. As long as the price remains above 1340, we may negate a fall towards 1320 for some time.
Copper (3.2090) is stuck in the 3.25-3.12 region and may trade within this range for another 1-2 sessions before breaking on either side. Support is visible near 3.10-3.15 region and while that holds, the scope for an upside break seems more likely. We may prefer an eventual rise towards 3.25 and higher in the near to medium term.
FOREX
Dollar Index (89.101) continues its ranging between 89.1-89.2 inspite of the Fed maintaining its hawkish tone and indicating that the next rate cut could happen in March’18.US short term yields (see Interest Rates below) have risen significantly since yesterday and we might just see the positive correlation between US yields and Dollar strength return in the coming week. On the weekly line charts, Dollar Index is trading just above long term support near 89 and a gradual rise from here can be expected soon.
Euro (1.2414) reached a high of 1.2475 yesterday and tested resistance on daily candles. The last couple of days have been largely indecisive in terms of directional clarity for the Euro. However on both days, Euro has tried testing resistance on the daily candles and has come off from there subsequently. This might be an indication that a decisive dip towards 1.23 (support on weekly candles) could begin soon.
Dollar-Yen (109.35) as per expectations, is moving up to test resistance near 109.5 on the daily candles. With the Bank of Japan increasing the amount of government debt it will buy, we need to see how yields react to that. As mentioned yesterday, the premium offered by US yields relative to Japanese yields have always impacted Dollar-Yen positively and the same might resume in the days to come.
Euro-Yen (135.77) might move towards 136 in the next couple of sessions before seeing a dip. There is immediate support near 135.0-135.2 on the daily, 3 day and weekly line charts which should continue to hold in the near term.
Pound (1.4193), continues to trade near resistance on the 3 day candles (near 1.42) . If it breaches this resistance, it could move upto the next resistance near 1.44 on the weekly candles and then see a dip.
Dollar-Rupee (63.65) should be ranged between 63.50-80 today morning.
INTEREST RATES
US short term yields have seen a rise to record levels as the Treasury announced larger sales of short dated government debt. This has led to a knee jerk flattening of the yield curve as well.
US 10 Yr (2.7237%), 30 Yr (2.9438%), 5 Yr (2.5374%) & 2 Yr (2.1607%) – The 30 Year yield has dropped since yesterday while the rest have all risen. The rise in 10 Yr has been much lesser while 5 Yr and 2 Yr are now at long term resistance levels near 2.5-2.6% and 2.2% respectively (these resistances are shown on long term charts in our January Treasury report – available on request). Both these resistances are seen on trend lines which join resistance levels over the last 30 years – thereby making us believe that the short term yields shouldn’t rise much further.
Yield spreads have broken support levels as yield curve flattening increases. US 10 Yr-5Yr (0.1863%) is below 0.2% (seen as support on short term charts) and US 30 Yr – 10 Yr (0.22%) has gone below 0.24% (seen as support on long term charts).
Gold Price Forming Short-Term Top?
Key Highlights
- Gold price is in a monster uptrend and it recently traded above the $1,360 level against the US Dollar.
- It seems like a short-term correction is underway with a break of a bullish trend line with support at $1,350 on the daily chart of XAU/USD.
- The US ADP Employment Change in January 2018 was 234K, more than the forecast of 185K.
- The Fed interest rate decision was announced yesterday in which the central bank kept rates at 1.50%.
Gold Price Technical Analysis
There were a lot of bullish moves in Gold price during the past few weeks as it traded above the $1,300 and $1,350 resistance levels. At the moment, the price is likely correcting lower and it may test the $1,330 and $1,320 support levels.
Looking at the daily chart of XAU/USD, there are many green candles visible, suggesting a solid uptrend from the $1,236 low. The price gained a lot of bids and recently traded as high as $1,366.
However, it seems like there is a short-term top carving from the $1,366 level. There was a break below a bullish trend line with support at $1,350 on the daily chart. The price tested the 23.6% Fib retracement level of the last leg from the $1,236 low to $1,366 high at $1,355.
Should buyers fail to hold the $1,335 support level, there is a chance of further declines in the short term. The next major support is around the $1,300 handle. The mentioned $1,300 support also coincides with the 50% Fib retracement level of the last leg from the $1,236 low to $1,366 high.
Therefore, $1,300 support level can be considered as a pivot level and a strong buy zone. On the flip side, if the price resumes its uptrend, it could easily retest the last swing high of $1,366.
US ADP Employment Change and Fed Interest Rate Decision
Recently, the US saw two important releases. First, the ADP Employment Change was published by the Automatic Data Processing, Inc. for Jan 2018. The market was looking for a change of 185K.
The actual was much better as the change in the ADP Employment was 234K in Jan 2018. However, this was a bit less than the last revised reading of 242K.
The second and the most important release was the Fed interest rate decision. The central bank decided to keep interest rates at 1.50%. There was no major impact on the market and pairs like EUR/USD and GBP/USD remained in the bullish zone.
On the other hand, the USD/JPY pair seems to be forming a support base above 108.50 and is currently preparing for an upside correction.
AUD/USD Daily Outlook
Daily Pivots: (S1) 0.8021; (P) 0.8069; (R1) 0.8104; More...
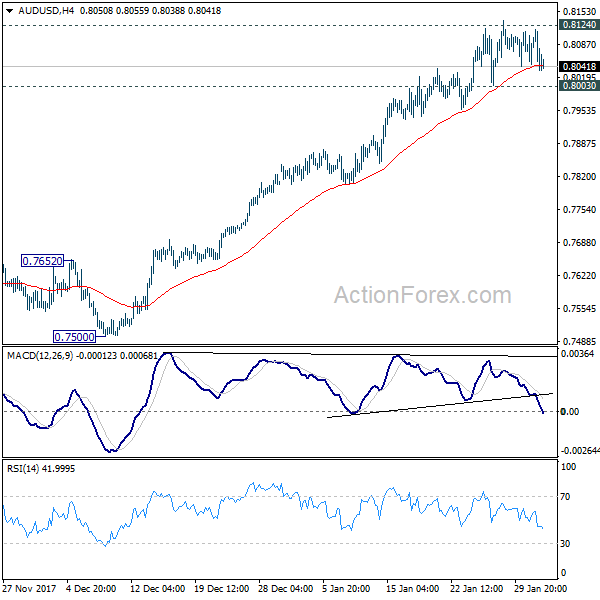
AUD/USD is staying in consolidation below 0.8124 key resistance and intraday bias remains neutral for the moment. Again, as long as 0.8003 support holds, further rally is expected. Sustained break of 0.8124 resistance will resume whole medium term rebound from 0.6826 and target key fibonacci level at 0.8451. However, on the downside, break of 0.8003 support will indicate short term topping, likely with bearish divergence condition in 4 hour MACD. And in such case, intraday bias will be turned back to the downside for 55 day EMA (now at 0.7851).
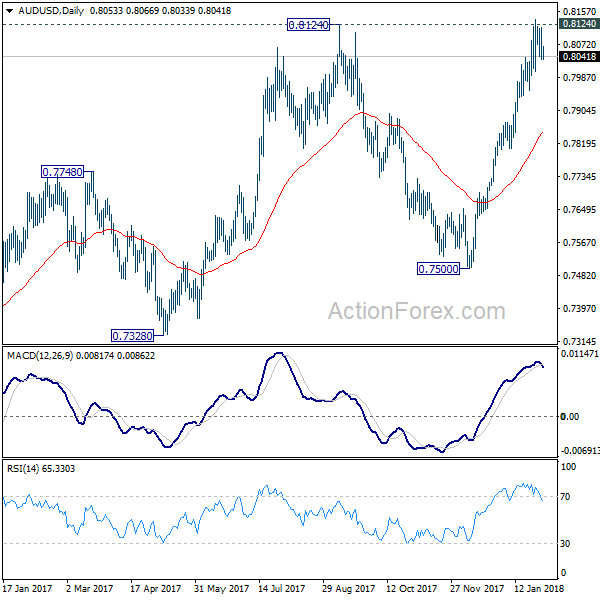
In the bigger picture, current development suggests that medium term rebound from 0.6826 is still in progress and could be resuming. Such rise could target 38.2% retracement of 1.1079 (2011 high) to 0.6826 (2016 low) at 0.8451. As such rise is seen as a corrective move, we'd expect strong resistance from 0.8451 to limit upside and bring reversal.
Dollar Stays Range-Bound as Supported by FOMC Statement
Dollar remains generally in range after getting some mild support from FOMC statement. While there was sign of building up of downward pressure prior to FOMC, it seems that traders are holding their bets ahead of Friday's non-farm payroll report. Price patterns in most dollar pairs suggest that they are turning into more prolonged near term consolidation. There is still no clear sign of reversal yet. Elsewhere in the forex markets are also mixed as the actions are mostly consolidative.
FOMC on hold, statement slightly hawkish
Overnight, FOMC voted unanimously to leave the Fed funds rate unchanged at 1.25-1.5%. There were some minor changes in the accompanying statement but the theme continues to suggest that that gradual removal of monetary stimulus remains on track. Policymakers eventually took out the impacts of hurricanes in its economic forecasts and continued to see 'solid' growth in' employment, household spending and business fixed investment'. Meanwhile, they acknowledged that core inflation has stopped declining, thus allowing them to maintain the view that inflation would strengthen this year then stabilize at around the 2% objective.
The Fed reaffirmed the pledge to monitor the development closely. The market viewed the meeting outcome as slightly hawkish, sending Treasury yields modestly higher. CME's 30-day Fed funds futures suggest that the market has now priced in 80% chance of rate hike in March, up from 74% before the announcement. Other barometers have suggested that chance of a March rate hike has increased to 90%. More in FOMC More Optimistic On Inflation Outlook, Indicated 'Further Increase' In Interest Rates
Also on FOMC:
- January FOMC: Moving In the Right Direction
- Yellen's Final FOMC Meeting a Non-Event as Rates Held Steady
- Fed Leaves Rates Steady in Yellen's Last Meeting as Chair
China Caixin PMI manufacturing showed resilience
China Caixin PMI manufacturing was unchanged at 61.6 in January, meeting expectations. The survey showed resilience in the small to mid-sized manufacturing sector in the country. Zhengsheng Zhong, director of macroeconomic analysis at CEBM Group, a subsidiary of Caixin, noted that "the manufacturing industry had a good start to 2018. Going forward, we should keep a close eye on the stability of the demand side."
Also from Asia pacific, Australia import price index rose 1.5% qoq in Q4. Building approvals dropped sharply by -20% mom in December. Japan PMI manufacturing was revised up by 0.4 to 54.8 in January.
Looking ahead
Manufacturing data will be the key focuses today. Swiss will release PMI manufacturing, retail sales and SECO consumer confidence. Eurozone will release PMI manufacturing revision. UK will also release PMI manufacturing. From US, ISM manufacturing will be featured, together with Challenger job cuts, non-farm productivity, jobless claims and construction spending.
AUD/USD Daily Outlook
Daily Pivots: (S1) 0.8021; (P) 0.8069; (R1) 0.8104; More...
AUD/USD is staying in consolidation below 0.8124 key resistance and intraday bias remains neutral for the moment. Again, as long as 0.8003 support holds, further rally is expected. Sustained break of 0.8124 resistance will resume whole medium term rebound from 0.6826 and target key fibonacci level at 0.8451. However, on the downside, break of 0.8003 support will indicate short term topping, likely with bearish divergence condition in 4 hour MACD. And in such case, intraday bias will be turned back to the downside for 55 day EMA (now at 0.7851).
In the bigger picture, current development suggests that medium term rebound from 0.6826 is still in progress and could be resuming. Such rise could target 38.2% retracement of 1.1079 (2011 high) to 0.6826 (2016 low) at 0.8451. As such rise is seen as a corrective move, we'd expect strong resistance from 0.8451 to limit upside and bring reversal.
Economic Indicators Update
| GMT | Ccy | Events | Actual | Forecast | Previous | Revised |
|---|---|---|---|---|---|---|
| 0:30 | AUD | Import price index Q/Q Q4 | 1.50% | 1.50% | -1.60% | |
| 0:30 | AUD | Building Approvals M/M Dec | -20.00% | -7.60% | 11.70% | 12.60% |
| 0:30 | JPY | PMI Manufacturing Jan F | 54.8 | 54.4 | ||
| 1:45 | CNY | Caixin PMI Manufacturing Jan | 51.5 | 51.5 | 51.5 | |
| 6:45 | CHF | SECO Consumer Confidence Jan | 2 | -2 | ||
| 8:15 | CHF | Retail Sales Y/Y Dec | -0.20% | |||
| 8:30 | CHF | PMI Manufacturing Jan | 64.1 | 65.2 | ||
| 8:45 | EUR | Italy Manufacturing PMI Jan | 57.3 | 57.4 | ||
| 8:50 | EUR | France Manufacturing PMI Jan F | 58.1 | 58.1 | ||
| 8:55 | EUR | Germany Manufacturing PMI Jan F | 61.2 | 61.2 | ||
| 9:00 | EUR | Eurozone Manufacturing PMI Jan F | 59.6 | 59.6 | ||
| 9:30 | GBP | PMI Manufacturing Jan | 56.5 | 56.3 | ||
| 12:30 | USD | Challenger Job Cuts Y/Y Jan | -3.60% | |||
| 13:30 | USD | Nonfarm Productivity Q4 P | 1.10% | 3.00% | ||
| 13:30 | USD | Unit Labor Costs Q4 P | 1.00% | -0.20% | ||
| 13:30 | USD | Initial Jobless Claims (JAN 27) | 236K | 233K | ||
| 14:45 | USD | Manufacturing PMI Jan F | 55.5 | 55.5 | ||
| 15:00 | USD | Construction Spending M/M Dec | 0.40% | 0.80% | ||
| 15:00 | USD | ISM Manufacturing Jan | 58.6 | 59.7 | ||
| 15:00 | USD | ISM Prices Paid Jan | 69.5 | 69 | ||
| 15:30 | USD | Natural Gas Storage | -288B |
FOMC More Optimistic On Inflation Outlook, Indicated ‘Further Increase’ In Interest Rates
The FOMC voted unanimously to leave the Fed funds rate unchanged at 1.25-1.5% in January. There were some minor changes in the accompanying statement but the theme continues to suggest that that gradual removal of monetary stimulus remains on track. Policymakers eventually took out the impacts of hurricanes in its economic forecasts and continued to see 'solid' growth in' employment, household spending and business fixed investment'. Meanwhile, they acknowledged that core inflation has stopped declining, thus allowing them to maintain the view that inflation would strengthen this year then stabilize at around the 2% objective. The Fed reaffirmed the pledge to monitor the development closely. The market viewed the meeting outcome as slightly hawkish, sending Treasury yields modestly higher. CME’s 30-day Fed funds futures suggest that the market has now priced in 80% chance of rate hike in March, up from 74% before the announcement. Other barometers have suggested that chance of a March rate hike has increased to 90%.
On the economic developments, the Fed indicated that 'gains in employment, household spending, and business fixed investment have been solid'. This was compared with the reference in the previous month that household spending was 'expanding at a moderate pace' while business investment spending picked up in recent quarters'. The language on inflation appeared slightly more upbeat. As noted in the statement, 'on a 12-month basis, both overall inflation and inflation for items other than food and energy have continued to run below 2%'. In December, the Fed indicated that the abovementioned index 'declined' in 2017. Moreover, the Fed noted that 'market-based measures of inflation compensation have increased in recent months but remain low; survey-based measures of longer-term inflation expectations are little changed, on balance'. It did not acknowledge the increase in the prior month.
On the monetary policy outlook, what drove the market more hawkish was the use of the word 'further'. In the second paragraph, the market noted that 'with further gradual adjustments in the stance of monetary policy, economic activity will expand at a moderate pace and labor market conditions will remain strong'. This was followed by concluding statement which suggested that 'the Committee expects that economic conditions will evolve in a manner that will warrant further gradual increases in the federal funds rate'.
January FOMC: Moving In the Right Direction
The FOMC left interest rates unchanged but upgraded their assessment of economic growth and the inflation outlook. The policy statement noted that the Fed intends to continue to gradually tighten monetary policy.
Short, Simple and Succinct
The Fed kept things simple at its January FOMC meeting. There were no surprises. Policy remained unchanged and the only modest changes were made to the policy statement, aside from removing language inserted following this past fall's hurricanes. Committee members firmed up their assessment of the economic environment, noting that "employment, household spending and business fixed investment have been solid and that the unemployment rate had stayed low." The Fed also acknowledged that "market-based measures of inflation compensation have increased in recent months but remain low." In short, the Fed sees the economy moving in the right direction but not at a pace that warrants a more hawkish posture.
Mission Accomplished? At Least Partly So.
The minimal changes made to the policy statement also help make for a smooth transition of the Fed's leadership from Janet Yellen to Jerome Powell. Yellen can now make a clean break. Yellen's tenure at the Fed has seen monetary policy take several important steps toward normalization, as the unemployment rate has fallen below most traditional measures of full employment and the inflation rate has finally risen back from uncomfortably low levels that had fueled fears of deflation. With the global economy reviving and commodity prices rebounding, the Fed appears to be firmly on course to gradually raise interest rates over the next few years.
Monetary policy still has long way to go before it gets back to 'normal' and the job of determining what the new normal is and how the Fed get there falls to Jerome Powell and a few players to be named later. Trimming back the Fed's balance sheet and finding the new neutral level for the federal funds rate could prove more difficult than is now expected. This is a big reason why policymakers are not eager to buy into the recent firming in the economic and inflation data. The economy has been at this point a few times before but conditions have been upended by natural disasters, political turmoil and financial turmoil overseas.
We continue to expect the Fed to hike the funds rates three times this year, with the next hike coming at the March 20-21 FOMC meeting. Jerome Powell will outline his expectations for the economy and interest rates at his Semi- Annual Testimony on Monetary Policy in mid or late February to outline any potential changes in the Fed's view on economic growth and inflation. As we noted following the December FOMC meeting, the upgrade in the Fed's 2018 GDP expectations was out of proportion with the modest reduction in expectations for the unemployment rate, which leaves the Fed plenty of flexibility to make the case for an additional rate hike if need be. If stronger GDP growth comes from increased productivity and stronger labor force growth, the Fed could move more gradually.
Yellen’s Final FOMC Meeting a Non-Event as Rates Held Steady
Highlights:
- The target range for the fed funds rate was held steady at 1.25-1.50% in a unanimous decision.
- The Fed's characterization of the economy remained positive as growth in employment, household spending and business investment were all described as "solid."
- Inflation is expected to "move up this year," and the balance of risks to the outlook remains "roughly balanced" but the Fed continues to watch inflation developments closely.
- The Fed noted market-based measures of inflation compensation have increased - breakeven inflation rates up by more than 30 basis points since mid-December to a three year high - but remain low.
Chair Yellen has to be pleased with the economy she is passing on to her successor, Jerome Powell. Unemployment is at its lowest rate since 2000, domestic spending was firing on all cylinders heading into 2018, and inflation remains well behaved even as the economy is running at or beyond full capacity. Conditions are certainly strong enough to warrant higher interest rates, but in keeping with the gradual, predictable policy changes under her tenure, Yellen and company opted to hold steady and simply set the table for a move in March - exactly what markets have been expecting. We too like the odds of a hike at the upcoming meeting and think a once-a-quarter pace of rate increases will continue thereafter. Our call for four rate hikes this year is slightly ahead of both market expectations and the Fed's latest dot plot. In our view, any pause in tightening risks falling behind the curve at a time when tax cuts are set to push the economy into excess demand and risk stoking inflation.